2013年全国研究生数学建模竞赛F题
2013年全国研究生数学建模竞赛C题

2013年全国研究生数学建模竞C题(华为公司合作命题)微蜂窝环境中无线接收信号的特性分析近年来,随着移动通信的发展,对系统容量的要求越来越高,频谱资源越来越紧缺。
微蜂窝、微微蜂窝系统由于采用频谱复用技术缓解这个矛盾而得到广泛应用,这些系统的小区半径小于一千米,造成微蜂窝之间原来的统计相似关系丢失,这给运营商在网络初期规划带来了困难。
因为实际情况经常不满足电磁场模型的条件,并且一般无法求解。
若没有良好的传播预测模型,划分小区、选择基站位置和高度的唯一方法就是通过实际测量、反复测试。
显然这需要投入大量的人力、时间,费用也会很高。
而传播模型则根据对无线传输信道的模拟和仿真,预测接收信号,可以为指导网络规划提供较为准确的理论依据,链路预算小区半径,计算电波传播及干扰,当然希望越精确越好。
目前,比较有代表性的就是射线跟踪模型。
射线跟踪是一种被广泛用于移动通信和个人通信环境(街道微蜂窝和室内微微蜂窝)中的预测无线电波传播特性的技术,由于移动通信中使用的超高频微波和光同属电磁波,有一定近似性(当然还有差别),按光学方法辨认出多路径信道中收、发射机间所有主要的传播路径。
一旦这些传播路径被辨认后,就可根据电波传播理论来计算每条传播路径信号的幅度、相位、延迟和极化,然后结合天线方向图和系统带宽就可得到到达接收点的所有传播路径的相干合成结果。
城市环境下的微蜂窝主要指高楼密集区,覆盖范围大大缩小(半径仅为几百米甚至几十米),基站天线(发射机)低于周围建筑物的高度,电波是在建筑物的“峡谷”当中传播。
因此,电波经过屋顶绕射后再到达地面接收点的射线路径数量非常少,而且其场强与经过建筑物多次反射和绕射的路径相比,往往可以忽略,地面的反射也不考虑。
这些特点构成了微小区中电波传播的主要特点。
因此,可以假设微蜂窝环境下建筑物的高度高于基站天线的高度,从而将三维问题近似地简化成二维问题,只考虑两种传播机制:反射和绕射。
这种简化大大地提高了射线跟踪模型的预测效率,同时能够得到可以接受的预测精度。
13年研究生数学建模D题

(5.1)
式中: IAQI P ——污染物项目 P 的空气质量分指数;
CP ——污染物项目 P 的质量浓度值; BPHi ——文献[2]中表 1 中与 CP 相近的污染物浓度限值的最高值; BPLo ——文献[2]中表 1 中与 CP 相近的污染物浓度限值的最低值;
相关系数ρXY 取值在-1 到 1 之间,ρXY = 0 时,称 X,Y 不相关;|ρXY| = 1 时,称 X,Y 完全相关,此时,X,Y 之间具有线性函数关系; |ρXY| < 1 时,X 的变动引起 Y 的部分变动, ρXY 的绝对值越大, X 的变动就会引起 Y 的变动越大, 当|ρXY|> 0.8 时称为高度相关,当|ρXY| < 0.3 时,称为低度相关,其他为中 度相关。 由表 5.1 可以看出,在 10 个监测点的相关系数的均值中,PM2.5 的浓度含 量与 CO 的浓度含量的相关系数为 0.801, 因此两者高度相关; 与 SO2 、 NO2、 PM10 的相关系数分别为 0.664、0.697、0.762,因此 PM2.5 与三者分别中度相关; 与 O3 相关系数为-0.327,因此定义两者低度相关。ຫໍສະໝຸດ 4.4 对问题 4 的分析
灰箱模型只能针对已发生的类似情况进行预测,因此针对突发状况,即某 监测点的 PM2.5 浓度突然增至数倍,我们可以将此突发情况简化成已知边界条 件的点源扩散模型,将 PM2.5 监测点浓度最高点作为点源,突发状况发生前各 监测点的浓度作为初始条件,并考虑当天的天气影响因素。最后按环保部新修 订的《环境空气质量标准》给出重度污染和可能安全区域。
二、问题的假设
2013年全国研究生数学建模竞赛D题

2013年全国研究生数学建模竞赛D 题空气中PM2.5问题的研究大气为地球上生命的繁衍与人类的发展提供了理想的环境。
它的状态和变化,直接影响着人类的生产、生活和生存。
空气质量问题始终是政府、环境保护部门和全国人民关注的热点问题。
2013年7月12日《中国新闻网》记者周锐报道:“2013年初以来,中国发生大范围持续雾霾天气。
据统计,受影响雾霾区域包括华北平原、黄淮、江淮、江汉、江南、华南北部等地区,受影响面积约占国土面积的1/4,受影响人口约6亿人”(中国国家发展和改革委员会(发改委)2013年7月11日公布在官方网站上的一份报告披露了上述信息,中新社北京7月11日电)。
对空气质量监测,预报和控制等问题,国家和地方政府均制定了相应政策、法规和管理办法。
2012年2月29日,环境保护部公布了新修订的《环境空气质量标准》 (GB3095—2012)[1],本次修订的主要内容:调整了环境空气功能区分类,将三类区并入二类区;增设了颗粒物(粒径小于等于2.5μm)浓度限值和臭氧8小时平均浓度限值;调整了颗粒物(粒径小于等于10μm)、二氧化氮、铅和苯并(a)芘等的浓度限值;调整了数据统计的有效性规定。
与新标准同步还实施了《环境空气质量指数(AQI)技术规定(试行) 》 (HJ633—2012)[2]。
新标准将分期实施,京津冀、长三角、珠三角等重点区域以及直辖市和省会城市已率先开始实施并发布AQI(Air Quality Index);今年113个环境保护重点城市和国家环保模范城市也已经实施;到2015年所有地级以上城市将开始实施;2016年1月1日,将在全国实施新标准。
上述规定中,启用空气质量指数AQI 作为空气质量监测指标,以代替原来的空气质量监测指标――空气污染指数API (Air Pollution Index)。
原监测指标API 为无量纲指数,它的分项监测指标为3个基本指标(二氧化硫2SO 、二氧化氮2NO 和可吸入颗粒物PM10)。
2013年数学建模试卷及答案

葡萄酒的评价摘要葡萄酒的评价结果反映了葡萄酒的优劣程度,而葡萄酒的质量是由多种因素综合决定的。
本文综合考虑了评酒员对葡萄酒的品尝评分、酿酒葡萄及葡萄酒的理化指标等因素,建立了相应的数学模型,利用excel软件,C++编程,变量的相关分析及统计学相关知识等对模型求解,并对所得结果分析比较,对葡萄酒进行评价。
针对问题一,根据附件1中两组品酒员对红、白葡萄酒的品尝评分,分别计算出两组品酒员对红、白葡萄酒各酒样品的评分总值及均值,确定出各酒样品的质量。
通过欧式距离公式,计算出两组品酒员的评价结果差异性数据,得出两组品酒员的评价结果都存在显著性差异。
然后通过计算两组品酒员对两种酒的评价总分的方差均值,判断评价结果的稳定性,从而得出第二组的评价结果更可信。
针对问题二,根据附件2中酿酒葡萄和葡萄酒的理化指标,通过聚类算法对红、白两种葡萄进行聚类划分,将酒样品分为4类。
然后根据葡萄酒质量,划分出样品的等级。
再由葡萄酒样品等级,对聚类后的酿酒葡萄进行分级。
针对问题三,根据附件2,可以得出葡萄酒中的一些物质含量相对于葡萄中的一些物质含量有所减少或增加。
在葡萄酒的制作过程中,由于陈酿条件和发酵工艺及条件可能会造成物质的流失,导致酒中物质含量的减少,而葡萄酒中含量相对增加的物质可能是由葡萄中与其不相关的物质转化而形成的。
通过分析葡萄酒中含量增加的指标与葡萄的各理化指标的相关性系数,判断出酿酒葡萄与葡萄酒的理化指标之间的联系。
针对问题四,对葡萄的理化指标与葡萄酒的评价指标进行相关性分析,结合问题三的结论,得出酿酒葡萄和葡萄酒的理化指标对葡萄酒质量的影响。
根据附件1,可知评价葡萄酒要综合考虑香气、口感等方面,而葡萄和葡萄酒的理化指标主要与口感相关,但并不能决定葡萄酒的质量。
芳香物质与香气有关,在一定程度上也可能会影响葡萄酒的质量。
分别对葡萄和葡萄酒的芳香物质进行聚类分析,将聚类结果与葡萄酒质量等级比较,从而得出结论。
最后,我们就模型存在的不足之处提出了改进方案,并对优缺点进行了分析。
2013年研究生数模竞赛一等奖A题武汉大学10486012队

4.2 对问题一的分析 对于问题一 (1) , 要求画出风扇特性数据表中流量随压比函数值变化的图形 ,附录 4 中给定了九组不同换算转速下的增压比、流量和效率数据。根据附录 3 中对压气机压比函数值 zz 的定义, 即
参赛密码 (由组委会填写)
第十届华为杯全国研究生数学建模竞赛
学
校
武汉大学 10486012 1. 位明露 胡在凰 束远明
参赛队号 队员姓名 2. 3.
参赛密码 (由组委会填写)
第十届华为杯全国研究生数学建模竞赛
题 目
基于部件法的变循环发动机建模法
摘
要:
本文采用部件级建模法精确模拟发动机的各个部件,依据各部件匹配工作时 的 7 个平衡方程,对发动机的性能进行模拟。 针对问题一,为了求解风扇和 CDFS 的出口总温、总压和流量,建立模型对 这两个部件的特性进行精确模拟,利用给定的发动机飞行高度和飞行马赫数,求 解出风扇的出口总温、总压、流量分别为 379.4985、1.3087、19.0483,CDFS 的 出口总温、总压、流量分别为 420.5365、1.8012、17.164。分析得出,气流在进 入风扇和 CDFS 两个压气机部件至流出过程中,总温、总压增大,而气体从风扇 流入到 CDFS 的过程中,总温、总压亦增大,流量减小。此结论符合压气机压缩 气体导致温度升高、压强增大、流量减小的功能特点。 针对问题二,根据发动机整机模型,由七个参数值可计算出平衡残差量。以 平衡残差量最小为原则,对离散化的待估参数进行变域、变步长的搜索,根据当 前的最优解与次优解确定下一步的搜索域与搜索步长,逐步缩小搜索范围、减小 搜索步长,搜索的终止条件设为: (1)高压转速、压比函数值的搜索步长减小至 0.01,主燃烧室出口温度的搜索步长减小至 10; (2)最优解与次优解相同。搜 索的终止条件保证了解的精度与收敛性。依此算法搜索得到高压转速、压比函数 值(风扇、CDFS、高压压气机、高压涡轮、低压涡轮) 、主燃烧室出口温度的最 优解分别为 1.00,0.33,0.43,0.53,0.14,0.12,1520 ,此时平衡方程残差量为 0.2550。 逐步搜索过程中参数的解与平衡方程的残差趋于固定值,参数的解为模 型的收敛解。 针对问题三(1) ,为了保证发动机性能最优,求解 CDFS 导叶角度、低压涡 轮导叶角度和喷管喉道面积 3 个变量,实质上是一个优化的问题。本文建立优化 模型,采用单位推力和耗油率的线性组合构建一个新的性能评价指标 ˆ 。( 、 为比例系数) ˆ sfc A 1Fs ,以其最小值作为目标函数,同时借鉴 1 2 2
2013全国研究生,数学建模竞赛
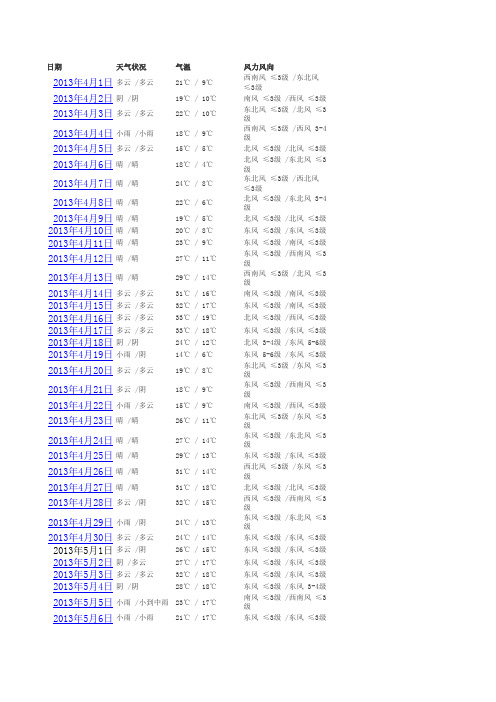
天气状况 多云 /多云 阴 /阴 多云 /多云 小雨 /小雨 多云 /多云 晴 /晴 晴 /晴 晴 /晴 晴 /晴 晴 /晴 晴 /晴 晴 /晴 晴 /晴 多云 /多云 多云 /多云 多云 /多云 多云 /多云 阴 /阴 小雨 /阴 多云 /多云 多云 /阴 小雨 /多云 晴 /晴 晴 /晴 晴 /晴 晴 /晴 晴 /晴 多云 /阴 小雨 /阴 多云 /多云 多云 /阴 阴 /多云 多云 /多云 阴 /阴
2013年4月1日 2013年4月2日 2013年4月3日 2013年4月4日 2013年4月5日 2013年4月6日 2013年4月7日 2013年4月8日 2013年4月9日 2013年4月10日 2013年4月11日 2013年4月12日 2013年4月13日 2013年4月14日 2013年4月15日 2013年4月16日 2013年4月17日 2013年4月18日 2013年4月19日 2013年4月20日 2013年4月21日 2013年4月22日 2013年4月23日 2013年4月24日 2013年4月25日 2013年4月26日 2013年4月27日 2013年4月28日 2013年4月29日 2013年4月30日 2013年5月1日 2013年5月2日 2013年5月6日
小雨 /小到中雨 23℃ / 17℃ 小雨 /小雨 21℃ / 17℃
2013年5月7日 2013年5月8日 2013年5月9日 2013年5月10日 2013年5月11日 2013年5月12日 2013年5月13日 2013年5月14日 2013年5月15日 2013年5月16日 2013年5月17日 2013年5月18日 2013年5月19日 2013年5月20日 2013年5月21日 2013年5月22日 2013年5月23日 2013年5月24日 2013年5月25日 2013年5月26日 2013年5月27日 2013年5月28日 2013年5月29日 2013年5月30日 2013年5月31日 2013年6月1日 2013年6月2日 2013年6月3日 2013年6月4日 2013年6月5日 2013年6月6日 2013年6月7日 2013年6月8日 2013年6月9日 2013年6月10日 2013年6月11日 2013年6月12日
2012-2013数学建模试题答案及讲解

5 284.572 255.428 11 292.299 247.701
6 286.766 253.234 12 292.793 247.207
可以看出A城公司支付基金数在逐步增加,但增幅逐步变
小;B 城公司的基金数变化则正好相反.然而ak是否有上界、 bk是否有下界? bk是否会小于220?我们还是不能断言.进 行更多的迭代或许得出更明显的提示,不过这里将不再进
在式(13)中取k=N而在式(14)中取k=M并注意到F0=0,
FM=0 ,这样只要消去FN,就可以导出关于r的一个方程:
0 p [(1 r)N 1 ](1 r)M N q [(1 r)M N 1 ]
r
r
整理得
(1r)M(1q)(1r)M Nq0
p
p
记x=r+1 ,且将已知数据代入,则只需求解方程
三、模型的分析及建立
以商业性贷款10000元为例来考察,一年期贷款的年 利率为6.12%,到期一次还本付息总计10612元, 这很
容 易理解. 然而二年期贷款的年利率为6.255%, 月还款数 444.356元为本息总额10664.54元的二十四分之一,这
后 两个数字究竟怎样产生的呢?是根据本息总额算出月还款 数还是恰好相反(从6.255%似乎不那么明显能得到 10664.54)?让我们稍微仔细一些来进行分析.由于贷款
B 1 B 2 B k B 1 [ 1 ( 1 r ) ( 1 r ) k 1 ]
(1r)k1 (A1A0)[ r ]
(1r)k1 [(1r)A 0m A 0][ r ]
从而得到差分方程(1)的解
A k1(1r)A km
A kA 0(1r)km r[(1r)k1] (7)
将A24 、A0 、r 的值和k=24代入,可解得 m=444.3560(元),这与表3中的数额完全一致,这样我们就 了解了还款额的确定方法.
2013年研究生数学建模优秀论文F5

第十届华为杯全国研究生数 10327016 1.李叶涵
参赛队号
队员姓名
2.李雨泽 3.王丹华
参赛密码 (由组委会填写)
第十届华为杯全国研究生数学建模竞赛
题 目: 中国城乡居民养老制度可持续性的精算研究
摘
要
本文针对中国养老保险基金问题,基于当前养老保险体制,建立中国城乡居 民养老保险基金收支模型, 对养老金缺口进行定量研究,并预测养老金缺口未来 趋势, 通过计算机仿真手段,测算了保证养老保险体系可持续性的替代率和缴费 率的最优区间,以及预测了相关政策措施的效果。 模型Ⅰ——中国城乡居民养老金收入-支出精算模型 依据中国现行养老保 险制度,在合理的假设下,分多个层次(基本养老金和企业年金) 、多个角度(城 镇和农村),并考虑到新政策下“老人” 、 “中人” 、 “新人”的不同情况,构建具 有“多缴多得,长缴多得”特征的中国城乡居民养老金收入精算模型(2.12)和 中国城乡居民养老金收入精算模型(2.28) ,从而解决了问题一。 模型Ⅱ——养老金缺口预测模型 依据养老金缺口形成原因和现实情况,基 于修正后的模型Ⅰ,采用改进的 logistic 人口预测模型对参保在职人口的预测值 和相应数据,建立养老金缺口预测模型(3.3) ,预测出 2013 年至 2035 年的养老 金缺口值 (结果见表 3.1) ,以及目标期间内养老金缺口的最大值发生在 2030 年, 为 40.25 万亿元,并对预测结果的合理性进行分析;根据十八大提出的收入倍增
关键词:养老金收支模型;养老金缺口;系统仿真;可持续化;可调节变量
目
录
-
1 前 言.................................................................................................................. - 5 1.1 问题重述................................................................................................. - 5 1.2 知识储备................................................................................................. - 5 1.3 问题分析................................................................................................. - 6 1.4 模型假设................................................................................................. - 6 1.5 模型符号与说明...................................................................................... - 7 1.6 本文的架构设计..................................................................................... - 7 2 问题一的解答.................................................................................................... - 8 2.1 问题一的分析......................................................................................... - 8 2.2 模型的建立............................................................................................. - 9 2.2.1 我国城乡基本养老保险金动态收入宏观数学模型.................. - 9 2.2.2 我国城乡基本养老保险金动态支出宏观数学模型................ - 12 2.3 模型分析............................................................................................... - 16 3 问题二的解答................................................................................................ - 16 3.1 问题二的分析....................................................................................... - 16 3.2 模型的建立........................................................................................... - 16 3.2.1 logistic 人口预测模型........................................................... - 16 3.2.2 养老金缺口预测模型建立........................................................ - 17 3.3 实证分析................................................................................................ - 18 3.3.1 数据来源..................................................................................... - 18 3.3.2 实证结果..................................................................................... - 18 3.3.3 结果分析..................................................................................... - 20 3.3.4 模型改进..................................................................................... - 21 4 问题三的解答................................................................................................ - 21 4.1 问题的分析............................................................................................ - 21 4.2 国外养老保险制度分析比较............................................................... - 22 4.3 缴费率及替代率的系统仿真模型....................................................... - 24 4.3.1 模型建立..................................................................................... - 24 4.3.2 实证分析.................................................................................... - 25 4.3.3 结果分析.................................................................................... - 27 4.4 政策仿真评价模型............................................................................... - 27 4.4.1 模型实现..................................................................................... - 27 4.4.2 结果分析..................................................................................... - 27 5 问题四的解答................................................................................................ - 28 5.1 可调节变量综述................................................................................... - 28
2013年全国研究生数学建模竞赛E题

2013年全国研究生数学建模竞赛E 题中等收入定位与人口度量模型研究居民收入分配关系到广大民众的生活水平,分配公平程度是广泛关注的话题。
其中中等收入人口比重是反映收入分配格局的重要指标,这一人口比重越大,意味着收入分配结构越合理,称之为“橄榄型”收入分配格局。
在这种收入分配格局下,收入差距不大,社会消费旺盛,人民生活水平高,社会稳定。
一般经济发达国家都具有这种分配格局。
我国处于经济转型期,收入分配格局处于重要的调整期,“橄榄型”收入分配格局正处于形成阶段。
因此,监控收入分配格局的变化是经济社会发展的重要课题,例如需要回答,与前年比较,去年的收入分配格局改善了吗?改善了多少?可见实际上需要回答三个问题:什么是“橄榄型”收入分配格局?收入分配格局怎样的变化可以称之为改善?改善了多少?直观上,中间部分人口增加,则收入分配格局向好的方向转化。
于是基本问题回答什么是中间部分。
一个国家的收入分配可以用统计分布表示,图1是某收入分配的密度函数)(x f ,其中0≥x 表示收入(仅考虑正的收入),0x 是众数点,m 是中位数点,μ是平均收入。
收入分配经验分析说明,收入分配曲线一般是所谓正偏的,即峰值点向左偏,右端拖一个长尾巴,且通常有μ<<m x 0 (1)记对应的分布函数为)(x F ,则)(x F p =表示收入低于或等于x 的人口比例。
由于21)(=m F ,(1)式意味着收入大于或等于平均收入的人口一定不到半数,因此是少数。
记收入低于或等于x 的人口群体拥有收入占总收入的比例为)(p L ,则应有⎰=x t t tf p L 0d )(1)(μ,)(x F p = (2))(p L 称之为收入分配的洛伦兹曲线。
显然,如果)(1p L 与)(2p L 是两个不同收入分配的洛伦兹曲线,若对任何)1,0(∈p 都有)()(21p L p L ≥,则)(1p L 对应的收入分配显然更优,因为在)(1p L 中,任何低收入端人口拥有的总收入比例更大。
2013年美赛数模A题答案

中国水资源战略摘要Summary为了确定中国最佳的水资源战略,将中国分为九大流域,首先借助MATLAB建立多项式拟合模型来预测出中国2013年到2025年每年各流域的供水量和需水量,接着在可持续发展的原则指导下建立区域水资源合理配置模型,对每一个流域,采用水资源综合短缺度最小为目标函数, 对地表水、地下水等多种水源统筹考虑, 用权重区别对待工业、农业、生活、生态环境等不同领域的用水需求, ,从而求出各个流域最小的缺水量。
再根据前面的两个模型所预测出来的各流域的缺水量,建立最佳的补水模型解决缺水问题:通过对实际问题的分析,可能的补水方案有两个:方案一是直接从珠江流域调水到缺水的流域,方案二是沿海流域采取海水淡化补水,内陆流域采取直接从珠江流域调水过去,经过分析、计算发现方案二是最佳的。
最后,我们统筹考虑我们所制定的水策略,发现其无论是对经济、社会还是生态环境都将产生重大影响。
In order to determine the best water resources strategy, we divided China into nine basins. Firstly, we established polynomial fitting model with the use of MATLAB to predict the water supply and the water demand of every basin from 2013 to 2025. Secondly, we established the regional water resources rational allocation model under the guidance of the principle of sustainable development. In this model, through taking the minimum comprehensive water shortage degree as objective , surface water , groundwater and other water are considered, and different weightings are used for industrial, agricultural, domestic and ecological water users in order to realize regional water resources rational allocation .In this way can we obtained the minimum amount of water scarcity in every basin. Thirdly, according to the data predicted based on the previous two models, we can establish the optimal replenishment model to solve the problem of water shortage. We identified two possible replenishment program based on the analysis of the actual problems. One is to transfer the water of the Pearl River to basins where lack of water resources, another is to transfer the water of the Pearl River to inland basins directly while we meet the water shortage of coastal basins by desalination. After analysis and calculation, we find second program is the best. Finally, we find the water strategy we developed has a significant impact on the economic, social and ecological environment after we considered the models we established.关键字:水策略多项式拟合模型区域水资源合理配置模型补水模型Keywords:Water strategythe Polynomial fitting modelThe Regional water resources rational allocation modelthe Replenishment model§1.问题重述Problem restatement水是生命之源, 是人类生存和发展不可替代的资源, 是经济、社会可持续发展的基础。
全国研究生数学建模竞赛题目
中国研究生数学建模竞赛试题汇总2021赛题汇总2021-A:相关矩阵组的低复杂度计算和存储建模2021-B:空气质量预报二次建模2021-C:帕金森病的脑深部电刺激治疗建模研究2021-D:抗乳腺癌候选药物的优化建模2021-E:信号干扰下的超宽带(UWB)精确定位问题2021-F:航空公司机组优化排班问题2020赛题汇总2020-A:芯片相噪算法2020-B:汽油辛烷值建模2020-C:面向康复工程的脑信号分析和判别建模2020-D:无人机集群协同对抗2020-E:能见度估计与预测2020-F:飞行器质心平衡供油策略优化2019赛题汇总2019-A: 无线智能传播模型2019-B:天文导航中的星图识别2019-C:视觉情报信息分析2019-D:汽车行驶工况构建2019-E:全球变暖?2019-F:多约束条件下智能飞行器航迹快速规划2018赛题汇总2018-A :关于跳台跳水体型系数设置的建模分析2018-B:光传送网建模与价值评估2018-C:对恐怖袭击事件记录数据的量化分析2018-D:基于卫星高度计海面高度异常资料获取潮汐调和常数方法及应用2018-E:多无人机对组网雷达的协同干扰2018-F:机场新增卫星厅对中转旅客影响的评估方法2017赛题汇总2017-A:无人机在抢险救灾中的优化运用2017-B:面向下一代光通信的VCSEL激光器仿真模型(华为命题)2017-C:航班恢复问题2017-D:基于监控视频的前景目标提取2017-E:多波次导弹发射中的规划问题2017-F:构建地下物流系统网络2016赛题汇总2016-A:多无人机协同任务规划2016-B:具有遗传性疾病和性状的遗传位点分析2016-C:基于无线通信基站的室内三维定位问题2016-D:军事行动避空侦察的时机和路线选择2016-E:粮食最低收购价政策问题研究2015赛题汇总2015-A:水面舰艇编队防空和信息化战争评估模型2015-B:数据的多流形结构分析2015-C:移动通信中的无线信道“指纹”特征建模2015-D:面向节能的单/多列车优化决策问题2015-E:数控加工刀具运动的优化控制2015-F:旅游路线规划问题2014赛题汇总2014-A:小鼠视觉感受区电位信号(LFP)与视觉刺激之间的关系研究2014-B:机动目标的跟踪与反跟踪2014-C:无线通信中的快时变信道建模2014-D:人体营养健康角度的中国果蔬发展战略研究2014-E:乘用车物流运输计划问题2013赛题汇总2013-A:变循环发动机部件法建模及优化2013-B:功率放大器非线性特性及预失真建模2013-C:微蜂窝环境中无线接收信号的特性分析2013-D:空气中PM2.5问题的研究2013-E:中等收入定位与人口度量模型研究2013-F:可持续的中国城乡居民养老保险体系的数学模型研究2012赛题汇总2012-A:基因识别问题及其算法实现2012-B:基于卫星无源探测的空间飞行器主动段轨道估计与误差分析2012-C:有杆抽油系统的数学建模及诊断2012-D:基于卫星云图的风矢场(云导风)度量模型与算法探讨2011赛题汇总2011-A:基于光的波粒二象性一种猜想的数学仿真2011-B:吸波材料与微波暗室问题的数学建模2011-C:小麦发育后期茎秆抗倒性的数学模型2011-D:房地产行业的数学建模2010赛题汇总2010-A:确定肿瘤的重要基因信息2010-B:与封堵溃口有关的重物落水后运动过程的数学建模2010-C:神经元的形态分类和识别2010-D:特殊工件磨削加工的数学建模2009赛题汇总2009-A:我国就业人数或城镇登记失业率的数学建模2009-B:枪弹头痕迹自动比对方法的研究2009-C:多传感器数据融合与航迹预测2009-D:110警车配置及巡逻方案2008赛题汇总2008-A:汶川地震中唐家山堰塞湖泄洪问题2008-B:城市道路交通信号实时控制问题2008-C:货运列车的编组调度问题2008-D:中央空调系统节能设计问题2007赛题汇总2007-A:建立食品卫生安全保障体系数学模型及改进模型的若干理论问题2007-B:机械臂运动路径设计问题2007-C:探讨提高高速公路路面质量的改进方案2007-D:邮政运输网络中的邮路规划和邮车调度2006赛题汇总2006-A:Ad Hoc网络中的区域划分和资源分配问题2006-B:确定高精度参数问题2006-C:维修线性流量阀时的内筒设计问题2006-D:学生面试问题2005赛题汇总2005-A:Highway Traveling time Estimate and Optimal Routing 2005-B:空中加油2005-C:城市交通管理中的出租车规划2005-D:仓库容量有限条件下的随机存贮管理2004赛题汇总2004A:发现黄球并定位2004B:实用下料问题2004C:售后服务数据的运用2004D:研究生录取问题。
2013数学建模竞赛答案

表错误!未找到引用源。
.1 单面印刷文字碎纸片(附件1:中文)复原后序号表位置 1 2 3 4 5 6 7 8 9 10 图片008 014 012 015 003 010 002 016 001 004 位置11 12 13 14 15 16 17 18 19图片005 009 013 018 011 007 017 000 006注:扩展名为.bmp,下同表错误!未找到引用源。
.2 单面印刷文字碎纸片(附件2:中文)复原后序号表位置 1 2 3 4 5 6 7 8 9 10 图片003 006 002 007 015 018 011 000 005 001 位置11 12 13 14 15 16 17 18 19图片009 013 010 008 012 014 017 016 004表4.3 单面印刷文字碎纸片(附件3:中文)复原后序号表表4.4 单面印刷文字碎纸片(附件4:英文)复原后序号表表4.6 双面印刷文字碎纸片(附件5:英文)复原后序号表2复原图见下页附录G主要算法程序%部分求解代码b=[];c=[];filename=cell(1,19);for i=0:18filename(i+1)={[sprintf('%03d',i) '.bmp']};a=imread(['附件2\\' filename{i+1}]);a=im2bw(a);b=[b a(:,72)]; %每片最后一列c=[c a(:,1)]; %每片第一列endminnonzero=[]; %匹配到最小的非0个数matchresult=[]; %匹配结果for k=1:19matindex=-1;minnonzero(k)=size(b,1);if size(nonzeros(b(:,k)),1)~=size(b(:,k),1) for i=1:19d=c(:,i)-b(:,k);nonzero=size(nonzeros(d),1);%for j=1:size(d,1)% if d(j)% nonzero=nonzero+1;% end%endif nonzero<minnonzero(k)minnonzero(k)=nonzero;matindex=i;endendelsematindex=0; %是纸张的两端endmatchresult(k)=matindex;endmatchresult=matchresult-1;newfile=cell(1,19);index=-1;for i=19:-1:1for j=1:19%matchresult(j)if matchresult(j)==indexnewfile(i)=filename(j);index=j-1;break;endendendj=1:19;%xlswrite('result.xls',filename,'第一问','B6');%xlswrite('result.xls',matchresult,'第一问','B7'); %xlswrite('result.xls',minnonzero,'第一问','B8'); xlswrite('result.xls',j,'第一问','B4');xlswrite('result.xls',newfile,'第一问','B5');a=[];for i=0:18a=[a imread(['附件2\\' newfile{i+1}])]; endimshow(a)。
【VIP专享】2013年全国数模竞赛答卷模版

承诺书我们仔细阅读了《全国大学生数学建模竞赛章程》和《全国大学生数学建模竞赛参赛规则》(以下简称为“竞赛章程和参赛规则”,可从全国大学生数学建模竞赛网站下载)。
我们完全明白,在竞赛开始后参赛队员不能以任何方式(包括电话、电子邮件、网上咨询等)与队外的任何人(包括指导教师)研究、讨论与赛题有关的问题。
我们知道,抄袭别人的成果是违反竞赛章程和参赛规则的,如果引用别人的成果或其他公开的资料(包括网上查到的资料),必须按照规定的参考文献的表述方式在正文引用处和参考文献中明确列出。
我们郑重承诺,严格遵守竞赛章程和参赛规则,以保证竞赛的公正、公平性。
如有违反竞赛章程和参赛规则的行为,我们将受到严肃处理。
我们授权全国大学生数学建模竞赛组委会,可将我们的论文以任何形式进行公开展示(包括进行网上公示,在书籍、期刊和其他媒体进行正式或非正式发表等)。
我们参赛选择的题号是(从A/B/C/D中选择一项填写): A我们的参赛报名号为(如果赛区设置报名号的话):所属学校(请填写完整的全名)湖州师范学院参赛队员(打印并签名) :1. 袁仁娟2. 曾旭燕3. 黄小芳指导教师或指导教师组负责人(打印并签名):吕瑜佩(论文纸质版与电子版中的以上信息必须一致,只是电子版中无需签名。
以上内容请仔细核对,提交后将不再允许做任何修改。
如填写错误,论文可能被取消评奖资格。
)日期: 2013 年 9 月 16 日赛区评阅编号(由赛区组委会评阅前进行编号):编号专用页赛区评阅编号(由赛区组委会评阅前进行编号):赛区评阅记录(可供赛区评阅时使用):评阅人评分备注全国统一编号(由赛区组委会送交全国前编号):全国评阅编号(由全国组委会评阅前进行编号):车道被占用对城市道路通行能力的影响摘要车道被占用是指因交通事故、路边停车、占道施工等因素,导致车道或道路横断面通行能力在单位时间内降低的现象。
如处理不当,甚至出现区域性拥堵。
本文围绕车道被占用对城市道路通行能力的影响进行讨论,我们分别对车辆数进行分类统计,从数据分析结果充分认识到车道被占用对城市道路通行的影响的严重性,旨在为更好的建设高速公路提供适当的参数指标及策略依据,从而提高道路的交通能力。
2013年全国研究生数学建模竞赛B题论文

参赛密码(由组委会填写)第十届华为杯全国研究生数学建模竞赛学校南京邮电大学参赛队号10293015队员姓名1.仲伟奇2.卢诗尧3.江爱珍参赛密码(由组委会填写)第十届华为杯全国研究生数学建模竞赛题 目 功率放大器非线性特性及预失真建模摘 要:本文根据函数逼近Weierstrass 定理对功放的非线性特性建立多项式数学模型。
对于无记忆功放,直接用matlab 中polyfit 函数或矩阵运算求解,用NMSE 值来评价不同阶数所得的多项式模型,最终将多项式模型的阶数定为4,此时47.13NMS dB E -=,系数详见4.1.3;根据线性原则和两个约束条件建立预失真的多项式模型,采用查表法求得预失真器的输入和输出,建立目标误差函数21ˆmin |()()|Nn GE z n z n ==-∑,用polyfit 函数或矩阵运算求解,最终根据GE 值最小确定多项式阶数为12, 此时-50.877B NMSE d =,系数详见4.2.3。
对于有记忆功放,在无记忆的基础上建立模型,增加延迟项来表征记忆效应,通过矩阵运算求解,然后用NMSE 值评估确定记忆效应多项式阶数为4,记忆深度为3,此时44.3839NMSE dB =-,系数详见4.3.3;根据功放的非线性模型,,建立预失真器的有记忆效应多项式模型,利用功放的输入输出数据间接得到预失真器的输入输出,再用矩阵运算,用NMSE 值来评估确定阶数为4,记忆深度为3,系数详见4.4.3,此时19.0058NMSE dB =-。
运用自相关函数和功率谱密度是一对傅里叶变换对的性质,对自相关函数作傅里叶变换求得功率谱密度,分析得出传输信道范围,最终得出输入信号、有无预失真补偿三类信号的A C P R 值分别为47.1212dB-,37.4586dB -,38.7557dB -,得出预失真补偿后的ACPR 值要比补偿前要小。
关键词:数据拟合 查表法 NMSE/EVM 评价 矩阵运算 多项式模型功率放大器非线性特性及预失真建模一问题重述1.1 问题引入信号的功率放大是电子通信系统的关键功能之一,其实现模块称为功率放大器(PA,Power Amplifier),简称功放。
研究生数学建模大赛

研究生数学建模竞赛全国研究生数学建模竞赛(National Post-Graduate Mathematical Contest in Modeling)是“全国研究生创新实践系列活动”的主题赛事之一,由教育部学位与研究生教育发展中心主办。
该赛事起源于2003年东南大学发起并成功主办的“南京及周边地区高校研究生数学建模竞赛”,2013年被纳入教育部学位中心“全国研究生创新实践系列活动”。
其宗旨是为广大研究生探究实际问题、开展学术交流、培养团队意识搭建有效平台,培养研究生创新意识,提升研究生创新实践能力,进一步推动研究生培养机制改革和“研究生教育创新计划”的实施,促进研究生培养质量的提高。
数模君这就带大家来看看题目。
A题:无线智能传播模型。
被称作是华为公司面试offer题。
中国历经“2G跟随、3G突破”,实现了“4G同步”“5G引领”的历史性跨越。
5G网络是发展人工智能(AI)等新一代产业的基础设施。
随着5G技术的发展,5G 在全球范围内的应用也在不断地扩大。
运营商在部署5G网络的过程中,需要合理地选择覆盖区域内的基站站址,进而通过部署基站来满足用户的通信需求。
在整个无线网络规划流程中,高效的网络估算对于精确的5G 网络部署有着非常重要的意义。
B题:天文导航中的星图识别天文导航(Celestial Navigation)是基于天体已知的坐标位置和运动规律,应用观测天体的天文坐标值来确定航行体的空间位置等导航参数。
与其他导航技术相比,天文导航是一种自主式导航,不需要地面设备,不受人工或自然形成的电磁场的干扰,不向外界辐射能量,隐蔽性好,而且定姿、定向、定位精度高,定位误差与时间无关,已被广泛用于卫星、航天飞机、远程弹道导弹等航天器。
C题:视觉情报信息分析研究表明,一般人所获取的信息大约有80%来自视觉。
视觉信息的主要载体是图像和视频,视觉情报指的是通过图像或者视频获取的情报。
从图像或视频中提取物体的大小、距离、速度等信息是视觉情报分析工作的重要内容之一,如在新中国最著名的“照片泄密案”中,日本情报专家就是通过《中国画报》的一幅封面照片解开了大庆油田的秘密。
2013全国研究生,数学建模竞赛

A Ray-Tracing Method for Modeling Indoor Wave Propagation and Penetration Chang-Fa Yang,Member IEEE,Boau-Cheng Wu,and Chuen-Jyi KoAbstract—In this paper,a ray-tracing method for waves prop-agating inside building structures is presented.Ray tubes are used to model the wave propagation and penetration and all the significantly reflected and transmitted ray tubes from interfaces are included.Also,the cross sections of the ray tubes at the field points are evaluated tofind the spreading factors of the waves and then the geometrical optics(GO)contributions at the locations of the receiving antenna.A program has been developed according to this ray-tracing technique that can be applied to simulate waves transmitted through and reflected from electrically large complex two-dimensional(2-D)and three-dimensional(3-D)bodies.To verify this ray-tracing program,2-D moment method(MM)solutions for wave propagating in a two-room structure and also through a stair-shaped wall above a lossy ground are used to compare with those obtained from the ray tracing.Besides,comparisons offield measurements and ray-tracing simulations at900and1800MHz performed in a corridor on differentfloors and inside a staircase are shown.The effective complex dielectric constants of the building structures determined from a free-space method are employed in the simulations and a vector network analyzer is used for thefield measurements. Good agreements are obtained.In addition,measured results for waves penetrating an exterior wall with metal-framed windows at 1290MHz are employed to test the ray-tracing solutions,which indicate that scattering from the metal frames may be significant forfield points near the windows.This ray-tracing program can be applied to evaluate the channel characteristics for the indoor wireless communications.Index Terms—Geometrical optics,indoor radio communica-tion,ray-tracing method.I.I NTRODUCTIONT HIS paper presents a ray-tracing method for simulating indoor radio wave propagation and penetration.Similar problems had been studied by other investigators[1]–[7].Total path loss per transmission of slab structures and multiple reflections from boundaries were included in their ray-tracing techniques to determine the geometrical optics(GO)contribu-tions.In our method,those GO rays are traced by including multiple reflections and transmissions not only in the buildings, but also inside the material structures.The waves from a transmitting antenna are simulated by shooting many ray tubes,each composed of four rays,in all directions based on the far-field pattern of the antenna,and the spreading factors of the GOfields are evaluated from the cross-sectionManuscript received March3,1997;revised January9,1998.This work was supported by the R.O.C.National Science Council under Grants NSC 84-2221-E-011-001,NSC85-2213-E-011-018,and NSC86-2221-E-011-011. The authors are with the Department of Electrical Engineering,National Taiwan University of Science and Technology,Taipei,Taiwan,R.O.C. Publisher Item Identifier S0018-926X(98)04620-1.area of the ray tubes.Wave propagation and penetration in electrically large two-dimensional(2-D)and three-dimensional (3-D)arbitrary bodies may be determined by applying this ray-tracing approach.A2-D moment method(MM)[8]is employed to compare with the ray-tracing method for2-D lossy structures where bothflat and stair-shaped slabs above a lossy ground are examined.The MM can provide numerically exact solutions, but is limited by the available memories and CPU time of the computer resources.However,by choosing the objects as small as just a few wavelengths,accurate MM results can be obtained to verify the ray-tracing program.For the3-D problems,field measurements in a corridor on differentfloors and inside a staircase of the NTUST’s buildings are performed and the results at900and1800MHz are compared with those obtained from the ray tracing.A vector-network analyzer,an amplifier, and two dipole antennas were used in those measurements. Open-site measurements with the two antennas separated1m apart and located1.3m above the ground were used as the reference for the indoor measurements.On the other hand,a 3-D ray-tracing program was developed to model the radio-wave propagation and penetration in buildings.The building structures are modeled as lossy dielectric blocks with uniform complex dielectric properties measured by using a free-space approach[9].Comparisons of the measured and simulated results are shown;besides,measured data reported in[10] for waves at1290MHz coming through an external wall with metal-framed windows from a far distance are taken to examine the ray-tracing simulations.The ray-tracing method is described in Section II. Section III presents the comparisons of the2-D MM and the ray-tracing solutions.Thefield measurements and ray-tracing simulations for indoor wave propagation and penetration are discussed in Section IV.Conclusions are given in Section V.II.R AY-T RACING M ETHODThe waves from a transmitting antenna can be modeled as many ray tubes shooting from the location of the antenna[11]. In our ray-tracing program,every ray tube is composed of four rays defined by the incrementsofcentered at the antenna is divided into quadrilateral cells that are close to squares with approximately the same area by selecting afixed about equalto .The valueofFig.1.Ray tubes are composed of four rays defined by 1 and 1 in the local spherical coordinates centered at the transmitting antenna and the solid angles of the tubes are about thesame.Fig.2.A ray propagates from P 1to P 2on an intercepting plane.todetermine,which is then adjustedforcoordinate.Besides,for the dipole antenna,the axis of the dipole is chosen to be thelocaland the tubesalong thelocal(1)whereis the directional vector of the incident rayand(2)which is obtained from therelation .For a finite-size interface,it is also necessary to check whether the incident point is within the boundary of the interface or not.All interfaces that may be illuminated by the ray tube should be tested to find the incident points and the incident point with the shortest path lengthfromYANG et al.:RAY-TRACING METHOD FOR INDOOR WA VE PROPAGATION AND PENETRATION909 it into a“stack,”while the other one is continuouslytraced.The data set for each stored ray tube includesthe directional vectors,positions,total path lengths,andE-field phasors(excluding the spreading factor)of thefour rays.If both ray tubes are ended,a previously savedray-tube data set is then popped from the stack and theray-tracing procedure is started again.When the stackis empty,a new initial ray tube from the transmittingantenna is traced untilfinished.Multiple reflections andtransmissions through walls,ceiling,stairs,floors,andother electrically large bodies can be simulated bothin air and in the structures to properly model wavepropagation and penetration in buildings.4)When a ray tube enters the room containing the receivingantenna,as shown in Fig.3,a test is then performed todetermine whether or not this tube passes through thereceivingpointwith.However,was actually employed insteadofis the product of the propagation phase vari-ations and exponential losses for this ray contributionstartingfrom,and SF is the spreading factor.Fromthe conservation of energyflux in a ray tube[12],SFcan be obtained byusingare the cross-sectional areas of the raytubes at the referencepoint and thefieldpoint.Since both reflection and transmission ray tubes are tracedat each interface and the spreading factor is determined fromthe cross-sectional area of the ray tube,this ray-tube tracingmethod can be applied tofind the reflection and transmissioncontributions for rather complicated structures.In addition toflat slabs,shapes like wedges,rectangular cylinders,stairs,or curved blocks can be analyzed by using this approachto correctly evaluate the GO contributions including multiplereflections and transmissions.III.C OMPARISONS OF THE R AY-T RACINGM ETHOD AND THE M OMENT M ETHODA ray-tracing program for both2-D and3-D structureshas been developed according to the procedure described inthe previous section.To simulate2-D cases,the3-D ray-tracing technique is modified slightly byfixing the centerof each ray tube along the cross-sectional plane of the2-Dobjects and using the arc-length instead of the area in(4)for determining the spreading factor.This section presentsray-tracing results for waves propagating in2-D structures,and compares the results with those obtained from the MM.The solutions determined by the MM is numerically exact,aslong as the segmentation of the objects is small enough.Dueto the limitations of the computer memory and CPU time,the MM is usually applied for analyzing smaller objects inwavelengths.On the other hand,the ray-tracing method is ahigh-frequency approximation technique,which requires thedimensions of the objects be in the order of wavelengths orlarger for accurate results.Therefore,the ray-tracing methodis more suitable for modeling the indoor wave propagationfor wireless communications.However,by choosing structureswith dimensions around a few wavelengths,the MM can beused to check and verify the ray-tracing program.A2-D problem shown in Fig.4was simulated by usingboth the MM[8]and the ray-tracing method.An infiniteunit electric-line source is located in the right-side roomand the E-fields inside the other room are evaluated in thepresence of a lossy half-space.Some results at the frequencyof450MHz are given in Figs.5and6for lossless and lossystructures,respectively.The size of the structures is just a few910IEEE TRANSACTIONS ON ANTENNAS AND PROPAGA TION,VOL.46,NO.6,JUNE1998Fig.4.An infinite line source radiates into a2-D two-room structure. wavelengths and can be accurately solved by the MM.Those dimensions are also large enough for the ray-tracing method. However,due to the GO approximations,some discontinuities exist in the ray-tracing results.Also,the locations and values of the peaks and valleys are slightly different between those two solutions.Higher order modes in MM(i.e.,diffractions from edges and surface waves due to the lossy ground)will cause stronger resonance in the enclosed room and also remove the discontinuities.Nevertheless,the overallfield variations obtained from those two methods are still quite similar.The good agreements between them verify most part of the ray-tracing program,since only the directions of the rays are restricted and2-D spreading is used for solving the2-D problems.Besides,thefields in the lossy case are about three times lower than those in the lossless case and,therefore,the good comparisons also suggest that the use of the complex dielectric constants in the lossless formula seem appropriate even for such a lossy material.Fig.7shows a stair-shaped wall above a lossy ground illuminated by an infinite line source(Tx).Thefields over the left side of the wall(Rx)were evaluated by using both the ray-tracing method and the MM.The results are given in Fig.8,where the frequency is at900MHz and the complexdielectric constant of thewall is to model reinforcedconcrete(RC)structures[9].Since more discontinuities exist in the stair-shaped structures than those of theflat slabs in Fig.4,the ray-tracing solutions in Fig.8(a)indicate more abruptfield variations and larger errors due to the stronger higher order modes not included in the ray tracing.However, the ray-tracing results can still predict the overall level of the fields and locate the about positions of the peaks and valleys, especially at locations away from the wall.Since the rays may bounce between different sections of the stairs,multiple reflections inside the stair-shaped wall need to be traced and the variations of the spreading factor after reflections and transmissions should be properly evaluated,i.e.,(4),tofind the correct GO rays reflected from or transmitted through the stair-shaped wall.IV.C OMPARISONS OF THE R AY-T RACINGS IMULATIONS AND F IELD M EASUREMENTSThis section presentsfield measurements and ray-tracing simulations for indoor radio-wave propagation andpenetration.(a)(b)Fig.5.E-field distributions at450MHz in the left-side room of Fig.4for lossless structures("r=2)determined from(a)the ray-tracing method and (b)the MM.A vector network analyzer(VNA—HP8510C or HP8753B), an amplifier,and two dipole antennas were used to perform the measurements in a building at our university,as shown in Fig.9.Results with the antennas located in a corridor, on differentfloors,and inside a staircase were tested and compared.For the indoor measurements,a total of801of the VNA with the two antennas separated1m apart and located 1.3m above thefloor near the center of the region between the elevator and the lower boundary of Fig.9(a)were used as a reference.By dividing themeasuredYANG et al .:RAY-TRACING METHOD FOR INDOOR WA VE PROPAGATION AND PENETRATION911(a)(b)Fig.6.E-field distributions at 450MHz in the left-side room of Fig.4for lossy structures ("r =20j 1)determined from (a)the ray-tracing method and (b)theMM.Fig.7.An infinite line source radiates into a 2-D stair-shaped structure.can be removed for a linear system.Fig.10plots an example of the open-site reference measurements,which indicate that those dipoles perform best at frequencies around 900MHz and fair around 1800MHz.Because the height of the ceilingfrom(a)(b)Fig.8.E-field distributions at 900MHz over the left side of the stair-shaped structure shown in Fig.7determined from (a)the ray-tracing method and (b)the MM.the floor is 3m and the surrounding walls are at least 3m away,the direct-path field of the reference dominates.For a plane wave incidence,themeasuredof the VNA is proportional to the receiving antenna pattern in the reverse direction of the incident wave multiplied with the component of the incident E-field along the plane of the incident direction and the receiving dipole axis [13].The ray-tracing program can be used to simulate the indoor wave propagation and penetration for determining the GO E-fields in the incident plane and then multiplying with the receiving antenna pattern factor to obtain the ray contributions to the receiving antenna.The phasor sum of all the significant ray contributions is evaluated at each field point.The setup for measuring the reference is also simulated by using the ray-tracing program.Then,by dividing the phasor sum at each field point with that evaluated for the reference,a ray-tracing calculated ratio can be obtained to compare with themeasured912IEEE TRANSACTIONS ON ANTENNAS AND PROPAGA TION,VOL.46,NO.6,JUNE1998Fig.9.A corridor in a building of National Taiwan University of Science and Technology(NTUST)for performingfield measurements.(a)Top view.(b)Side view looking along the x direction.(c)Side view looking along the y direction.fora(6)were used to approximate the current and the radiating E-field in free space.Also,the building structures were modeledwith homogeneous slabs and blocks having effective complexdielectric constants obtained from a free-space method usingtransmission measurements at normal incidence[9].Thus,onlythe major effects of the structures were considered.For the case in a corridor,the transmitting antenna wasfixedat a location,while the receiving antenna was moved alongandirection).As shown inFig.9,some of the walls are composed of the RC and brickstructures,which were indicated in the blueprint of the corridorand also verified by the material property measurements.Thecorrect modeling of the walls is important since the path–lossdifference between the RC and brick walls is significant.Figs.11and12compare the measured and simulated ratios ofthe E-fields alongtheYANG et al .:RAY-TRACING METHOD FOR INDOOR WA VE PROPAGATION AND PENETRATION 913TABLE ICPU T IME AND E RRORS FOR THE C ASE G IVEN IN F IG .12(a)WITH A 5%THRESHOLDTABLE IICPU T IME AND E RRORS FOR THE C ASE G IVENIN F IG .12(b)WITH A 0.5%THRESHOLDshow the convergence of the solutions.In addition,Tables I and II compare the amounts of CPU time on Pentium 166needed to perform the 900-MHz simulations and also list the averages and standard deviations over the differences between the simulations and measurements in decibels for fivedifferent-shapedcorridor,the reflections from the ceiling of the upstairs and the floor of the downstairs are negligible due to the higher round-trip attenuation through the ceiling and floor.Actually,a 2-D approach by considering only the rays propagating in the horizontal and vertical planes on the same floor may be applied to obtain results close to those from the 3-D ray-tracing program much more efficiently[7].Fig.10.An example of the open-site measurements.The dipole antennas are a half-wavelength long at 900MHz.Fig.13plots the geometry of the setup for the dipole antennas on different floors and also the measured and sim-ulatedratios at frequencies of 900and 1800MHz with both the dipoles polarized horizontally alongthe914IEEE TRANSACTIONS ON ANTENNAS AND PROPAGA TION,VOL.46,NO.6,JUNE1998(a)(b)(c)(d)parisons of thefield measurements and ray-tracing simulations along the corridor for both the antennas located at the same height(1.3m)and polarized vertically.(a)Section A,900MHz.(b)Section B,900MHz.(c)Section A,1800MHz.(d)Section B,1800MHz.(a)(b)(c)(d)parisons of thefield measurements and ray-tracing simulations along the corridor for the antennas located at different heights(Tx:1.96m;Rx: 1.3m)and polarized vertically.(a)Section A,900MHz.(b)Section B,900MHz.(c)Section A,1800MHz.(d)Section B,1800MHz.YANG et al .:RAY-TRACING METHOD FOR INDOOR WA VE PROPAGATION AND PENETRATION915(a)(b)(c)parisons of the field measurements and ray-tracing simulations for the antennas located at different floors and polarized horizontally along the y direction.(a)The measurement site.(b)Results at 900MHz.(c)Results at 1800MHz.Table III lists the amounts of CPU time on Pentium 166spent in the ray-tracing simulations for those measurements performed at the NTUST.The 3-D ray-tracing program byusing ray tubeswithare employed in those calculations,where the ray tubes are traced one by one.Considerable improvement of the running efficiency may be achieved by first finding the angular regions of ray tubes that may enter a receiving boundary including all the Rx locations.Some test rays equally covering the wholeradiation sphere from Tx can be traced to determine those angular regions.Then,detailed tracing for all the tubes in only those regions is performed.Fig.16demonstrates a comparison of the measurements and simulations for waves penetrating through an exterior wall with windows.The measured data are taken from [10],where a room of 16moff the normal of the wall surface and the locations of the916IEEE TRANSACTIONS ON ANTENNAS AND PROPAGA TION,VOL.46,NO.6,JUNE1998Fig.14.A staircase in a building of the NTUST for performingfield measurements.Rx were only1m behind the inner surface of the exterior wall.A vertically polarized Yagi array of23elements and a standard dipole antenna were used as the Tx and Rx in those measurements.The geometry of the room modeled in our ray-tracing simulations is plotted in Fig.16(a),together with the material properties assumed and a vertically polarized half-wave dipole at1290MHz is transmitting instead of the Yagi array for simulating this far-zone illumination.The E-field strength in dBmV/m for the half-wave dipole with20-dB ampere maximum current is plotted in Fig.16(b)compared with the results presented in[10](the dimension of thefield strength of the measured data is not clear and the antennaYANG et al .:RAY-TRACING METHOD FOR INDOOR WA VE PROPAGATION AND PENETRATION917(a)(b)(c)(d)parisons of the field measurements and ray-tracing simulations for the staircase of Fig.14.The antennas are polarized vertically.(a)Section A,900MHz.(b)Section A,1800MHz.(c)Section B,900MHz.(d)Section B,1800MHz.TABLE IIIC OMPARISONS OF CPU T IME R EQUIRED TO R UN THE R AY -T RACING S IMULATIONSWITH 1 =1 FOR THE C ASES T ESTED IN THE B UILDING OFNTUSTfactors are unknown).The effects of the window frames are not included in the simulations.From this comparison,some observations are given below.1)Since the path of the Rx locations is nearly normal to the incident rays and parallel to the exterior and interior walls,the GO contributions should vary smooth along the path,as is indicated in the ray-tracing results.2)The ripples with about a one wavelength separation occur in the measurements and the trend of the field strength is slowly varied too.Those phenomena may be due to the scattering effects of the array of the long metal window frames parallel to the vertically polarized incident fields.Also,the array of the frames are close to the Rx and parallel to the receiving path.Thus,thescattered fields from those frames can be strong and result in fast fading and field variations.3)The concrete posts of the exterior walls attenuate the fields significantly as shown both in the measured and simulated data.V.C ONCLUSIONSA ray-tracing program has been developed for modeling indoor wave propagation and penetration.Multiple reflec-tions and transmissions of ray tubes inside and among walls,ceilings/floors,and other building structures are traced to determine the GO contributions.Each ray tube is composed of four rays definingby918IEEE TRANSACTIONS ON ANTENNAS AND PROPAGA TION,VOL.46,NO.6,JUNE1998(a)(b)Fig.16.Penetrations of waves at 1290MHz through an exterior wall with metal-framed windows for a case reported in [10].(a)Geometry and material properties used in our ray-tracing simulations.(b)Comparisons of the ray-tracing simulations and the field measurements given in [10].transmitting and receiving antennas separated by 1m were employed as the reference of the field measurements.Then,the ray-tracing program has been applied to evaluate the fields at 900and 1800MHz in the buildings for comparisons with the measurements.The complex dielectric constants of the RC walls,brick walls,and floors determined from a free-space method were employed in the simulations.The simulated solutions mostly follow the trend of the measured results.Furthermore,measured data at a frequency of 1290MHz from [10]for waves penetrating an exterior wall with severalYANG et al.:RAY-TRACING METHOD FOR INDOOR WA VE PROPAGATION AND PENETRATION919metal-framed windows are employed to examine the ray-tracing solutions at receiving locations close to the windows. Scattering from the metal frames seems important for this case. This ray-tube tracing method may be applied to model the wave propagation in and penetration through arbitrary shapes of electrically large building structures that do not excite significant diffractedfields to the receiving locations.Results obtained from this ray-tracing program can be employed to study the channel characteristics of the indoor wireless communications.A CKNOWLEDGMENTThe authors would like to thank S.-S.Chuang and W.-K. Liang for performing thefield measurements.R EFERENCES[1]W.Honcharenko,H.L.Dailing,and J.Dailing,“Mechanisms gov-erning propagation between differentfloors in buildings,”IEEE Trans.Antennas Propagat.,vol.41,pp.787–790,June1993.[2]H.L.Bertoni,W.Honcharenko,L.R.Maciel,and H.H.Xia,“UHFpropagation prediction for wireless personal communications,”Proc.IEEE,vol.82,pp.1333–1359,Sept.1994.[3]S.Y.Seidel and T.S.Rappaport,“Site-specific propagation predictionfor wireless in-building personal communication system design,”IEEE Trans.Veh.Technol.,vol.43,pp.879–891,Nov.1994.[4]U.Dersch and E.Zollinger,“Propagation mechanisms in microcelland indoor environments,”IEEE Trans.Veh.Technol.,vol.43,pp.1058–1066,Nov.1994.[5]S.-H.Chen and S.-K.Jeng,“An SBR/image approach for indoor radiopropagation in a corridor,”IEICE Trans.Electron.,vol.E78C,no.8, pp.1058–1062,Aug.1995.[6]P.T.Davis and C.R.Mcguffin,Wireless Local Area Networks:Tech-nology,Issues,and Strategies.New York:McGraw-Hill,1995. [7]K.Pahlavan and A.H.Levesque,Wireless Information Networks.NewYork:Wiley,1995.[8] C.-F.Yang and T.-S.Wang,“A moment method solution for TMz andTEz waves illuminating two-dimensional objects above a lossy half space,”IEEE pat.,vol.38,pp.433–440,Aug.1996.[9] C.-F.Yang, C.-J.Ko,and B.-C.Wu,“A free space approach forextracting the equivalent dielectric constants of the walls in buildings,”in IEEE AP-S Int.Symp.URSI Radio Sci.Meet.,Baltimore,MD,July 1996,pp.1036–1039.[10]J.Horikoshi,K.Tanaka,and T.Morinaga,“1.2GHz band wavepropagation measurements in concrete building for indoor radio commu-nications,”IEEE Trans.Veh.Technol.,vol.VT-35,pp.146–151,Nov.1986.[11]H.Kim and H.Ling,“Electromagnetic scattering from an inhomoge-neous object by ray tracing,”IEEE Trans.Antennas Propagat.,vol.40, pp.517–525,May1992.[12] C.A.Balanis,Advanced Engineering Electromagnetics.New York:Wiley,1989.[13]W.L.Stutzman and G.A.Thiele,Antenna Theory and Design.NewYork:Wiley,1981.Chang-Fa Yang(S’86–M’92)was born in Taipei,Taiwan,R.O.C.,on October14,1960.He receivedthe B.S.degree from the National Taiwan Uni-versity,Taipei,in1983,and the M.S.and Ph.D.degrees from The Ohio State University,Columbus,in1988and1992,respectively,all in electricalengineering.From1986to1992,he was a Graduate Re-search Aassociate with the ElectroScience Labora-tory,Columbus,OH.In February1992he joinedthe faculty of the National Taiwan University of Science and Technology,where he is now an Associate Professor.His research interests include numerical methods,wireless communications,and electromagnetic interferences at power and microwavefrequencies.Boau-Cheng Wu was born in Kaohsiung,Taiwan,R.O.C.,on June5,1971.He received the B.S.and M.S.degrees in electrical engineering fromthe National Taiwan University of Science andTechnology,Taipei,in1995and1998,respectively.His research interests include wireless communi-cations and automaticcontrols.Chuen-Jyi Ko was born in Changhua,Taiwan,R.O.C.,on November18,1964.He received theB.S.and M.S.degrees in electrical engineeringfrom the National Taiwan University of Science andTechnology,Taipei,in1990and1996,respectively.He is currently with the Chunghwa Telecommu-nication Company,Taipei.His research interests arein wireless communications.。
2013年全国研究生数学建模竞赛A题

2013年(第十届)全国研究生数学建模竞赛A题变循环发动机部件法建模及优化由飞机/发动机设计原理可知,对于持续高马赫数飞行任务,需要高单位推力的涡喷循环,反之,如果任务强调低马赫数和长航程,就需要低耗油率的涡扇循环。
双涵道变循环发动机可以同时具备高速时的大推力与低速时的低油耗。
变循环发动机的内在性能优势,受到了各航空强国的重视,是目前航空发动机的重要研究方向。
1 变循环发动机的构`造及基本原理1.1 基本构造双涵道变循环发动机的基本构造见图1、图2,其主要部件有:进气道、风扇、副外涵道、CDFS涵道、核心驱动风扇级(CDFS)、主外涵道、前混合器、高压压气机、主燃烧室、高压涡轮、低压涡轮、后混合器、加力燃烧室、尾喷管。
双涵道模式下,选择活门和后混合器(后VABI)全部打开;单涵道模式下,选择活前混合器主外涵道主燃烧室加力燃烧室图2 双涵道变循环发动机结构示意图图中数字序号表示发动机各截面参数的下脚标各部件之间的联系如图3所示,变循环发动机为双转子发动机,风扇与低压涡轮相连,CDFS、高压压气机与高压涡轮相连,如图3下方褐色的线所示。
蓝色的线表示有部件之间的气体流动连接(图3中高压压气机后不经主燃烧室的分流气流为冷却气流,在本题中忽略不计)。
图3 变循环发动机工作原理图1.2工作原理变循环发动机有两种工作模式,分别为涡喷模式和涡扇模式。
发动机在亚音速巡航的低功率工作状态,风扇后的模式转换活门因为副外涵与风扇后的压差打开,使更多空气进入副外涵,同时前混合器面积开大,打开后混合器,增大涵道比,降低油耗,此时为发动机的涡扇模式。
发动机在超音速巡航、加速、爬升状态时,前混合器面积关小,副外涵压力增大,选择活门关闭,迫使绝大部分气体进入核心机,产生高的推力,此时为发动机的涡喷模式。
2 变循环发动机部件建模法燃气涡轮发动机的特性可以用实验方法和计算方法获得。
但实验的方法需要研制复杂的设备、投入巨额的资金和消耗巨大的能源,因此实验的方法不可能经常采用。
2013年数学建模全国三等奖获奖作品

为简单起见,我们记
S xy ( xi x)( yi y) , S xx ( xi x)2 X i2 , S yy ( yi y )2
n n n n i 1 i 1 i 1 i 1
则有,
r
S xy S xx S yy
(3-2)
而对此相关系数的统计检验使用 t 统计量:
PM 2.5 减排计划,同时使经费投入较为合理,写出五年投入总经费和逐年经
费投入预算计划,并论述其合理性.已知:每减少一个 PM 2.5 浓度单位 ,当 年需投入一个费用单位 (百万元) , 专项治理投入费用是当年所减少 PM 2.5 浓 度平方的.倍(百万元) .
4
第二章
模型假设与符号说明
1.模型假设: ① 平均流场稳定,风速均匀,风向平直; ② 污染物的浓度在 y、z 轴方向符合正态分布; ③ 污染物在输送扩散中质量守恒; ④ 染源的源强均匀、连续。 2.基本模型及符号说明: 带修正气象参数 的高斯扩散模型:
C ( x, y , u )
1 m2 C exp 2 2 u y z 2 y 1 m2 C exp 2 , 2 u y z 2 y
其中, x ——纬度;
达式,发现模型的拟合度良好,最后进一步分析讨论了该模型的局限性. 对于问题三,在问题一的基础上,我们对相关系数矩阵进行求值,计算得到 他们的行列式的值不为零,即 PM 2.5 可以唯一由其他五项指标线性表出.故而
PM 2.5 的浓度降低指数由其他五项指标唯一表示,通过建立矩阵的求出各项指标
对应降低权重矩阵 R ,并利用公式 X R ,计算出五年内每一年分项治理的相 关指标.最后,通过统计计算出综合治理和分项治理的所需费用,进行比较说明 哪种方案更合理以及合理性的阐述.
全国研究生数学建模竞赛历届竞赛题目

全国研究生数学建模竞赛历届竞赛题目第一届2004 年题目(共4 个题目)2004 年A 题发现黄球并定位2004 年B 题实用下料问题2004 年C 题售后服务数据的运用2004 年D 题研究生录取问题第二届2005 年题目(共4 个题目)2005 年A 题Highway Traveling time Estimate and Optimal Routing2005 年B 题空中加油2005 年C 题城市交通管理中的出租车规划2005 年D 题仓库容量有限条件下的随机存贮管理第三届2006 年题目(共4 个题目)2006 年A 题Ad Hoc 网络中的区域划分和资源分配问题2006 年B 题确定高精度参数问题2006 年C 题维修线性流量阀时的内筒设计问题2006 年D 题学生面试问题第四届2007 年题目(共4 个题目)2007 年A 题建立食品卫生安全保障体系数学模型及改进模型的若干理论问题2007 年B 题械臂运动路径设计问题2007 年C 题探讨提高高速公路路面质量的改进方案2007 年D 题邮政运输网络中的邮路规划和邮车调运第五届2008 年题目(共4 个题目)2008 年A 题汶川地震中唐家山堪塞湖泄洪问题2008 年B 题城市道路交通信号实时控制问题2008 年C 题货运列车的编组调度问题2008 年D 题中央空调系统节能设计问题第六届2009 年题目(共4 个题目)2009 年A 题我国就业人数或城镇登记失业率的数学建模2009 年B 题枪弹头痕迹自动比对方法的研究2009 年C 题多传感器数据融合与航迹预测2009 年D 题110 警车配置及巡逻方案第七届2010 年题目(共4 个题目)2010 年A 题确定肿瘤的重要基因信息2010 年B 题与封堵渍口有关的重物落水后运动过程的数学建模2010 年C 题神经元的形态分类和识别2010 年D 题特殊工件磨削加工的数学建模第八届2011 年题目(共4 个题目)2011 年A 题基于光的波粒二象性一种猜想的数学仿真2011 年B 题吸波材料与微波暗室问题的数学建模2011 年C 题小麦发育后期茎轩抗倒性的数学模型2011 年D 题房地产行业的数学建模第九届2012 年题目(共4 个题目)2012年A 题基因识别问题及其算法实现2012年B 题基于卫星无源探测的空间飞行器主动段轨道估计与误差分析2012年C 题有杆抽油系统的数学建模及诊断2012年D 题基于卫星云图的风矢场(云导风)度量模型与算法探讨第十届2013 年题目(共6 个题目)2013年A题变循环发动机部件法建模及优化2013年B题功率放大器非线性特性及预失真建模2013年C题微蜂窝环境中无线接收信号的特性分析2013年D题空气中PM2.5问题的研究attachment2013年E题中等收入定位与人口度量模型研究2013年F题可持续的中国城乡居民养老保险体系的数学模型研究第十一届2014 年题目(共 5 个题目)2014年A题小鼠视觉感受区电位信号(LFP)与视觉刺激之间的关系研究2014年B题机动目标的跟踪与反跟踪2014年C题无线通信中的快时变信道建模2014年D题人体营养健康角度的中国果蔬发展战略研究2014年E题乘用车物流运输计划问题第十二届2015 年题目(共 6 个题目)2015年A题水面舰艇编队防空和信息化战争评估模型2015年B题数据的多流形结构分析2015年C题移动通信中的无线信道“指纹”特征建模2015年D题面向节能的单/多列车优化决策问题2015年E题数控加工刀具运动的优化控制2015年F题旅游路线规划问题数据来源:/6/list.htm。
- 1、下载文档前请自行甄别文档内容的完整性,平台不提供额外的编辑、内容补充、找答案等附加服务。
- 2、"仅部分预览"的文档,不可在线预览部分如存在完整性等问题,可反馈申请退款(可完整预览的文档不适用该条件!)。
- 3、如文档侵犯您的权益,请联系客服反馈,我们会尽快为您处理(人工客服工作时间:9:00-18:30)。
可持续的中国城乡居民养老保险体系的数学模型研究
一、问题的提出
中国共产党第十八次全国代表大会政治报告中提出了“统筹推进城乡社会保障体系建设”的任务:“社会保障是保障人民生活、调节社会分配的一项基本制度。
要坚持全覆盖、保基本、多层次、可持续方针,以增强公平性、适应流动性、保证可持续性为重点,全面建成覆盖城乡居民的社会保障体系”。
近年来,我国城镇职工养老保险金制度基本建立,参保覆盖面日益扩大,退休人员待遇逐年提高,养老保险基金规模不断上升,在制度层面上提前完成了城市和农村居民社会保障全覆盖,成为我们社会保障事业发展的重要里程碑。
然而也面临巨大的挑战。
我国的养老保险体系建设远远滞后于社会发展水平。
一方面资金规模相对较少,保障能力有限,地区差距、城乡差距明显;另一方面资金管理分散,运营效率不高,保值增值的压力很大。
进一步完善养老保险保障体系仍将是中国政府未来最重要的任务之一。
全国人大常委会法工委信春鹰副主任是《社会保险法》的制定者,她指出中国养老制度“最大的问题就是‘可持续’”,“我们看当下的欧洲,我们看现在出现财政危机的那些国家,他们的养老保险无一不遇到了极大的挑战和问题。
和其他国家相比,中国有特殊的问题,像前面几位专家讲的,我们比人家穷,比人家人口多,‘未富先老’。
从制度上来说,我们的制度本身就有很多的缺陷,本身就很青涩,它是对现实妥协的一个产物。
但是同时,这个制度一经产生就遇到了人口结构快速变化,社会尚未准备好,这些大的问题都出现了,对我们这个制度是非常大的挑战。
”
由于中国养老保险缴纳与支付同时开始,中国保监会副主席陈文辉在陆家嘴论坛上承认“中国养老金缺口确实非常大”。
社会科学院世界社保研究中心主任郑秉文给出的数字是2011年城镇基本养老保险个人账户“空账”已经超过2.2万亿,较2010年增加约5000亿。
世界银行的研究机构在研究我国的养老金问题研究报告中,认为到2013年,中国养老基金缺口达到18.3万亿元。
在当前养老制度不变情况下,以后的年份缺口逐年放大。
假设2013年后中国GDP的年增长率为6%,到2033年时养老金缺口将为惊人的68.2万亿元,占当年GDP的38.7%(见附件3、4,由于这是根据国家资产负债表估算,显然比较粗糙)。
另据中国社科院财贸所学者高培勇和汪德华最近的一项研究指出,在现有社保制度框架下,要确保2020年中国每个退休者都能领取养老金,以替代率52.4%计算,养老金支付缺口都会持续增加。
最早在2015年,中国城镇职工养老保险就会出现支付缺口。
两位学者预计,如果现在不能未雨绸缪,及时调整政策,到2050年,养老金缺口累积将达到该年GDP的95%。
这样巨大的资金缺口,必将使国家财政不堪重负。
而现有官方公布的数据却有明显差别。
2012年6月4日,中国人力资源与社会保障部向社会公布了2011年度人力资源和社会保障事业发展统计公报。
此公报是透视中国人力资源与社会保障工作成绩的重要窗口,也是解析社会保险最权威的数据来源。
统计公报显示,截至2011年末,全国基本养老保险基金累计结余1.9497万亿元,全年城镇基本养老保险基金总收入1.6895万亿元,比上年增长25.9%,全年基金总支出1.2765万亿元,比上年增长20.9%。
和2009年、2010年相比,城镇职工基本养老保险基金当期结余资金规模进一步扩大,已由2010年当期结余的2865亿元增加到4130亿元,增幅较大,这有利于缓解部分
省市养老金支付压力。
但有分析认为:基金征缴收入增长较快是其中一个重要原因。
上述观点分别反映中国养老金现状的不同侧面和未来趋势的不确定性。
二、现实的情况
中国在20世纪90年代确立了城镇职工基本养老保险“统账结合”制度,基本养老保险是由社会统筹和个人账户两部分组成。
社会统筹部分由单位负担缴费,为单位职工工资总额的20%,个人账户则由职工个人缴费,为个人工资的8%。
前者“现收现付”,用于支付已退休人员的养老金,后者实行长期封闭积累,产权个人所有的“完全积累”制,原则上不能调剂借用的方式。
由于在现行养老保险制度确立之前,企业员工基本无需缴纳养老保险费用,所以现有的养老保险基金中没有这部分职工的个人账户部分。
在养老保险制度设立之后,这部分职工退休后却要从养老保险基金中领取养老金,这是我国社会保险制度必须承担的转轨成本的一部分。
仅靠统筹账户不足以应对当期发放,加之各地财政实力不同,多数地区不得不在实际上采用了“现收现付制”的方法,即挪用个人账户的资金,用正在工作人合计缴纳的28%的月工资来支付现有退休人员的退休金,现在工作人账户仅仅用来记账,上述2.5万亿的记账额由此形成。
为解决这一问题,中国从2000年开始了“做实”个人账户试点。
截至到2011年底,参与试点的辽宁、江苏和山东等13个省份共积累个人账户基金达到2703亿元,但其与记账额之间的差额,仍达到2.23万亿元,此“空账”被舆论定义成了养老保险“缺口”概念而广为传播。
三、需要解决的问题
面临人口老龄化以及经济结构性减速、财政收入增长速度下降,社会保障体系可持续问题亟待解决,必须进行前瞻性研究,否则将形成社会问题。
我们应该承认历史、立足现实、尊重规律、借鉴国外、留有余地,既量力而行,又尽力而为地完善我国的养老保险体系。
本题要求运用数学模型方法研究、解决该问题。
为此,请你们团队做好以下几项工作。
(请研究生注意:可以引用有关参考文献的结论和数学模型,更鼓励创新,独立提出新模型。
若引用他人的模型与结论,必须注明出处,否则视情节轻重,直至作为抄袭处理)
1,分别建立合乎国情、适应国力的中国城乡居民(含新农保)养老金收入、支出的宏观数学模型,至少包括替代率(基本养老保险人均养老金占城镇单位在岗职工平均工资比率)、缴费率(基本养老保险人均缴费占城镇单位在岗职工平均工资比率)、人口结构、分年龄段死亡率、经济增速、财政补贴、工资水平或物价指数、投资效益等主要因素,要做到模型结合现实,分多个层次(含企业基金等),体现“多缴多得,长缴多得”(不考虑分省、分地区模型)。
如果使用国家统计局公布和题目提供数据以外的数据,必须指明出处并向竞赛网站申请张贴于“资料下载”处,首先公布者可适当加分。
2,根据你们的数学模型、对养老金缺口的理解和对未来有关情况的合理估计,估计从今年至2035年我国养老金缺口,并说明你们对养老金缺口分析的合理性。
如果全部情况维持不变,按照你们的数学模型我国城乡居民养老保险收支矛盾最尖锐的情况发生在什么时间,严重程度如何?考虑到党的十八大提出的收入倍增计划,你们的数学模型哪些部分需要调整?
3,养老保险制度也是调节社会分配,请你们分析各国养老保险的不同模式,
取其精华,去其糟粕,根据你们建立的数学模型和中国的实际情况,利用仿真手段寻找替代率和缴费率的合理区间以保证我国养老保险体系的可持续性(因为人口结构、分年龄段死亡率、经济增速、投资效益等主要因素几乎无法人为较大幅度改动);在步入良性循环之前,在矛盾最尖锐到来前的过渡期内应该采取哪些政策措施实现平稳过渡并仿真预测相关政策的效果。
四.尝试建立第三问增加可调节变量的数学模型。
参考文献
1.《中国养老金发展报告2012》中国社会科学院世界社保研究中心(其中部分全国性数据扫描在附件中,并提供word等版本省去输入)
2.中国新闻网《中国养老金发展报告2012》在京发布式
3. 马骏等《化解国家资产负债中长期风险》
4. 曹远征《意见中国――网易经济学家访谈录》。