Waterfall Chart in Excel2003

MS Excel Tutorial
Creating Waterfall Charts in Excel: a tutorial with sample files
This tutorial shows how to make a waterfall chart. I will use a table with one column to show the idea, but it's not too hard to do it for two or more variables. At the bottom of the page you can find two sample excel sheets.
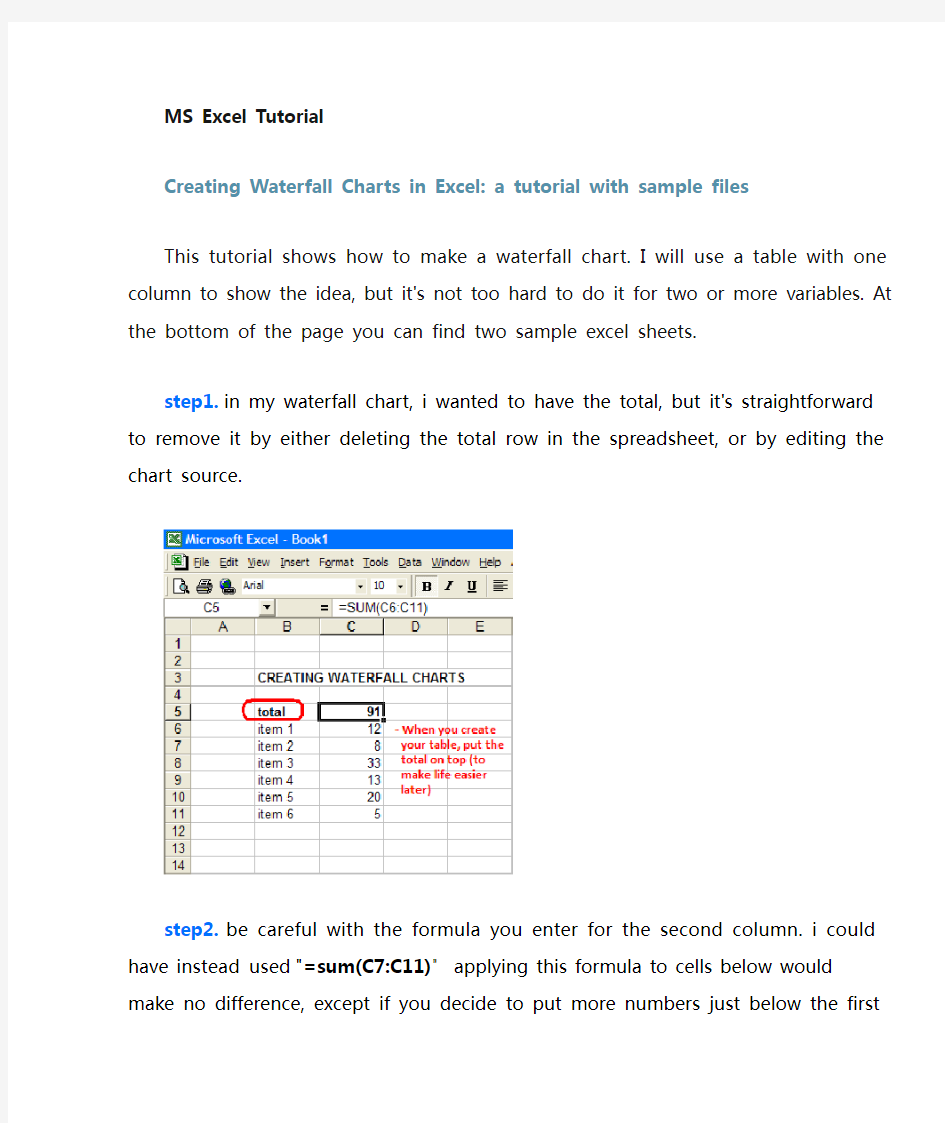
step1. in my waterfall chart, i wanted to have the total, but it's straightforward to remove it by either deleting the total row in the spreadsheet, or by editing the chart source.
step2. be careful with the formula you enter for the second column. i could have instead
used "=sum(C7:C11)" applying this formula to cells below would make no difference, except if you decide to put more numbers just below the first column, then you'd be in trouble...
moving on...
step 3. if you click on the preview button, you'll see that it doesn't look that good, but don't worry, we'll get there...
step 4. yes, now we have the skeleton.
step 5. in this step, i think ahead and try to pick the bars i'll make invisible. this will save me from right-clicking and choosing "format data series" again.
small note: be careful to pick the group of bars, not just one bar, or the whole chart
step 6. i wish 'print screen' showed the mouse pointer som etimes, but you get the idea...
step 7. some people don't like gridlines under the waterfall chart, if you're one of them, pick white for the border and fill colors instead of picking "none" (and i'm sorry for stating the obvious :P)
step 8. just another modification i like, you don't have to... in fact, if you're dealing with more than one variable, you might want to play around with the overlap and gap width a little
bit
ok, here it is.. hope this helps. feel free to use this excel sheet as a guide.
with a couple of easy changes, here's what my waterfall looks like
you can click on images to download excel files