ABSTRACT INFOSTUDIO TEACHING AMBIENT DISPLAY DESIGN USING HOME AUTOMATION

INFOSTUDIO: TEACHING AMBIENT DISPLAY
DESIGN USING HOME AUTOMATION
Andrew Vande Moere
Key Centre of Design Computing & Cognition, University of Sydney
andrew@https://www.360docs.net/doc/167799788.html,.au
ABSTRACT
The infostudio course unit introduced 3rd year undergraduate students to the design of ambient display as physical, human-scale installations that convey data-driven spatial experiences. Students developed ambient display installations in a common printer hub room that subtly reflected the electronic network traffic, human activities and environmental data within the adjacent computer labs in real time. The resulting prototypes explored how the combination of common networked home automation hardware controlling simple electrical devices and multiple multimedia projections can be used to convey real-time information through different human senses. KEYWORDS: ambient display, design education, multimodal visualization, multimedia installation
1.INTRODUCTION
Many contemporary office and domestic spaces are equipped with home automation features that react to environmental measurements in real time, such as temperature, humidity or light levels. Often, these spaces have been designed from a purely engineering context, using simple sensor-driven action rules. In contrast, this paper is based on the assumption that home automation hardware is capable of conveying information by controlling the architectural experience. A new undergraduate studio-led course called
‘infostudio’ demonstrates how undergraduate students, schooled in both computer science principles and creative design, acted as ‘information space architects’ designing data-driven spatial experiences. Student groups prototyped interactive installations that reflected space-related data in real time through multiple human senses (e.g. visual, smell, touch). Networked home automation hardware continuously controlled several 240V AC electrical devices according to real-time data streams. In addition, multiple projections were designed as architectural features that aesthetically represented the data within the space.
2.BACKGROUND
Following the movement of morphing architectural spaces and surfaces into interactive ‘interfaces’ (Ishii and Ullmer, 1997), ambient display research considers the entire physical environment that is surrounding the users as a data-driven output medium. Ambient display moves information from the computer screen to a spatial context, so that information is manifested through “subtle changes in form, movement, sound, color, smell, temperature, or light” (Wisneski, Ishii, Dahley et al., 1998). As several researchers explore the potential of stimulating alternative (non-visual) human channels for human-computer interaction, novel ‘visualization’ approaches emerge that convey information in a ‘multimodal’ way, including tactile, edible and olfactory human senses. Designing new ways of presenting information is a manifestation of
‘information aesthetics’, a potential research field which attempts to analyze new media objects that
‘aestheticize’ information processing (Manovich, 2001). Several ambient visualizations already exist, of which the most influential include: Ambient Devices Inc.’s ambient orb, a sculptural object depicting the weather through glowing color patterns; Pinwheels, displaying network traffic by wind flows (Dahley, Wisneski and Ishii, 1998); and Activity Wallpaper, depicting events in a café setting via a slowly changing
wallpaper (Skog, 2004). Notably, most ambient displays are either screen-based or rely on physical artifacts with specialized electronics. Accordingly, novel approaches that convey information mainly through spatial or architectural experiences are still relatively unexplored.
3.COURSE CONCEPT
3.1.Design & Evaluation
The infostudio course was organized for 31 3rd year undergraduate students, with expertise in design, visualization and multimedia programming. Students prototyped and implemented physical installations in a common printer hub room at the Wilkinson building of the University of Sydney. This particular space contains several commonly used printing devices and acts as an anonymous corridor connecting three different computer labs with the main entrance hall. As it lacks any clear functionality or identity, this room is largely neglected by its visitors. From a user experience context, the infostudio course considered this space as the ideal physical framework for designing an intriguing multimedia installation. The installation had to respect the room’s complexity, with its irregular shape, many glass surfaces, large amount of doors and frequently used pathways. Each visualization installation contained two independent but complementing parts, which had to be based on equal conceptual premises:
- One or more projections, which displayed images as independent architectural features. Students had to reconsider some traditional notions of screen-based media, which lose their meaningfulness when projected in human-size and in close proximity of users. For instance, typical visualizations that are useful through deciphering screen orientations (e.g. charts that assume the bottom-left corner as the Euclidian origin) are ineffective when presented in a fully spatial context in which architectural considerations are more dominant. Instead, projections can be considered as special light sources, skewed and pointed in any spatial direction, that direct human attention.
- An electrical installation, containing various devices that are controlled through networked home automation hardware. By considering the choice, placement, configuration and steering of electrical devices as multimodal visualization output channels that are able to simulate alternative human senses, students had to reconsider their screen-based design expertise and reinvent data mapping metaphors.
In addition, student groups conducted a user evaluation of their installation in relation to its conveyed user experience and its effectiveness in conveying information to users, based on the heuristic evaluation of ambient display (Mankoff, Dey, Hsieh et al., 2003). Students researched a wide range of phenomena, including the intuitively perceived time-direction of heavily skewed wall projections, the emotional responses to motion typologies of dynamic particles and the effective perception of differences in light bulb animation speeds. Naturally, students had to reflect upon their findings and adapt their design accordingly, so the performance of the chosen data mapping metaphors would be increased.
3.2.Dataset
All installations reflected the real-time network activity of all computers in the surrounding laboratories. All datasets were generated by Multi Router Traffic Grapher (MRTG), a software tool which monitors anonymous traffic load on the network link level without significant impact on network performance. MRTG records the incoming and outgoing bytes for each computer connected to a router in 5 minute intervals, while automatically aggregating historical data in hourly, daily, monthly and yearly formats. Several student groups merged these MRTG logs with alternative datasets, either derived externally, such as room usage timetables, weather predictions and bus timetables, or acquired directly via connected home automation sensor devices, measuring temperature, motion activity, foot pressure, and noise levels.
3.3.Hardware & Software
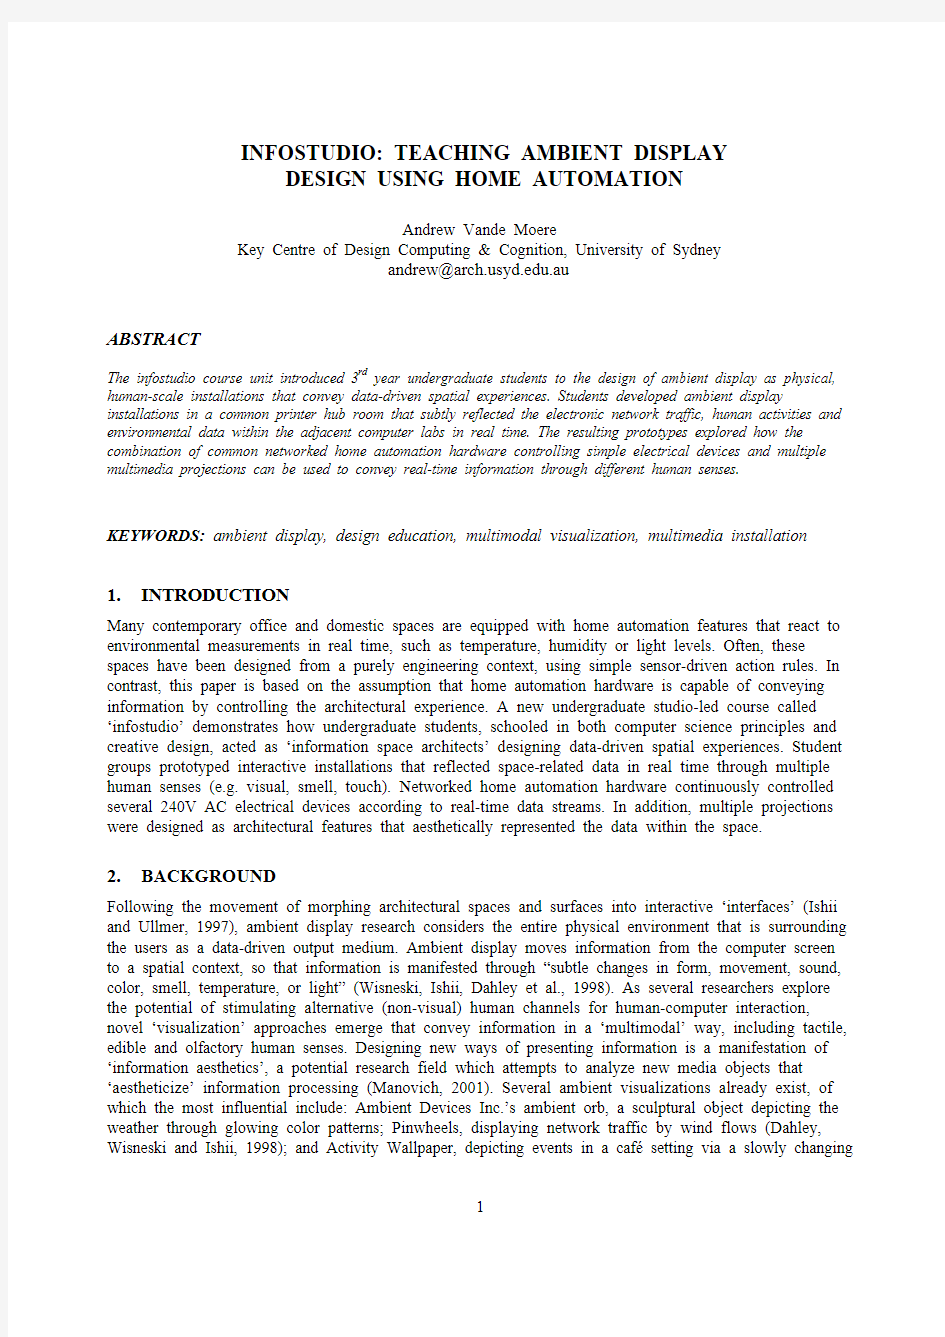
As shown in Figure 1, students had to design the projections as well as determine the control of the electrical devices. Macromedia Director was selected as the installation’s application software, as it is capable of a) parsing external text data files (from MRTG log files) to determine the installation’s actions, while b) generating the dynamic visualizations for the projections, and c) maintaining a network connection to control the electrical devices.
Figure 1. Input and output devices and communication structure of the infostudio installations.
All electrical devices were networked to standard home automation modules, which are normally intended to control so-called preprogrammed ‘light scenes’ via simple switch buttons in domestic or office environments. By using home automation hardware and software tools, the complex electronics, system configuration and networking issues could be hidden from the students while still using advanced electrical features. Although such systems typically rely on relative slow (but robust) networking speeds, this limitation played no role in the installations, which depend on ambient alterations. A desktop computer regularly checked for updates in the external datasets or environmental sensor measurements, which in turn determined the projections and electrical currents. The electrical devices were connected to the home automation devices, mounted in custom-made boxes fitted with standard electrical outlets instead of loose cabling for obvious security reasons. The home automation devices consisted of:
- Dimmer and Relay Modules, capable of dimming or switching 250V AC or 10V DC channels, steering any electrical device, including light bulbs, wind fans, odor emitters, water foggers, etc.,
- Auxiliary Input Devices which permit voltage free switches (e.g. pressure mats) to be sensed,
- Temperature and Motion Sensors, normally used to regulate lighting, heating or cooling devices, and capable of detecting temperature, motion activity, presence, distance and ambient light level changes,
- an Ethernet Network Interface allowing the electrical installation to be controlled via a TCP/IP connection. All electrical devices are controlled in real time by sending simple text messages via a Telnet connection by the main desktop computer, which also generated and synchronized all projections.
4.RESULTS
Figure 2. Projection Installations (left to right): circular visualization on ceiling with lit disco ball, particle animation and explosions above plotter, skewed glitch-like projection, fractal-like wallpaper with light bulbs. Most student works combined known approaches of ambient display in a single design concept or augmented them further with original insights. For example, the ‘Hubspace’ installation was inspired by the concept of eastern mysticism to generate a dynamic Persian-style rug wallpaper and subtle light effects that together conveyed multiple data values as a single spatial experience. Light bulb constellations hung above the printer devices depicted their usage and printing waiting time by variable animation speeds, while the slowly altering patterns of the fractal-like wallpaper depicted environmental issues, such as temperature measurements, noise levels, room occupancy and network usage. Other groups combined several electrical devices as multimodal output devices, such as pedestal fans, odour emitters, water
foggers, lit disco balls and boomed loudspeakers vibrations. Most projections augmented the spatial
atmospheres by visualizing metaphorical allusions to strong experiential environments, such as underwater worlds, artificially ‘alive’ creatures, glitch art and so on. Carefully designed, they showed alterations of data attributes slowly, as to not to disturb the attention of visitors, while still keeping a visual history for those users that might have missed those changes. More information is available on the course website.
Figure 3. Electrical Installations (left to right): light bulb constellation above printer, pedestal fans with home
automation modules, spotlight array near wall, air freshener at door, lit loudspeaker with spheres.
5. DISCUSSION & FUTURE WORK
The infostudio concept focused on the development of information displays in a spatial context, provoking screen-based multimedia design specialists to integrate physical output devices within an architectural setting. Real-world network traffic logs and environmental measurements were used to let students experience the issues of visualizing time-varying datasets. As mentioned before, user evaluation studies further advanced the designs in the direction of effectiveness and user experience. This course showed the potential of common home automation hardware to control electrical devices for information display purposes, which are simple, robust and secure enough to be programmed by undergraduate students.
6. REFERENCES
Dahley, A., Wisneski, C. and Ishii, H. (1998). "Water lamp and pinwheels: ambient projection of digital information into architectural space", in Conference on Human Factors and Computing Systems (CHI'98), ACM, pp. 269-270.
Ishii, H. and Ullmer, B. (1997). "Tangible Bits: Towards Seamless Interfaces between People", in Conference on Human Factors in Computing Systems (CHI'97), ACM, Atlanta, USA, pp. 234-241. Mankoff, J., Dey, A., Hsieh, G., Kientz, J., Lederer, S. and Ames, M. (2003). "Heuristic Evaluation of Ambient Displays", in Conference on Human Factors and Computing Systems , ACM, pp. 169-176. Manovich, L. (2001). Information and Form, https://www.360docs.net/doc/167799788.html,/ia/, accessed July 2005. Skog, T. (2004). "Activity Wallpaper: Ambient Visualization of Activity Information (Poster)", in Designing Interactive Systems (DIS 2004), ACM, Cambridge, USA.
Wisneski, C., Ishii, H., Dahley, A., Gorbet, M., Brave, S., Ullmer, B. and Yarin, P. (1998). "Ambient
displays: Turning architectural space into an interface between people and digital information", in First International Workshop on Cooperative Buildings (CoBuild '98), Springer-Verlag, pp. 22-32.
7. ACKNOWLEDGEMENTS
We thank all infostudio students and tutors for their work and continuous enthusiasm, and Clipsal Australia for their support. More information at https://www.360docs.net/doc/167799788.html,.au/~andrew/infostudio