TEM-015 Cleaning Validation – Swab Test


Project number:
Protocol Number:
Product/Active:
Process Line:
SWABBING RECOVERY STUDIES
1. Test Description
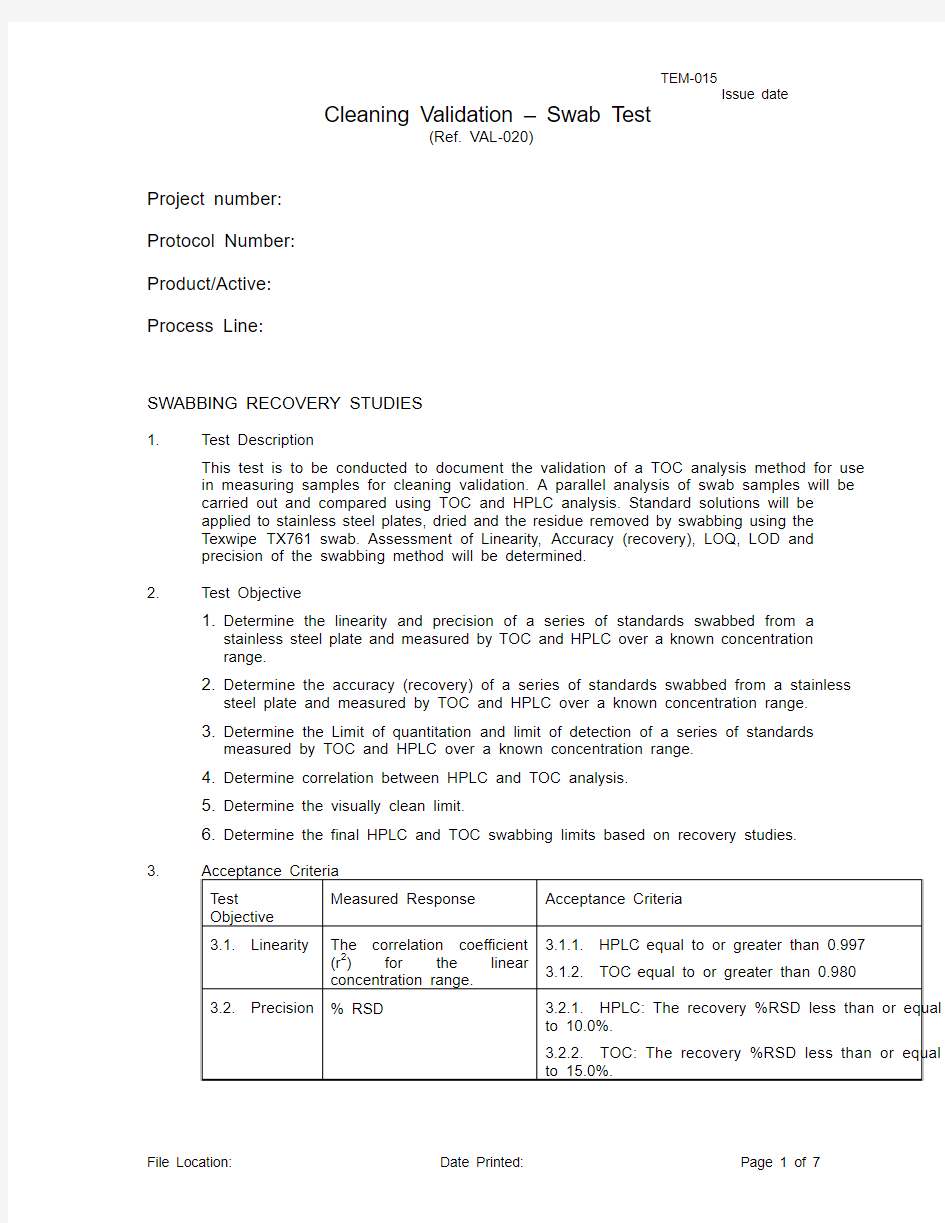
This test is to be conducted to document the validation of a TOC analysis method for use in measuring samples for cleaning validation. A parallel analysis of swab samples will be carried out and compared using TOC and HPLC analysis. Standard solutions will be applied to stainless steel plates, dried and the residue removed by swabbing using the Texwipe TX761 swab. Assessment of Linearity, Accuracy (recovery), LOQ, LOD and precision of the swabbing method will be determined.
2. Test Objective
1. Determine the linearity and precision of a series of standards swabbed from a
stainless steel plate and measured by TOC and HPLC over a known concentration
range.
2. Determine the accuracy (recovery) of a series of standards swabbed from a stainless
steel plate and measured by TOC and HPLC over a known concentration range.
3. Determine the Limit of quantitation and limit of detection of a series of standards
measured by TOC and HPLC over a known concentration range.
4. Determine correlation between HPLC and TOC analysis.
5. Determine the visually clean limit.
6. Determine the final HPLC and TOC swabbing limits based on recovery studies.
3. Acceptance Criteria
Test
Objective
Measured Response Acceptance Criteria
3.1. Linearity The correlation coefficient
(r2) for the linear
concentration range. 3.1.1. HPLC: equal to or greater than 0.997 3.1.2. TOC: equal to or greater than 0.980
3.2. Precision % RSD 3.2.1. HPLC: The recovery %RSD less than or equal
to 10.0%.
3.2.2. TOC: The recovery %RSD less than or equal
to 15.0%.
important that all the alcohol has evaporated from the surface prior to
swabbing).
4.2.2. Place the required number of swabs into the established volume of
extraction solvent. Remove swab(s) and swab the designated area according
to the established procedure outlined in the Cleaning Validation SOP G 1.7 or
as outlined in the modified analysis method. Place the swab(s) back into the
extraction solvent and vortex for 1 minute. Remove swabs from vial. Analyse
the resultant extracts by HPLC and TOC.
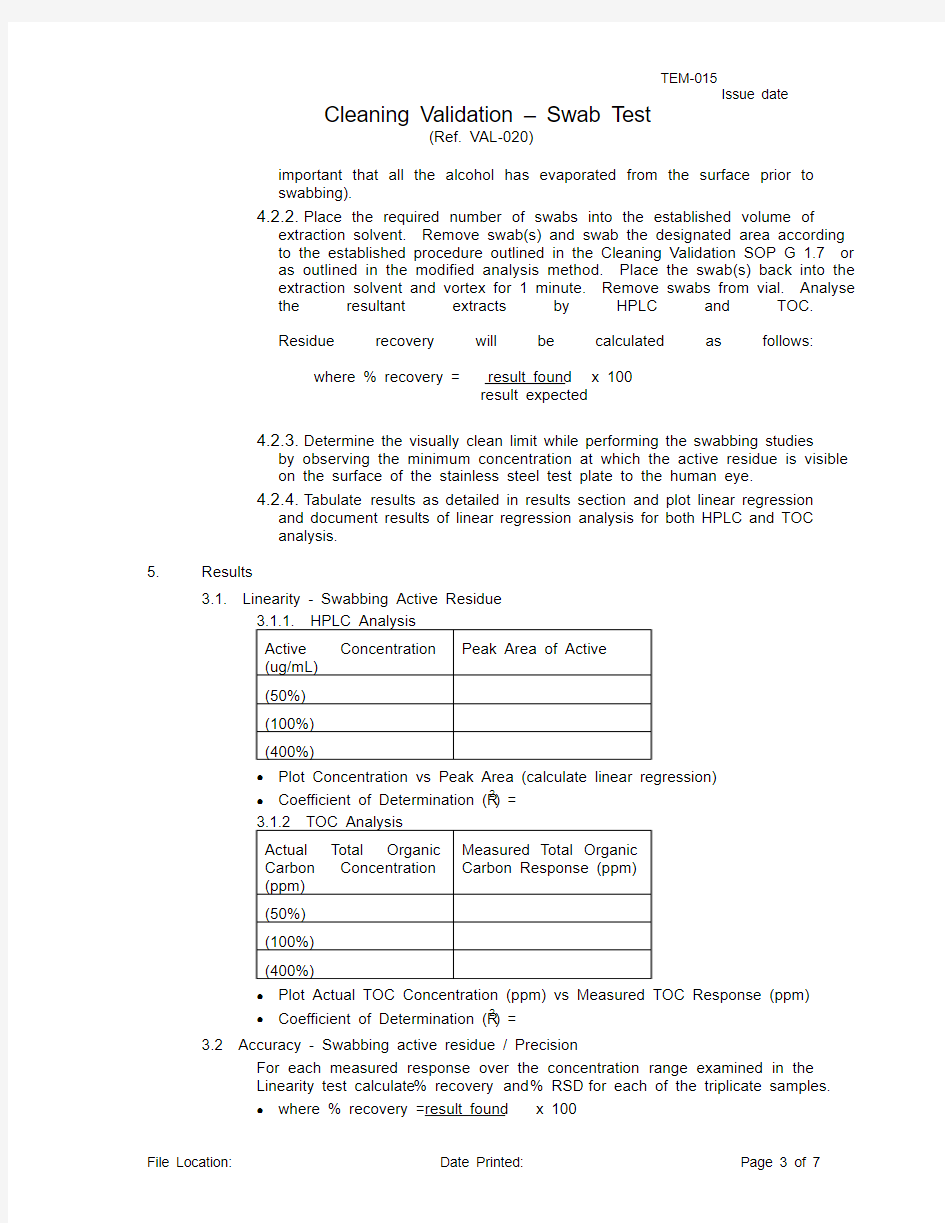
Residue recovery will be calculated as follows: where % recovery = result found x 100
result expected
4.2.3. Determine the visually clean limit while performing the swabbing studies
by observing the minimum concentration at which the active residue is visible
on the surface of the stainless steel test plate to the human eye.
4.2.4. Tabulate results as detailed in results section and plot linear regression
and document results of linear regression analysis for both HPLC and TOC
analysis.
5. Results
3.1. Linearity - Swabbing Active Residue
3.1.1. HPLC Analysis
Active Concentration
(ug/mL)
Peak Area of Active
(50%)
(100%)
(400%)
?Plot Concentration vs Peak Area (calculate linear regression)
?Coefficient of Determination (R2) =
3.1.2 TOC Analysis
Actual Total Organic Carbon Concentration (ppm) Measured Total Organic Carbon Response (ppm)
(50%)
(100%)
(400%)
?Plot Actual TOC Concentration (ppm) vs Measured TOC Response (ppm)
?Coefficient of Determination (R2) =
3.2 Accuracy - Swabbing active residue / Precision
For each measured response over the concentration range examined in the Linearity test calculate % recovery and % RSD for each of the triplicate samples.
?where % recovery = result found x 100
MAC per cm2 level Average Recovery
(Budesonide) ppm
HPLC Average recovery (Pulmicort carbon) ppm TOC
(50%)
(100%)
(400%)
?Plot Average Recovery Active 1 ppm HPLC vs Average recovery Active 2 ppm TOC
Linear regression line =
Correlation coefficient (R) =
Coefficient of determination (R2) =
5.2. Visually Clean Limit
The Visually clean Limit must be determined while performing the swab recovery studies. This is done by visually inspecting the surface and determining the highest concentration of active residue that is not easily detectable by visual inspection. This concentration is then recorded as the Visually clean limit.
Visually Clean Limit = _________________
5.3. Determining Final HPLC and TOC Swabbing Limits Based on Recovery Studies
HPLC Swabbing Limits
Determine the lowest and most conservative active recovery value obtained during the method validation study for HPLC analysis.
Lowest HPLC swab recovery value = ____________
Calculate the final HPLC swabbing limit for the surface tested:
Active MAC per cm2of total surface area x swabbing area x lowest swab recovery
average recovery from swabbing material
= “X” mg per swab
divide by extraction volume and multiply by 1000 to give ppm limit per swab
HPLC Swabbing Limit = __________________________________= ________ mg per swab
HPLC Swabbing Limit (ppm)= ________________________= __________ ppm per swab
Example Calculation:
0.000417 mg/cm2 x 100 cm2 x 0.6864 = 0.02898 mg per swab
0.9877
If each swab is extracted using 25.0 mL of water, the limit becomes:
→0.02898mg/25mL x 1000 μg/mL = 1.16 μg/mL or 1.16ppm per swab.
5.4. TOC Swabbing Limits
Determine the lowest and most conservative active recovery value obtained during the method validation study for TOC analysis.
Lowest TOC swab recovery value = ____________
DOCUMENT REVISION HISTORY
Revision # Date Reason for Revision Author Initial for
Retrieval of
Outdated
Documents
