雅思小作文
? 6.5分小作文写作纲要
分成4 块模式:
1.special terms:appear, emerge,不合要求,make one’s debut
Agree, in favor of, advocate高端词汇
2.架构和过度:改变结构,使用新颖句型和连接成分。
1. referable.
2.个性化
3.temporal topics: broad topics: 文章论据相似,题目千变万化,但大主题是
一样的,一共有十大主题,合并后有六大主题:生涯规划、基础设施、
抽象题、科技、马斯洛生理需求、全球化。
1.TASK ONE: (F4)
饼图/ 柱状图/表格题/曲线图,其中柱状图考察频率最高。
?考试高分必备表1——Trend
INCREASE DECREASE STABILIZATION 词语说明词语说明词语说明
Junk words increase decrease Stand at
remain stable
stay steady
keep constant
the same
没有相对比较
时用
掌握一种讲法rise fall
raise(n) drop
grow decline
climb descend
Favorab le Words rocket 90 plummet maintain
remain plane
stay unvarying
keep balanced
*morose
*slack
*sluggish
*gloomy
*stagnant
*表示为形容
词。通常作系表
架构。如:
The market was
morose.
反义词为:
buoyant, active,
firm。如:
The market has
been active. escalate 80 plunge
swell 70 collapse
soar 60 slump
surge 45 subside
boom 30 ebb
ease up 20 ease down
edge up 10 edge down
creep up <10 creep
down
Special words rally 反弹retrieve 反降reach a plateau 高位平稳accrue 小平abate level off/out 低位平稳leap 大平dip even out 中位平稳
FLUCTUATION(Fluctuate)
同义词动undulate, vacillate, waver, shift, vary,
alternate, flutter, swing
Illustration
形volatile, variable, mutable,
capricious, fluid
It fluctuated
四种必1.from…to…/during…and…用于任意两个无特征性数字
2. within a (large/small) range of…用于两个差值为十、百、千的整数
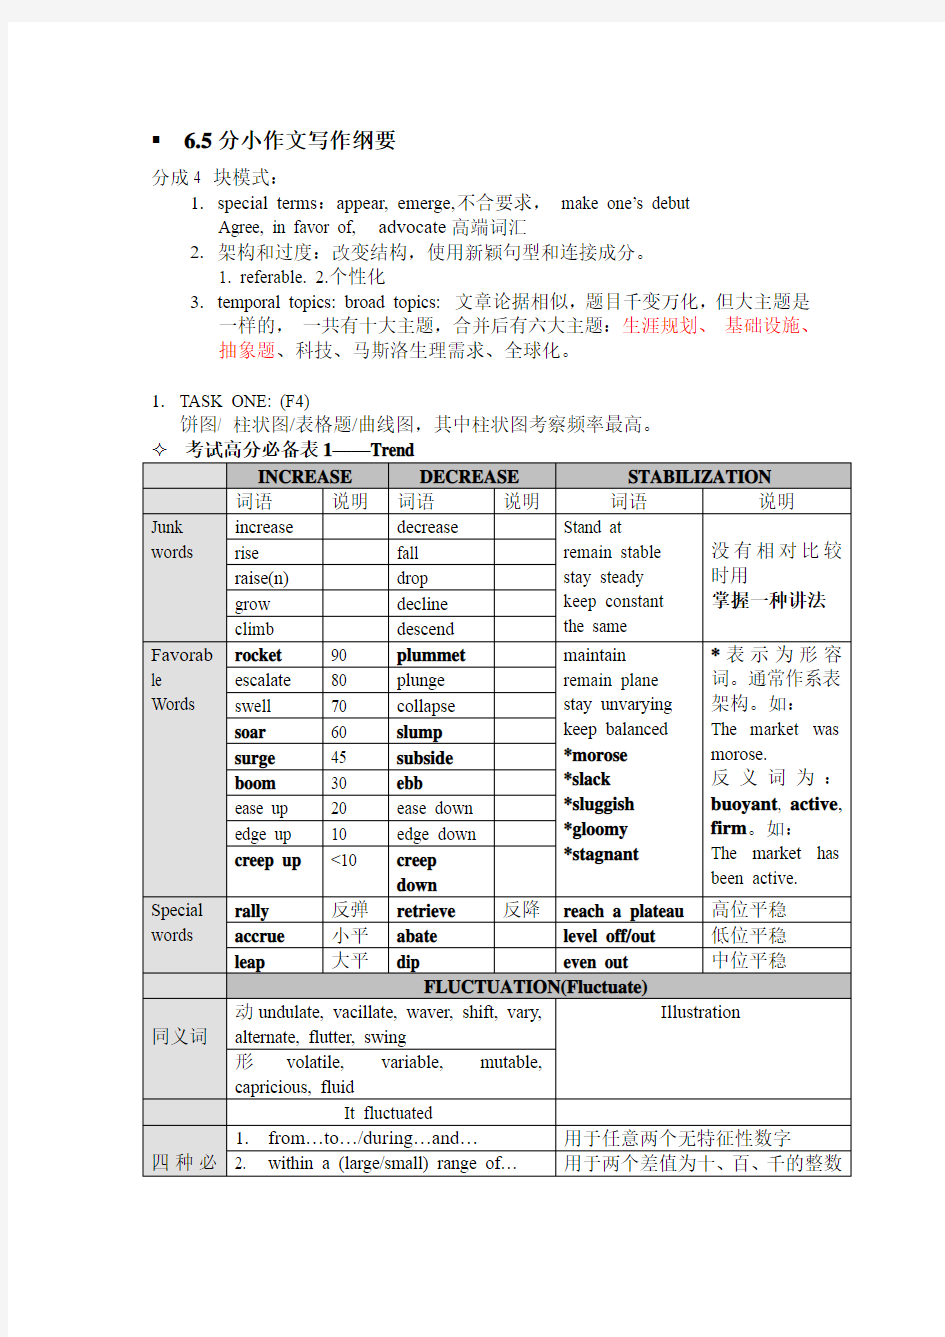
备句型 3. reaching a peak at (statistics) in (year) and bottoming out at (statistics) in (year) 第一种方法的复杂版,通过表示伴随状况的从句揭示最高最低点
4. 2+3 此句为小作文必备,每次都会用到450
4
25
2
02
1 25 1950 1980
American Consumer’s Expenditure
1970 1980 Russian Consumer’s Expenditure
考试高分必备表2——Extent
Words Illustration Sample sentence
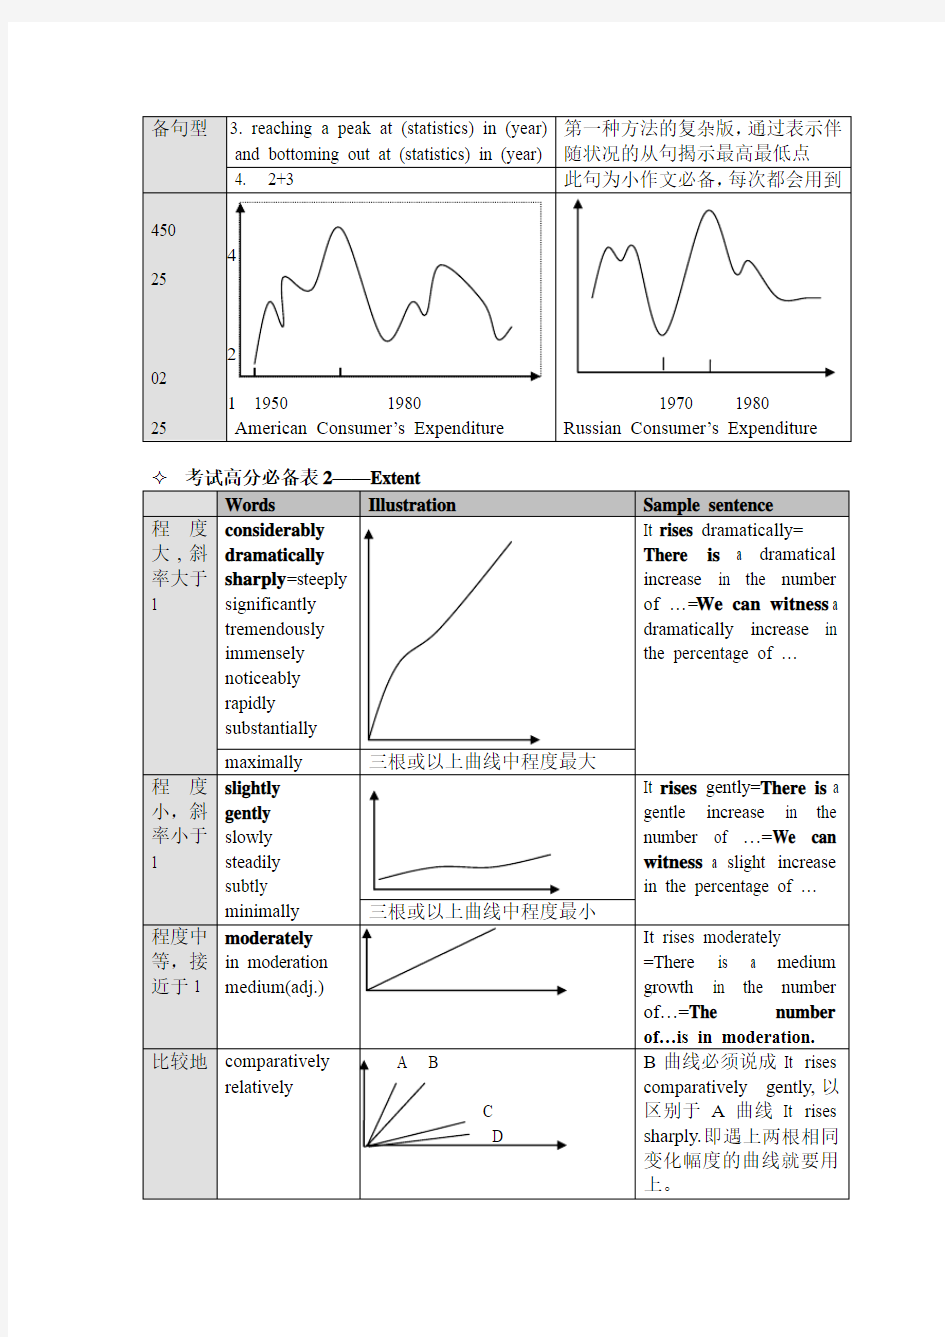
程度大,斜率大于1 considerably
dramatically
sharply=steeply
significantly
tremendously
immensely
noticeably
rapidly
substantially
It rises dramatically=
There is a dramatical
increase in the number
of …=We can witness a
dramatically increase in
the percentage of …maximally 三根或以上曲线中程度最大
程度小,斜率小于1 slightly
gently
slowly
steadily
subtly
minimally
It rises gently=There is a
gentle increase in the
number of …=We can
witness a slight increase
in the percentage of …
三根或以上曲线中程度最小
程度中等,接近于1 moderately
in moderation
medium(adj.)
It rises moderately
=There is a medium
growth in the number
of…=The number
of…is in moderation.
比较地comparatively
relatively
A B
C
D B曲线必须说成It rises comparatively gently,以区别于A曲线It rises sharply.即遇上两根相同变化幅度的曲线就要用上。
平滑地gradually
regularly
continuously
progressively
smoothly A
B
A: It rises gradually
B: It rises gently
A曲线也可说成It rises
gently,但效果就差了,所
以―逐渐地‖是一个优先
表达的意思。
大约地about
around=some
roughly
nearly
more or less
in the
neighborhood
of
approximately
circa
almost
well nigh 整数级的数据
个位数的数据
小数点后的数据
图表作文经常要表达
―大约‖的意思,左表根
据精确度进行升序排
列。
*almost和well nigh只
能修饰程度,绝对不能
跟数字连用。其余应准
备黑体词语。
分别地respectively The numbers of students
in UK and Japan are
2100 and 2155
respectively.
相应地correspondingly
proportionately A
B
B: It leveled off initially
and surged
correspondingly.表示某
部分的变化趋势与另外
一根一样。
均匀地evenly 对于这样的曲线确实很
难讲清楚,但是我们发
现曲线的起点和终点较
接近,可说成It rises and
falls evenly.表示不管怎
么变化,涨幅和跌幅相
同,起落同幅。
考试高分必备表3——Phrase
摸高探底平均值天龙八部
reach a peak reach a summit reach a zenith reach a pinnacle reach an apex reach a vertex reach an acme reach a culmination bottom out
hit a trough
nadir
base
underside
nether part
floor
deepest part
average out at
take an average
strike a balance
reduce to a mean
equate
equalize
rise and fall evenly
Task 1的三种基本句型:
1.主位模式
2. there be模式
3. We can witness…
F4整体备战:
1.饼图:Pie Chart
Paraphrase and enrich the expression of statistics
1)数据的paraphrase
?60%= three-fifths// three out of five
= a/the majority of >50%
= a l arge/striking/potent/overwhelming/dominant/leading/astounding
/splendid/extraordinary/bulky/superfluous/magnificent
portion/part/share/ratio/proportion/percentage/margin of
?>80% (93%)= a lion’s share
?<50%=a minority of, a marginal/micro/slim/slender/tiny
/small-scaled/meagre/barren/unnoticed/neglectable/pathetic portion ?35%:comparatively majority
?37.8%= maximum/comparatively a majority of (<50%的最大值)
?40% 35% 25%
?65% 20% 15%:comparatively a minority of WRONG
40% 35% 20% 5%
?40%: comparatively a majority(描述)
?5%: a minimal portion (极值)
?20%: one-fifth (分数)
?35%: in moderation, moderate share//medium share (描述)
饼图的三句万能句型
a)数据+抄题+导入宾语
b)主语+―占据‖(先特征,后数据)
c)剩余数据
―占据‖的讲法:
a)constitute
b)make up
c)be the factor(s)/instrument(s) of 致成物
the remaining 35% a.
the rest (35%) a./n.
the remainder n.剩余物
the remnant n.
the remainder of 35%
in the charge of – sb
due to//owing to//attributed/ascribed/attached to//for//oriented to//belong to—sth归因于
Pie Chart的审题过程:非常简单
1.看文字信息
2.标题审题标1\2\3 2>1>3
Food and drink, Other items covered comparatively a majority of the Average weekly expenditure, at 26% and 24% respectively.
小作文时态:
1.过去时——过去时间
2.将来时——将来时间
从过去到将来——现在时
3过去进行时
4现在完成进行时
两种禁忌时态:
1)现在完成时(描述阶段)
Since 1970, there has been a large increase in ______.
最后段文字总结的时候可能会用到现在完成时
2)现在进行时
On the other hand, Recreation and education, Clothing accounted for a small portion of the expenditure, at 17% altogether/en masse.
“累加”的写法:
totaling 17%//amounting to 17%//adding up to 17%//with a total of 17%//equaling 17%//summed up as 17%//put together as 17%
When added up, they amount to ___19% of the expenditure was shared by Housing and power. Furthermore, the remaining 14% was due to Transport and communication.
两个饼状图的写作顺序:
1)先写一个,另一个再比
2)直接联动
Coal occupied the maximal portion//was the biggest instrument of the sources of energy, at 47% while Nuclear accounted for a tiny share, with only 1%. Furthermore, 28% altogether of the energy was shared by Oil and Hydro. The remaining 24% was due to Natural Gas.
Task 1的五种基本句型:
1)In 1980, the percentage of Coal increased/crept up by 4%//to 51%.
2)There was an increase/creeping-up of 4% in the percentage of Coal.
3)We can witness…
4)The year of 1980 (Place) witnessed/reflected/saw/signal ed/found …
eg. New York witnessed an unprecedented economic growth in the 21st century.
5) A outnumbers/ out percentage B by…
A比B大3000. A outnumbers B by 3000.
A比B大20%. A outpercentages B by 20%.
A: Coal in/of 1980
B: that in 1970=its counterpart(in 1970)对等物
eg. Coal in 1980 outpercentaged its counterpart by 4 percent.
Coal was the biggest/leading//predominant/outstanding/striking instrument among its counterparts,while Nuclear skyrocketed by 10 times.
the percentage of Nuclear was 11 times//eleven-fold that of its counterpart
There was an increase of 10 times in Nuclear.
We can witness …
The year of 1980 witnessed…
Coal in 1980 outpercentaged its counterpart by 10 times
Oil almost remained stable.
There was a decrease of 4% in the percentage of Hydro. In addition, the year of 1980 witnessed a slump of 9% in Natural Gas. What is worth mentioning is Oil was almost morose during the decade.
Through the charts, we can easily draw the conclusion that the new source of energy, particularly Nuclear was given full play while the traditional ones, though still dominant, reached their bottleneck/ceiling to some extent.
两个图的写作原则:3+5
第一张图——3句万能句型
第二张图——涨/跌/平的比较,5个数据。2涨+2跌+(1平)
数据很多的时候,第一张图分三种情况:
最大的——2号句型
最小的——1号句型
中间的——3号句型
Social…, ad, edu, sci cover comparatively a majority of their main fields of study, at …respectively, while 2.24%, 1.84% and 2.10% are shared by... The remaining percentages are in moderation, at 5.53% for , 7.4% and 9.35% respectively. increase max:
min Social Science
Comparatively a majority of Australians aged between 55 and 69 chose Social Sciences, Arts, Engineering, Administration and Education as their main fields of study. On the other hand, Veterinary, Agriculture and Architecture became the least popular subjects to be majored in, accounting for 2.0% and 2.96% respectively. The remaining statistics were in moderation, with an approximate share of 11%.
三个(以上)图的写作原则
分两段,先写最早的。
直接联动(曲线图写作模式)
四个(以上)图的写作原则
参考剑7第四篇,从时间和空间上分析,先时间后空间进行分析。
饼图总结:
一个图:3句万能句型
两个图:3+5
三个图:分两段,先写最早的
四个图:从时间和空间上分析,先时间后空间进行分析。
2. Line Chart
曲线图写作模式:(动态图的写作模式)
要求:1)天龙八部的运用,10篇以上
2)总分部分,先宏观概括,在作出阶段性的分类。
方法:
1.形态划分:根据四大基本形势变化或者变化的程度进行划分。
eg:汉堡销量图
The graph below shows Harry’s annual sales of hamburgers in 1998.Write a report for a university lecturer describing information shown below.
HARRY’S annual sales of hamburgers (1998)
3000
2500
2000
1500
1000
Jan Feb Mar Apr May Jun Jul Aug Sep Oct Nov Dec Para 2:总分句
All trends(动态)/statistics(静态)/charts(多图) can be categorized/classified into ____ stages(时间)/groups(无时间)/types(多图) with (―general‖ trends or characteristics).
General trends=junk words
with fluctuating from Jan to June, rising sharply from June to Aug, falling sharply from Aug to Oct and rising gently from Oct to Dec.
with fluctuating from Jan to Jun, rising from Jun to Aug, Oct to Dec, falling from Aug to Oct.
with fluctuating gently from Jan to Jun and fluctuating sharply from Jun to Dec. eg:
The graph below shows the number of people at a London underground station from 6:00 to 22:00.
Write a report for a university lecturer describing information shown below.
Number of people at a London underground station
6 7 8 9 10 11 12 13 14 15 16 17 18 19 20 21 22 Time Both trends can be catergorized into 2 stages, with rising and falling sharply, from 6-10,16-20; and rising and falling evenly, from 11-15, 20-22.
这个例子就是水平划分法——极其复杂的图根据曲线变化的相似度进行划分。
2.点位划分法: (合并起点和终点)
with fluctuating evenly and gently from Jan to Jun and fluctuating evenly and sharply from Jun to Dec.
? 形态划分法——最简单的图 ? 点位划分法——较复杂的图
? 水平划分法——极其复杂的图 根据曲线变化的相似度进行划分。 ? 比较划分法——两根曲线 Comparative Classification:
popularity of 1) p redominance/prevalence of 2) p
reference to
All statistics can be categorized into 2 stages with the popularity of listening to radio/predominance of radio audiences/preference to listening to radio from about 6 am to 1 pm and the popularity of watching TV/predominance of TV audiences during the rest of the day.
单线//分线描写(天龙八部)
As to the radio audience, it soared from about 6 am to 8 am, reaching the peak at
400 300 200
100
about 25% at 8 am, followed by ebbing till the end of a day. We can witness the nadir occurred at around 4 in the morning.
Back to the people watching TV, most of them watched TV from 5 pm to 12 am. The trend almost rose and fell evenly with sharp rise and fall. 8 in the evening was the peak hour for people to watch TV. Furthermore, after 3 am, less than 5% of people would listen to radio or watch TV.
What is worth mentioning is that 8 am and 8 pm are the peak hours for people to listen to radio and watch TV respectively.
All statistics can be categorized into 3 stages with the equilibrium均势of/between the birth and death rates in the first decade of the 20th century, the predominance of birth rate in the following two decades, and the predominance of death rate from 1930 to 1970(in the consecutive 40 years).
As to the birth rate, stabilization in the first ten years was followed by leaping to its zenith at 60 per thousand in 1920. We can witness a clear slump to almost one-third of the zenith in 1940. The next 20 years reflected an even rise and fall. Finally it abated to the trough in 1970.
Contrary to the birth rate, the death one continued to creep down after the overlapping period till 1930, when a rally was shown between 1930 and 1940. Fortunately, fewer people died in the rest years, with ebbing to the nadir in 1970. What is worth mentioning is that both birth and death rates reached the bottom level in 1970.
As to death rate, it abated from 1900 to 1930, followed by soaring to its peak at 5% in 1940. We can see an ebbing till 1970.
In the respect of birth rate, the first decade witnessed stabilization, followed by leaping to its peak/zenith at nearly 6% in 1920. It slumped to 2% in 1940 and rose and fell evenly in the next two decades. Finally it had the similar trend with its counterpart, death rate.
Chicken 再涨,Fish变化不是很大
剑7test2 第四篇练习。
3.表格题
数据很多,大概20多个
描述的主线是时间线。非时间线作为副线。横向纵向皆以时间线为主。
The first chart below shows the results of a survey which sampled a cross-section of 100,000 people asking if they traveled abroad and why they traveled for the period 1994-98. The second chart shows their destinations over the same period.
Write a report for a university lecturer describing information shown below.
VISITS ABROAD BY UK RESIDENTS BY PURPOSES OF VISITS(1994-98)
1994 1995 1996 1997 1998 Holiday 15,246 14,898 17,896 19,703 20,700 Business 3,155 3,188 3,249 3,639 3,957 Visits to friends and relatives 2,689 2,628 2,774 3,051 1,181 Other reasons 982 896 1,030 1,054 990 TOTAL 22,072 21,610 24,949 27,447 28,828 这张图的重点是横向。
Basically soared, almost soared, or soared except in 1995.
下面这张图正好相反,纵向比较重要。
DESTINATIONS OF VISITS ABROAD BY UK RESIDENTS BY MAIN REGION(1994-98)
Western Europe North America Other areas Total
1994 19,371 919 1,782 22,072
1995 18,944 914 1,752 21,610
1996 21,887 1,167 1,905 24,949
1997 23,661 1,559 2,227 27,447
1998 24,519 1,823 2,486 28,828
This is the similar trends of sth.
Sample
You should spend about 20 minutes on the task.
The table below shows the average family expenditure in Britain.
Write a report for your teacher describing in the information shown below.
You should write at least 150 words.
Average family expenditure in Britain (%)
ITEM 1967 1977 1996 Food 21 19 18 Alcoholic drink 7 7 4 Tobacco 6 4 2 Clothing and footwear 9 8 6 Housing 12 14 16 Fuel, light and power 5 5 4 Household goods and services 10 7 14 Transport and communications 9 14 16 Recreation, entertainment and education 7 9 11 Other goods and services 14 12 8 Other items -- 1 1 该图中横轴概念是主线。
Food always accounts for the largest portion of the expenditure.
先趋势后数据
1.先趋势
左边标编号:food跌,写1,1表示第一种变化,趋势。后面下跌的都标1.最多标到4.
总分句:all trends can be catergorized into four groups. With falling in items such as foo d…. rising in items including housing, fluctuating household goods and services , and stabilizing in other items.
2.后数据
表格右边,记住编号代号。1.极端数据,2. 范围 3 . 平均值
类比可不标4直接连在一起。反比连在一起,后面写一个―反‖
以上是表格题动态图。
下面是表格题静态图:
The table illustrates the information of the countries of Madagascar and Mauritius around the Indian Ocean with the following statistics in 1999
Write a report for a university lecturer describing the information shown below
Madagascar Mauritius
surface area(km2) 12823 2189
population(thousands) 2678 456
GDP(US$ per capita) 120 360
growth rate of population 12% 2%
enrolment of school: primary 97% 99.52%
secondary 51% 73%
表格静态图:使用纯比较原则,因为无法单独罗列数据。
数字系统比较:较数据大小的两种形式:1. 多少 2. 倍份
文字系统比较:静态图使用占50%。
Sample: Writing of FAQ for IELTS Task 1
Passage 2
The table makes a detailed comparison and contrast of different items of Madagascar and Mauritius around the Indian Ocean in 1999.
Madagascar was leading in the following items: surface area, population and growth rate of population, which was almost 6 times that of the Mauritius. The surface area of Madagascar reached 12823 km2 while that of Mauritius only accounted for 2189. The percentage of growth rate of population covered 12%, 5 times above that of the counterpart.
However, some of the indexes were led by Mauritius. The GDP per capita of Mauritius amounted to 360 US$, three times that of Madagascar. As for the percentages of enrollment of school, Mauritius also outpercentaged Madagascar in primary and secondary school. The difference was 2.52% for primary school and 22% for secondary school.
What is worth mentioning is that the indicators of wealth of a country are contradictory with the statistics of population and growth rate of population. WRITING TASK 1(Passage 5)
The table below shows the kilometers of route, date opened and passengers per year (unit: thousand) of the underground railway system in 6 cities.
kilometers of route date opened passengers per year London 1997 1878 1900
Paris 1503 1900 2400
Tokyo 1122 1917 3996
Washington 400 1945 300
Los Angles 15 1967 400
Miyazaki 11 1978 122
考察横向纵向的描述顺序,静态图。
文字系统常用的表达:
1.Be given full play.
2.Be attached a more importance to
3.Maintaining a momentum
剑7 第二篇Chicken consumption is attached more importance to.
Chicken gained upper hand to beef.
There is equilibrium between A and B.
最后看两个词:
Imparallel: there is an imparallel gap between A and B.
Unrival: number1 . A is unrivaled among sth.
Counterpart: 一般的小作文基本上会用到。
Chicken’s consumption is unrivalled among its counterparts.
We would be optimistic/ pessimistic about sth.
Sth would foresee a bright future.
4.柱状图
本质是其他三个题型的柱子版
百分比
All trends can be categorized into 3 groups,with fluctuating in bus, rising in car, and falling in bike and walk.
?小作文整体写作框架
Opening: 不要说的太详细(时间、类型、单位、趋势)
?Vary /differ
?paraphrase
?Glance at the bar chart,
?图与图之间没有联系的加上respectively.
?As it shows in the bar chart, (中国和英国的四大行业)
?The percentage of total commuters in Europe city
?真假主语自己通过语义判断。
通过剑桥练习OPENING 的改写。
?Body: 形态划分是主流(两线相交用比较划分法)
?Statistics: 雅思对主体段的分段比较松,不同类型图标分段写,同类型的也可分开写,分层次。
?反义词的题目需要注意。
?Debut现象,food那张表。
?Ending :小作文就是量的问题。
流程图写作技巧:包括流程图加上地图题
Opening:按格式去套
Body:按顺序原则写(as to, as for , in regard to, concerning, on sth, given)Ending: through a brief introduction of sth, we come to realize that..
Having a general glance of sth.
实例分析:剑六蚕丝制作。
不要花太多时间在结构上。
涉猎的语法现象:
1)被动语态:put in to the basket, the eggs..
2)定语从句:减少主语重复
3)状语从句:时间、地点、方式、原因、结果、目的
4)分词短语
5)介词短语:with , by ,through , to
五个重点:
1. 整体格式
2 句式的丰富
(被动语态、过去分词、定语从句、状语从句、分词短语、介词短语)
3. 过渡的自然:
4. 词汇量的拓展
5.适当的展开加联想
实例分析:剑六蚕丝制作。
这里分析有关瓶子的作文
There are 3 stages.
Stage1:
So that they are easily transported by trucks or vans .
In the second stage, they get high pressure water.
There are 3 different channels in the plant, which represent 3 different colors of the glass, or three tenors. After recycling in the furnish, glass products are melt into … compound is finally modeled into solid.
Thus the glass will go to the customers for different purposes.
地图题重点:1.方位词汇准备好lie, be located in , sits in , Appear, disappear,
2.注意设施的有无增减
TASK1.总结:20分钟按顺序做,F415篇以上,流程图练习四到五篇。
雅思6.5分 小作文范文参考
●批改By Will 本次批改严格按照ILETS小作文评分标准进行。ILETS小作文评分项:TA (内容的完整性), CC (连贯性及一致性), GRA (语法范围及精准度), LR (词汇资源)。文末会进行总评及打分。 ●文中标识: 用词不当逻辑错误语法错误修改添加 The graph provides the information concerning the average temperatures on a month basis in three major cities.(介于有两张图,都要提一下。此后可加一句:In addition, clearly demonstrated in the table are the time of sunshine on an annual base.) (补充:在下一段看到了你对于后一张图的总结,这样的话建议你在开头强调一下“the first graph”) As can be seen from the graph, there is a similar trend in terms of average monthly temperature between London and New York during the period from January to December. (可加入连接词:To be specific) The average temperature in London (介于你后面写的是两个城市的数据,这里改为:for both of the cities) gradually rises from January to July both in London and new york, reaching a peak at 25 degrees and 20 degrees respectively. After that, the following 4 months witness a dramatic decrease both in London and new york. In comparison (这里不妨分段), an opposite trend is found in Sydney. It (这是悉尼的第一句,建议写出来具体的量词至少:The temperature) keeps stable at 25 degrees from January to march, after which the average temperature undergoes a considerable descent, reaching the bottom point at approximately 15 degrees, before there is (there is 没必要了,可以去除) a steady ascent by 10 degrees. It is obvious that the table depicts the average number of hours of sunshine per year in three major cities. As we can see from the statistics, when it comes to the total annual hours of sunshine, new york ranks first, followed by Sydney ,London lies last. Specifically, people who live in new york enjoy 2,353 hours of sunshine every year, which is similar to people living in London with 2,473 hours (不是人和人像,是时间长短像,改为:which is similar to the amount of sunshine for those in London). However, only 1,180 hours of sunshine are found in London annually. 总评6.5(TA6.5 CC6.5 LR6.5 GRA7.0) 1.语法变化上从句数量可以了,分词的使用还可以多一些。偶尔试试一到两句倒装,如我在开头给你的那个。 2.趋势等词汇变化可以,试着多换换题目话题词汇,如people=residents=citizens
雅思写作满分范文:雅思图表作文怎样才能拿满分
雅思写作满分范文:雅思图表作文怎样才能拿满分 The table below gives information on consumer spending on different items in five different countries in 2002. Percentage of national consumer expenditure by category - 2002 构思过程: I know that I can write a short introduction by paraphrasing the question. I look for an overall trend. I can see that the food/drinks/tobacco category has the highest percentages, and leisure/education has the lowest. Now I want to write two main body paragraphs. I need to select something to say about each country. Remember, there is no rule about what information you select; everyone will do this differently. I look for the highest figures in each category: I can see that Turkey has the highest figure for food/drinks/tobacco AND for education/leisure. Italy has the highest figure for clothing/footwear. So, I'll write a paragraph about Turkey and Italy. My final paragraph needs to talk about Ireland, Spain and Sweden. Maybe I'll point out that Ireland has a high figure for the first category, Spain has the lowest figure for education/leisure, and Sweden has the lowest figures for the first AND second categories.
2019年雅思写作小作文流程图解析及范文:废纸回收
2019年雅思写作小作文流程图解析及范文:废纸回收 The chart below shows the process of waste paper recycling. 范文: The flow chart shows how waste paper is recycled. It is clear that there are six distinct stages in this process, from the initial collection of waste paper to the eventual production of usable paper. At the first stage in the paper recycling process, waste paper is collected either from paper banks, where members of the public leave their used paper, or directly from businesses. This paper is then sorted by hand and separated according to its grade, with any paper that is not suitable for recycling being removed. Next, the graded paper is transported to a paper mill. Stages four and five of the process both involve cleaning. The paper is cleaned and pulped, and foreign objects such as staples are taken out. Following this, all remnants of ink and glue are removed from the paper at the de-inking stage. Finally, the pulp can be processed in a paper making machine, which makes the end product: usable paper. (160 words, band 9)
雅思小作文及范文汇总
101. You should spend about 20 minutes on this task. The line graph below gives information about the number of visitors to three London museums between June and September 2013. Summarise the information by selecting and reporting the main features, and make comparisons where relevant. Write at least 150 words. Test Tip Check the horizontal axis to find whether the graph refers to past, present, future or all three. We use the present simple to describe the graph: The graph shows… , We can see… If the graph refers to past period of time, we use the past simple, and if the graph includes future times, we use will or it is predicted that. Look at the line graph and complete the text with the correct forms of the verbs in brackets and the correct prepositions.
雅思小作文评分标准
雅思考试小作文评分标准
雅思写作考试Task 1根据以下四个方面来评定: 1.Task achievement对于任务的完成情况 指的是考生怎样描述所给数据,是否能够辨别及描述与图表有关的主要信息。要求考生回答问题准确,即考生的作文内容是否与所给数据信息密切相关。考生如果想在这部分取得高分,行文就必须尽可能包括主要的相关信息,不要加入无关信息。因此,第一步的审图工作非常关键,考生一定要辨别出图表数据所表达的主要趋势和主要信息。当考生辨认出主要的信息后,就需要进一步寻找相关的细节来佐证主要信息。 完成图表作文要做很多准备工作,其中最主要的是列提纲。众所周知,图表提供大量信息,但是考生不必把所有的信息都描述出来,只要找到主要的信息并在心里组织或写出简要的提纲就可以。考生可以在草纸上列出提纲,也可以随意涂写提纲,即使是汉语也没有关系。在雅思考试中,由于时间比较宝贵,所以提纲一定要简洁,考生可以适当使用自己能识别的缩写形式和其它符号来拟写。提纲拟定后,考生落笔时只要在每一段主要的信息之后补充相应的细节来佐证,便可完成整篇文章的行文。
一旦考生收集到足够的信息,就已经满足了雅思考官的第一条评分标准。 2.统一性和连贯性(Coherence and cohesion) 统一性和连贯性指的是考生怎样组织报告, 报告是否易于理解,同时考查句子之间关系连词的使用。一篇组织得当、易于阅读的作文将会给雅思考官一个良好的印象。考生需要注意: ●段落的组织:考生报告的结构一定要组织得当, 各段落要 连贯,以正确的顺序排列; ●句群的组织:句子之间最好用连词来组织句群; ●句子的变化:尽量避免使用只有一个主语和谓语动词的单 句,把单句扩展成更长的复合句。 (1)段落的组织 在雅思考试Task 1中,一般来说,每个段落只应讨论一个主要变化趋势。考生可根据这一主要趋势添加与其相关的佐证细节,完成该段的主要信息与相关信息的描述。 总的规则是,每一个不同的主要趋势都要各用单独的一段来描述,表中有几个主要趋势,正文就应分为几段。每一段要包含不止一个句子,除了表示主要趋势的主题句之外,还应辅之以与该主要趋势一致的相关细节描述,如具体的数字、数值、升降变化及倍数表达等。如果这个信息只能用一句话表达,那么或者把这个信息放在上一段最后一句,或者
雅思小作文写作教学提纲
雅思小作文写作
Writing Notes Date: July, 9th, 2017 Task I 1.Three Types i.Data: Bar Chart, Line Graph, Table, Pie Chart ◆图表类型:动态图、静态图 ◆动态图:有两个或以上时间 ◆重点 ●趋势 ●特殊值:起点、重点、最高点、最低点、交叉点 ◆静态图:只有一个或者没有时间 ●比较描述对象:使用倍数、比较级 ii.Process: Flow Chart iii.Map ◆Describe the change ◆Eg: Hospital is located to the west of car park 2.评分标准 i.Task Achievement/ Task Response ◆Cover the Requirements of the task ◆No off topics ◆不能添加主观想法,只能描述 ii.Coherence and Cohesive ◆使用路标性词汇:顺承和转折 iii.Lexical Resource ◆使用非高频词汇 ◆Use words and phrases naturally and appropriately ◆Vocabulary diversity ◆Accurate spelling words iv.Grammatical Range and Accuracy ◆Accurate grammar of sentences ◆Use different ranges of sentences, structures to achiever grammatical 3.写作方法 i.开头段 ◆图表词改写 ●The chart : bar chart, line chart, pie chart, table, diagram ◆动词shows改写 ●注意时态 ●Shows: illustrates, gives information about, compares, indicates, demonstrates ◆关键词(一定要改写) ●数量改写 ?The number of + 可数 ?The amount of + 不可数 ?The quantity of + 可/不可数 ?The figure for +可/不可数 ●百分比改写
雅思图表作文满分一例
雅思图表作文满分一例 The table below gives information on consumer spending on different itemsin five different countries in 2002. Percentage of national consumer expenditure by category - 2002 构思过程: I know that I can write a short introduction by paraphrasing thequestion. I look for an overall trend. I can see that the food/drinks/tobaccocategory has the highest percentages, and leisure/education has the lowest. Now I want to write two main body paragraphs. I need to select something tosay about each country. Remember, there is no rule about what information youselect; everyone will do this differently. I look for the highest figures in each category: I can see that Turkey hasthe highest figure for food/drinks/tobacco AND for education/leisure. Italy hasthe highest figure for clothing/footwear. So, I'll write a paragraph about Turkey and Italy.
雅思写作小作文练习_翻译
1. 该表格描述了在...年之...年间...数量的变化。 2. 该柱状图展示了... 3. 该图为我们提供了有关...有趣数据。 4. 该图向我们展示了... 5. 该线形图揭示了... 6. 这个曲线图描述了...的趋势。 7. 数据(字)表明... 8. 该树型图向我们揭示了如何... 9. 该数据(字)可以这样理解... 10. 这些数据资料令我们得出结论... 11. 如图所示... 12. 根据这些表(数字)... 13. 如表格所示... 14. 从图中可以看出,...发生了巨大变化。 15. 从图表我们可以很清楚(明显)看到... 16. 这个图表向我们展示了... 17. 该表格描述了...年到...年间a与b的比例关系。 18. 该图描述了...总的趋势。 19. 这是个柱型图,描述了...
20. 如图所示,两条曲线描述了...的波动情况。 21. 在...至...期间,...基本不变。 22. 在...年到...的期间 23. 1995年至1998三年里... 24. 从那时起... 25. ...月(年)至...月(年)...的数量基本不变。 26. 数字急剧上升至... 27. ...至...期间...的比率维持不变。 28. ...的数目在...月(年)达到顶点,为... 29. 比率维持在... 30. ...的比例比...的比例略高(低)。 31. ...与...的区别不大。 32. 该图表表明...的数目增长了三倍。 33. ...逐年减少,而...逐步上升。 34. ...的情况(局势)到达顶(高)点,为...百分点。 35. 数字(情况)在...达到底部。 36. 数字(情况)达到底部(低谷)。 37. a是b的...倍。 38. a增长了...
雅思小作文写作
Writing Notes Date: July, 9th, 2017 Task I 1.Three Types i.Data: Bar Chart, Line Graph, Table, Pie Chart ◆图表类型:动态图、静态图 ◆动态图:有两个或以上时间 ◆重点 ●趋势 ●特殊值:起点、重点、最高点、最低点、交叉点 ◆静态图:只有一个或者没有时间 ●比较描述对象:使用倍数、比较级 ii.Process: Flow Chart iii.Map ◆Describe the change ◆Eg: Hospital is located to the west of car park 2.评分标准 i.Task Achievement/ Task Response ◆Cover the Requirements of the task ◆No off topics ◆不能添加主观想法,只能描述 ii.Coherence and Cohesive ◆使用路标性词汇:顺承和转折 iii.Lexical Resource ◆使用非高频词汇 ◆Use words and phrases naturally and appropriately ◆Vocabulary diversity ◆Accurate spelling words iv.Grammatical Range and Accuracy ◆Accurate grammar of sentences ◆Use different ranges of sentences, structures to achiever grammatical 3.写作方法 i.开头段 ◆图表词改写 ●The chart : bar chart, line chart, pie chart, table, diagram ◆动词shows改写 ●注意时态 ●Shows: illustrates, gives information about, compares, indicates, demonstrates ◆关键词(一定要改写) ●数量改写 ?The number of + 可数 ?The amount of + 不可数 ?The quantity of + 可/不可数 ?The figure for +可/不可数
剑桥英语10雅思考官范文(大作文+小作文)
剑桥英语10雅思考官范文(大作文+小作文)
剑10 1-2 It is important for children to learn the difference between right and wrong at an early age. Punishment is necessary to help them learn this distinction. To what extent do you agree or disagree with this opinion? What sort of punishment should parents and teachers be allowed to use to teach good behavior to children? One important stage in a child’s growth is certainly the development of a conscience, which is linked to the ability to tell right from wrong. This skill comes with time and good parenting, and my firm conviction is that punishment does not have much of a role to play in this. Therefore I have to disagree almost entirely with the given statement. To some extent the question depends on the age of the child. To punish a very young child is both wrong and foolish, as an infant will not understand what is happening or why he or she is being punished. Once the age of reason is reached however, a child can be rewarded for good behavior and discouraged from bad. This kind but firm approach will achieve more than harsh punishments, which might entail many negative consequences unintended by the parents. To help a child learn the difference between right and wrong, teachers and parents should firstly provide good role modelling in their own behavior. After that, if sanctions are needed, the punishment should not be of a physical nature, as that merely sends the message that it is acceptable for larger people to hit smaller ones-an outcome which may well result in the child starting to bully others. Nor should the punishment be in any way cruel.
雅思小作文范文-地图
The development of Chorleywood village from 1868 to 1994. 思路: 1. 严格按照时间的推进进行描述,不可以出现倒序或是插叙的情况。 2. 物体的坐标词汇应该是绝对方位词:东西南北,物体的大小词汇应该是相对单位词:较大,较小,倍数等。 3. 线段的描述应该包含两方面:方向和动作。 4. 注意使用被动句来表达客观存在。 答案: The map shows the changes and development of Chorleywood village in Great Britain over a period of 126 years from 1868 to 1994. Chronologically, during the first 15 years from 1868 to 1883, Chorleywood was merely a very small village with two crossing main roads for its all transportation. From 1883 to 1922, with the expansion to the south, a new living area took shape and almost tripled the original scale. Besides, in 1909, a railway line, parallel with the east-bound main road, was built, linking the east and west, as well as forming Chorleywood Station. During the next period between 1922 and 1970, Chorleywood extended both eastward and westward and almost doubled the previous size. The year 1970 saw another big change of Chorleywood--the establishment of a south-bound motorway as the axis, which connected east-west main road with the railway. By 1994, there emerged 5 new resident places and some entertainment including Chorleywood Park and Golf course, all of which scattered along the two sides of the newly-built traffic system.(177)
雅思小作文开头段
雅思小作文开头段应该如何写 在雅思写作的小作文部分里,往往我们可以采纳“老三段”式的写法,以不变应万变,不论是线图,柱图,表格,饼图,亦或是流程图,我们都可以采用此种方式完成雅思小作文的写作。 那么老三段式的经典写法中,强调着第一段“开门见山”介绍出本文讨论内容,即改写题目。将必要内容进行改写,这样可以获得高分效应。 第二段“丰实的内容”尽量多地将图表中的信息表达明确,不时的需要我们之前总结的常用表达(敬请参见前几篇文章关于雅思作文经典表达介绍文章)。第三段也就是文章的最后一段,对全文进行一个总结概括即可。 本文将着眼于介绍雅思作文开头段的常用高频高分表达,希望对同学们准备雅思有所帮助。也请同学们积极准备! 五分表达: The chart depicts (that)…该图呈现出… The chart shows (that)… The figures/statistics show (that)… The diagram reveals … The chart illustrates (that)… 六分表达: The graph provides some interesting data regarding…该图为我们提供了有关…有趣数据。 The graph describes the trend of …这个图描述了…的趋势 As is shown/demonstrated/exhibited in the chart/diagram/chart/table…如图所示… According to the chart …根据这些表格… As is shown in the table…如图所示… This table shows the changing proportion of A and B from …to …该表格描述了…年到…年之间A与B的比例关系。 This graph,presented in the chart,shows the general trend in…该图呈现了…总的趋势。
雅思写作小作文范文118篇之范文14
雅思写作小作文范文118篇之范文14 以下是三立在线雅思网给大家分享的雅思写作小作文范文118篇:范文14。希望对大家的雅思备考有所帮助,更多雅思备考资料欢迎大家随时关注三立在线雅思网。 范文14 The computer is widely used in education,and some people think teachers do not play important roles in the classroom. To what extend do you agree or disagree? In this period of communication,computer has been used in all kinds of fields widely, and plays a particular role in our lives. Especially computer has become more and more important in educational field, therefore dozens of people considered teachers could be replaced computers that will go with the current of the times. The above point is certainly wrong; this essay will outline three reasons. The main reason is that people’s brain better than computer. Firstly, people design all kinds of computer’s programs. Secondly, computer doesn’t have logistic ideation. Computer only can defend on that designer inputted computer’s programs to judge a question’s right or wrong. In other words, computer can’t defend on thinking that computer independently analyzes a question’s right or wrong. In case, designer inputted programs that are wrong. Computer output the result that also will be wrong. If this kind of problem happened in classroom, students would be infused plenty of wrong information.
10个雅思小作文的万能模板
10个雅思小作文的万能模板 雅思小作文对很多考生来说都是一个非常复杂而重要的任务,事前准备雅思小作文模版可以为大家节省很多的时间。现在就为大家总结了10个雅思小作文的万能模板,希望会对大家有所帮助。 1、通过第一个曲线图,我们可以知道____,也说明了结果是___ According to the first graph, it can be seen that ______________, it can also be concluded from it that ______________. 2、一张有趣、有教育意义的、(内容)的图片(这句模板在雅思小作文中的应用非常的广泛。) There is an interesting and instructive picture which goes like this: __________. 3、当前有一张涉及______的增长曲线图,许多人______,然而其他人倾向于___ Nowadays there is a growing concern over ______________. Many people like ______________, while others are inclined to ______________. 4、目前,共同之处是_________,许多人喜欢______因为_______除此之外还由于_____ Nowadays, it is common to ______________. Many people like______________ because ______________. Besides, ______________. 5、(图表所示)_____,就像许多其他事物,被____更加喜爱,然而这一观点正被________所抨击,一些人认为_________,他们指出___________ ______________, just like many other things, are preferred by ____________. While being attacked by the idea that ______________, some people consider ______________. They point that ______________. 6、每种事物都有两面性和________,是没有异议的,包括利和弊 Everything has two sides and ______________ is not an exception, it has both advantages and disadvantages. 7、_____作为_____被观察了许多年,但是人们现在像发现新大陆一样注视着它 For years ______________ had been viewed as ______________. But people are taking a fresh look at it now. 8、政府保证________,对于这份保证,大多数人做出了强烈地回应,因为_____ It has stipulated by the government that ______________. To this stipulation, many people respond actively because ______________.
雅思小作文范文汇总
表格图001 You should spend about 20 minutes on this task. The table below give information about Favorite Pastimes in different countries. Summarise the information by selecting and reporting the main features, and make comparisons where relevant. Write at least 150 words. model answer: This table clearly presents and compares favorable pastimes in eight different countries. The pastimes, across the top of the table, are analyzed in relation to each country. As can be seen, about 60% of Canadians, Australians and Americans like watching television. On the other hand, this figure is quite low for China where only 15% of people watch television. Predictably, Americans like music at 23%, whereas only 2 to 5% of people in the other countries feel the same way. 20% of people in England enjoy sleeping as a pastime whereas in Canada and the USA, for example, the figure is only 2%. Interestingly, the Chinese like hobbies the most at 50%, as opposed to only 20% in France. It isn't surprising that the highest percentage of beach-lovers is in Australia and the USA at 30%. It seems that pastimes of people of different nationalities may be influenced by a number of
雅思写作小作文高分开头详解
雅思写作小作文高分开头详解 雅思写作小作文是困扰很多考生的一个大麻烦。面对题目毫无头绪、不知道写什么。那么雅思写作小作文开头究竟有没有技巧?开头技巧又是什么呢?下面天道小编喵喵就帮各位焦头烂额的考生看看雅思写作高分小作文开头的正确写法,希望对大家雅思写作学习有所帮助! 让我们先来看一个雅思小作文的原题目: The two pie charts below show the results of a survey into the popularity of different leisure activities among European adults in 1985 and 1995. 很多考生可能会这样改写它: The two pie charts given illustrate/demonstrate the popularity of various entertaining activities among European adults in two years (1985 and 1995). 这样的改写句子在五年前可能能获得6.0分,但在今天,却很难抓住考官的那双挑剔眼球。所以就要求那些想取得雅思写作不少于6分以上的烤鸭们,从首段就要与众不同些。 好的开头段改写是需要仔细读题目和结合图表中的信息,像标题、数量单位、时间跨度和右侧的副标题等。 那么如何写呢?建议给考生可以先来一个高大上并能抓住考官眼球的开头句,例如:A glance at the multiple-pie chart provided reveals that 。随后加上题目与图表中的关键信息。其次,该题目最后及图表中给的是两个时间点对比,所以切勿用between...and...或during the period from...to...,可以尝试使用分词短语:comparing...and/to...所以该题目可以改写为: e.g. A glance at the multiple-pie chart provided reveals that the relative popularity of various recreations among European adults comparing 1985 and 1995. 所以说雅思高分小作文其实并不难写,只要你雅思写作词汇量 ,主要指同义词替换率要高。加上,语法基本知识具备,像分词短语,倒装和几种不同的复合句结构能够熟悉并且会运用的话,高分是更没问题。 以上就是雅思写作高分小作文开头的写作方法,希望大家认真练习。相信随着对雅思更深层的学习和训练,各位考生都能取得好成绩!如果大家在雅思写作问题上有任何疑问,欢迎咨询天道教育!留学路上,天道始终与你同在!