An Overview on Electricity Markets International Experiences
An Overview on Electricity Markets:
International Experiences
José Carlos Fernández (1), Mariano Ventosa (1), Juan Bogas (2)
(1) I NSTITUTO DE I NVESTIGACIóN T ECNOLóGICA
Universidad Pontificia Comillas, Alberto Aguilera 23, 28015 Madrid, SPAIN.
josecarlosfp@https://www.360docs.net/doc/1f14198177.html, mariano.ventosa@iit.upco.es
(2) OMEL
Alfonso XI, 6. 28014 Madrid, SPAIN.
jbogas@omel.es
Abstract
At the very beginning, the electricity industry was a fragmented sector. Later on,
the increasing economies of scale and the view of electricity as a public service
made governments consider the sector as a natural monopoly, either public or
privately owned. Later, many countries decided on power sector reforms designed
to put the electricity industry in competition.
Different competitive market models have been developed and nowadays many
countries have an experienced electricity market. This paper deals with the
transition towards different models of competitive electricity markets. Moreover,
the results of the most relevant and experienced wholesale competitive electricity
markets are analysed and compared.
Key words: Electricity Market Liberalisation, Competitive Electricity Markets, Market Models, Wholesale Electricity Prices.
1. Introduction
Electricity industry reform has recently been occurring around the world with a major target: competition. Starting from a common structure model, the monopoly either public or privately owned, some economical, technical and political factors made restructuring necessary in many countries.
Nowadays, virtually all OECD countries have decided to open up their electricity markets [1][2]. It is time to evaluate the process generally followed by most of them, and the performance, at least in terms of prices, of electricity reforms.
2. The electricity sector evolution
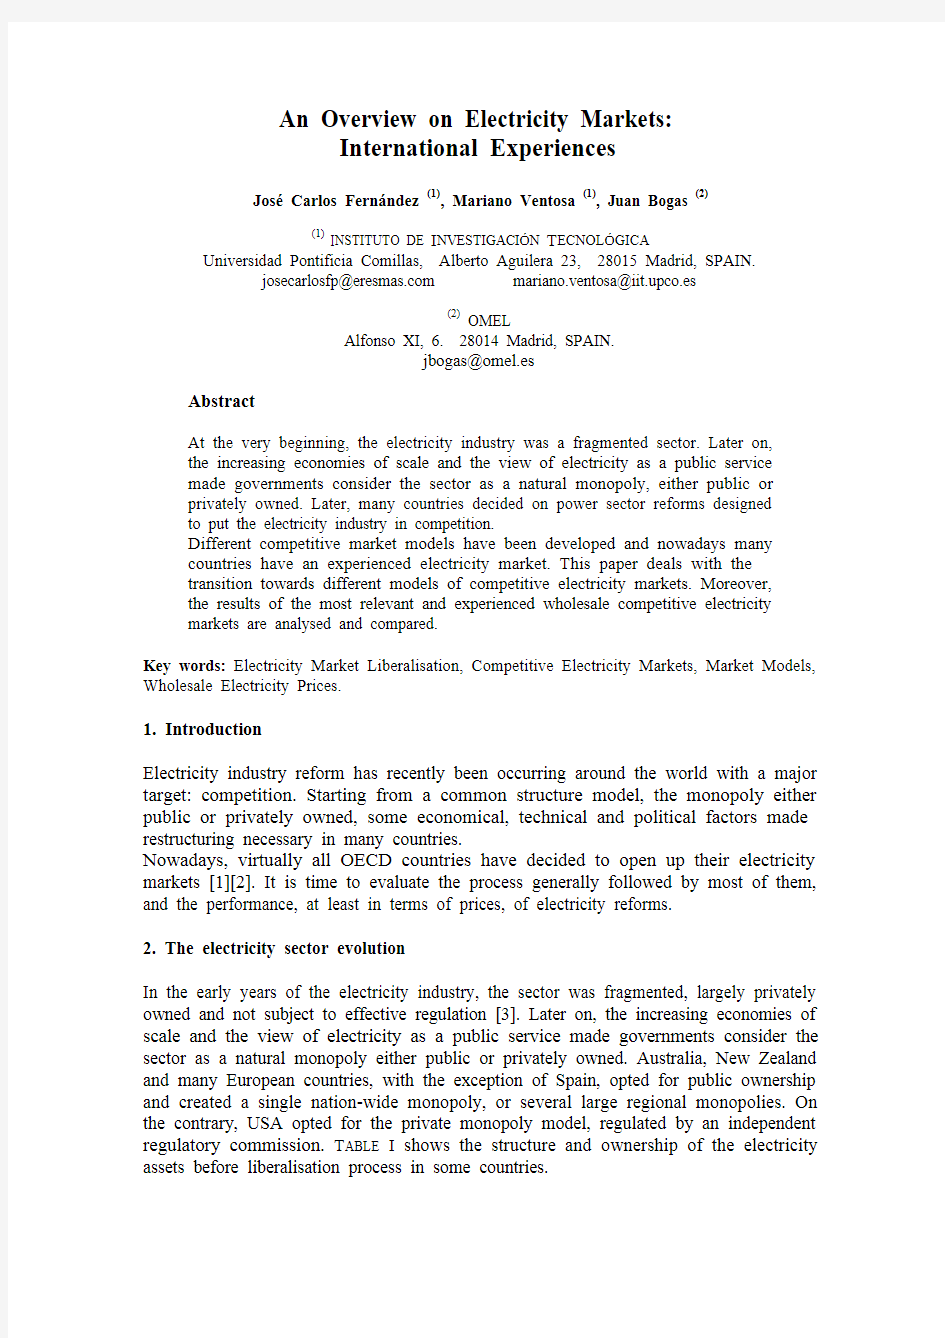
In the early years of the electricity industry, the sector was fragmented, largely privately owned and not subject to effective regulation [3]. Later on, the increasing economies of scale and the view of electricity as a public service made governments consider the sector as a natural monopoly either public or privately owned. Australia, New Zealand and many European countries, with the exception of Spain, opted for public ownership and created a single nation-wide monopoly, or several large regional monopolies. On the contrary, USA opted for the private monopoly model, regulated by an independent regulatory commission. T ABLE I shows the structure and ownership of the electricity assets before liberalisation process in some countries.
T ABLE I– S TRUCTURE AND OWNERSHIP OF ELECTRICITY ASSETS BEFORE LIBERALISATION
Monopoly structure. Type of integration Ownership
Vertical and Horizontal. Vertical
Public Argentina, France, Italy
New Zealand, Malaysia
Chile, England and Wales,
Australia, Norway
Public and Private - Spain Private - USA1, Japan
In the 1970s and 1980s, some economical, technical and political factors made
monopoly inefficiency clear. The globalisation of energy products and the growth of the
available transmission capacity (ATC) as a result of the construction of new interconnection lines, lead to larger potential energy markets. In addition, Combine
Cycle Gas Turbine (CCGT) development conducted to smaller economies of scale.
Thus, many countries decided on power sector reforms designed to put competition in
the electricity industry. This implies changing monopoly model into any other structure
in which competition may be possible. Three widespread models can be identified as
potential operational models with competition [4]: (1) Monopsony model: a single buyer
is in charge of purchasing the electricity to generators while retail consumers remain
captive; (2) Wholesale competition model: distribution companies purchase electricity
from generators through a competitive wholesale market, while retail consumers remain
captive; and (3) Full competition model: retail companies and generators trade through a competitive wholesale market or through bilateral arrangements, and all customers can
choose their supplier.
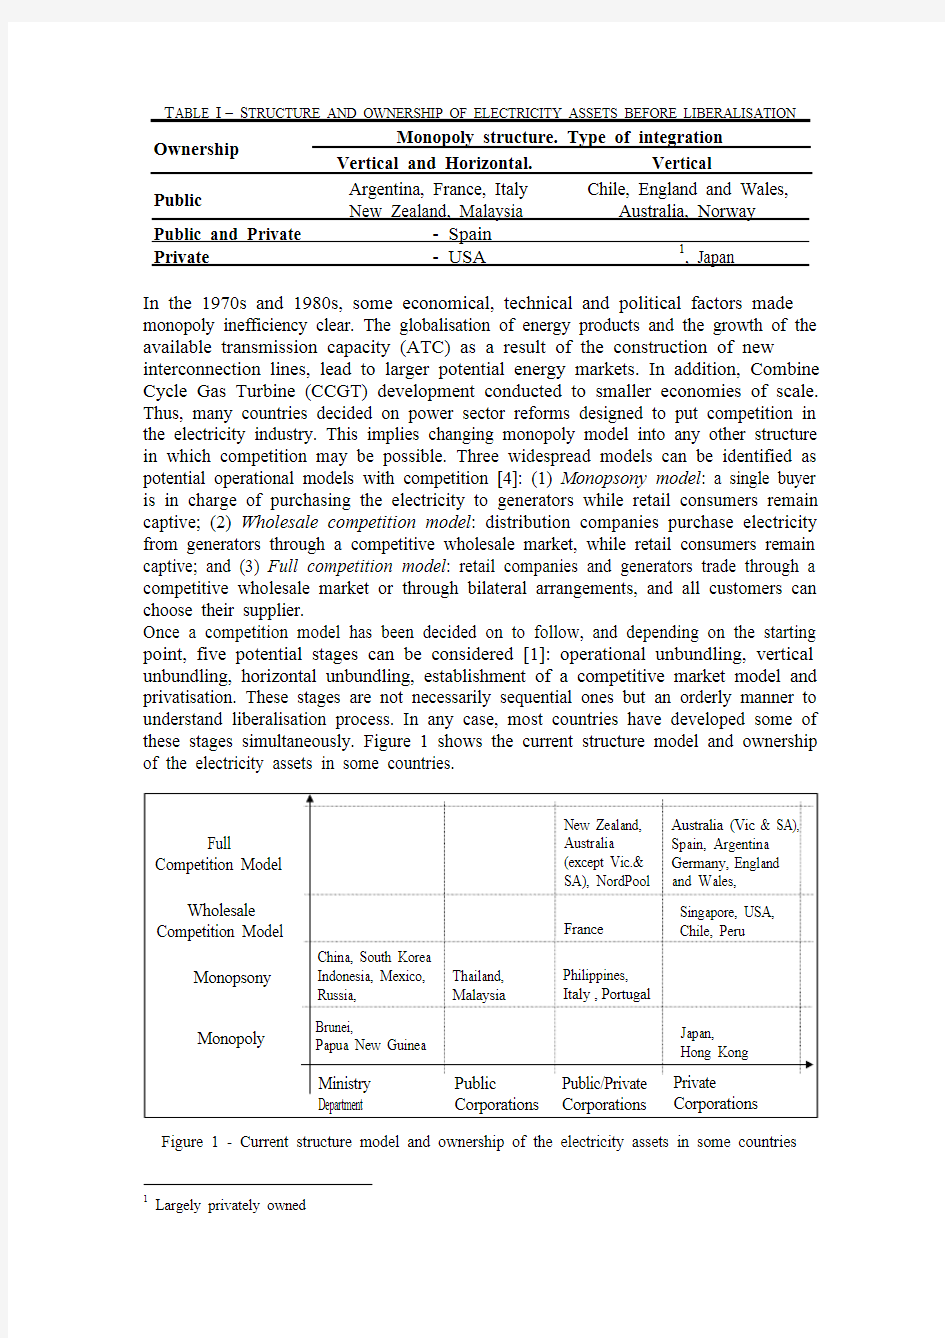
Once a competition model has been decided on to follow, and depending on the starting
point, five potential stages can be considered [1]: operational unbundling, vertical unbundling, horizontal unbundling, establishment of a competitive market model and privatisation. These stages are not necessarily sequential ones but an orderly manner to understand liberalisation process. In any case, most countries have developed some of
these stages simultaneously. Figure 1 shows the current structure model and ownership
of the electricity assets in some countries.
Figure 1 - Current structure model and ownership of the electricity assets in some countries
1 Largely privately owned
3. Institutional framework in a competitive electricity sector
Apart from a new structure model, a liberalised electricity market makes new institutions that did not exist in the traditional monopoly model, necessary. On one hand, one or several Power Exchanges (PXs) are usually set up. A Market Operator (MO) organised as a PX manages a wholesale electricity market. Pricing mechanisms and time horizons of markets are design options that widely vary in Power Exchanges [1][5]. On the other hand, a System Operator (SO) is responsible for the technical operation of the electric power system. Different ownership/management relationship between the transmission grid owner (TR), MO and SO are possible [1] (some examples are given on T ABLE II). Moreover, competitive environment requires monitoring of competitive behaviour by an independent regulator that must guarantee transparency and non-discriminatory application of regulatory rules.
T ABLE II– T HE TSO M ODEL, THE MO/SO M ODEL AND THE ISO M ODEL
Model Functions grouped Countries
TSO TR & SO France, The Netherlands, England and Wales, Nord Pool Countries, Spain, Germany
MO/SO MO & SO PJM(USA), Australia, South Korea, Canada
ISO Independent SO Brazil, California
4. Spot Markets Results
Nowadays, many electric systems have fully, or at least partially, completed the liberalisation process. Some of the most significant and experienced ones have been chosen to analyse their results. All of them have a wholesale or full competition structure model, as follows:
? Competition in the Spanish electricity market began on January 1, 1998. The PX, OMEL, manages daily and ‘intra-daily’ markets, as well as the settlement of spot trades and imbalances. REE is the SO. A Full Competition Model was set up on January 1, 2003. Most physical production is sold on the day-ahead market at a system marginal price (SMP) and all generators but the ones under physical bilateral contracts and electricity imports receive capacity payments.
? Nord Pool is the single electricity market for Norway and Sweden since 1996.
Finland, and Denmark were incorporated in 1998 and 2000 respectively. Nord Pool operates a daily physical market (Elspot) and a financial market. Elspot provides a SMP for the system as a whole, but transmission constraints are managed with zonal pricing (market splitting). There is a TSO in each country.
? EEX and LPX, the two German PXs since 2000, merged in 2002 as ‘EEX’. Germany is a notably exception in competitive electricity markets: there is not an Independent Regulator. There is not a SO either, and transmission operation is decentralised, with
a control area corresponding to each Transmission Company.
? APX is the PX that manages a daily market in The Netherlands since May 1999, where trade takes place within the limits of free available cross-border capacity in the Netherlands. Tennet is the TSO.
? In USA, PJM is the MO/SO along the core of the eastern seaboard. PJM defines a locational marginal price (LMP) in each node, and a weighted average price for groups of nodes called ‘hubs’. Capacity payments are assigned through a competitive market. ? The Australian National Electricity Market (NEM) is a wholesale market which operates across the eastern and southern part of Australia. The SO and MO is
NEMMCO, which, from all offers submitted, operates the system through a centralised dispatch of generating units to meet demand based on the most cost-efficient supply solution. Capacity constraints in the interconnections between regions cause different spot prices in each of the five zones. There is not demand side bidding and virtually all energy is traded through the pool.
To summarize, T ABLE III shows some information from these markets, as the percentage of the contribution of hydroelectric (H), nuclear (N), conventional thermal (T) plants and other sources (O) to the national generating capacity.
T ABLE III– R ELEVANT INFORMATION OF SOME ELECTRICAL SYSTEMS
Generating
capacity [%] Country
H N T O Capacity
Payments
Power
Exchange
(PX)
Energy Traded
through PX
[%]
Spain2 35
15
42
8
Yes OMEL 86.34 Nord Pool Countries3 53 14 31 3 No Nord Pool 26.20 Germany1 9 20 64 8 No EEX 3.2 The Netherlands1 0 2 89 9 No APX 19.2
USA (PJM Area)4 5 22 58 15 Yes PJM 21 Australia59 0 80 11 No NEMMCO ~100
T ABLE IV shows values of hourly or half-hourly spot prices (SP) in the wholesale markets of countries, when available data for the whole year. Annual average SP (M SP) has been calculated as a quantitative comparison tool of price level in each market. Standard deviation of SP (σSP), maximum SP (SP MAX) and minimum SP (SP MIN) give an overall view of price volatility in each market. A comparable measure of price behaviour is obtained with the term σSP/M SP.
The analysis of data in T ABLE IV can give rise to objective conclusions. For the years of the study, OMEL, Nord Pool and NEMMCO prices (all but SA) show an increasing trend. LPX6, APX and PJM seem to show a certain decrease in prices, but two years data is not a definite indicator for price behaviour in the long term. When yearly comparison is possible, lowest average SP are always from NEMMCO prices, a market
in which, unlike the other ones but Nord Pool, private and public ownership coexists. In such markets, public companies operating in a commercial manner do not have great incentives to abuse their market position.
Regarding generation mix, T ABLE IV shows it may have a significant impact on price volatility. OMEL and PJM present the most stable prices within thermal systems. This can be explained through capacity payments. In most electricity systems, prices soar when capacity is short. These ‘price spikes’ theoretically permit generators to recover their fixed costs, otherwise ignored since competitive market prices reflect only the variable costs of production when excess in generation capacity exists. Some electricity markets try to avoid extremely high prices through ‘capacity payments’, that allow generators to recover their fixed costs with lower spot prices.
2 National Generating capacity data as of December 2001. Adapted from [6]
3 Installed capacity data adapted from:[9].
4 Generating capacity data for PJM summer net installed capacity as of 12/31/00. Adapted from [7].
5 Installed capacity data source: [8]
6 LPX data for 2002 reflect prices for Power Exchange resulting from the LPX & EEX merger (known at present as EEX) since June 2002.
T ABLE IV – W HOLESALE E LECTRICITY P RICES [€/MW H ]
Annual values Summer Winter Power
Exchange Year M SP σSP SP SP M σ SP MAX SP MIN M SP SP SP M σ M SP SP
SP M σ 199825.1 6.38 0.2560.22 7.51 25.2 0.24 25.4 0.28
199925.9 6.84 0.2651.54 8.71 25.4 0.21 29.9 0.35
200030.6 11.95 0.3990.15 0.01 26.8 0.31 20.4 0.48
200130.1 13.78 0.46113.25 0.00 32.9 0.32 49.4 0.45
OMEL 200241.1 16.33 0.40158.41 5.68 39.1 0.34 22.0 0.50
200123.3 8.34 0.36238.01 3.89 23.1 0.18 22.9 0.23 Nord Pool 200226.9 17.06 0.63132.95 4.31 17.5 0.19 65.3 0.33
EEX 2001 24.5 25.58 1.04 900.00 0.01 19.7 0.55 33.7 1.44
2001 24.1 24.68 1.03 997.98 0.03 20.0 0.62 31.3 1.47 LPX 2002 22.6 15.93 0.71 500.01 0.00 23.1 1.01 28.3 1.45
200133.5 56.31 1.681600.00 0.01 37.9 2.09 34.0 1.70 APX 200230.1 41.50 1.38701.00 0.01 33.0 1.85 37.4 1.53
200141.3 39.97 0.97961.98 0.00 51.1 1.42 25.5 0.36 PJM Eastern Hub 200231.7 21.81 0.69255.55 0.00 41.6 0.84 39.6 0.53
200134.7 31.34 0.90785.82 0.00 42.0 1.32 23.7 0.31
PJM Western Hub 200228.9 16.01 0.55222.32 0.00 34.4 0.70 40.2 0.49
200134.5 31.29 0.91785.82 0.00 41.6 1.33 23.7 0.31
PJM West Int Hub 200226.5 13.14 0.50145.21 0.00 30.6 0.60 36.4 0.54
199913.8 17.03 1.242005.52 -1.91 17.8 1.74 19.3 3.58 200022.5 58.23 2.592567.56 1.35 33.2 1.98 24.0 3.67 200118.8 50.24 2.672932.90 2.74 18.4 2.31 16.6 1.73 NEMMCO (New South Wales) 200223.0 106.11 4.614546.16 2.43 29.6 4.57 20.0 4.13
199924.6 81.35 3.302724.35 -7.75 19.8 1.60 36.7 4.74
200031.8 105.94 3.333286.23 -52.71 34.8 2.49 27.4 2.09
200119.7 38.41 1.951963.48 -12.37 17.6 0.38 19.0 2.10
NEMMCO (Queensland) 200227.5 135.02 4.914553.15 3.14 35.4 4.99 27.9 5.45
199933.0 112.13 3.403155.97 1.57 32.0 1.25 43.0 5.17
200035.9 131.60 3.663273.75 1.10 41.3 1.70 44.0 4.02
200123.3 87.99 3.782610.61 2.28 17.4 0.47 15.5 0.74
NEMMCO (South Australia) 200220.4 65.18 3.192669.41 -137.63 25.7 3.23 16.7 2.00
199913.7 15.92 1.161906.09 -1.94 17.7 1.66 19.3 3.66
200022.6 58.27 2.582642.78 1.32 33.7 1.98 22.3 2.77
200118.2 37.51 2.062267.03 2.71 17.8 1.97 16.3 1.60
NEMMCO (Snowy) 200220.5 71.24 3.472981.08 2.32 25.4 3.54 16.2 1.96
199913.7 23.25 1.702082.71 -1.91 16.9 0.47 15.9 0.71
200024.1 83.12 3.463052.50 -191.62 36.2 2.01 30.2 4.27
200119.9 67.97 3.422282.25 2.13 16.9 2.03 15.8 1.72
NEMMCO (Victoria) 200219.2 67.58 3.522940.60 -127.27 24.3 3.65 13.7 1.37
T ABLE IV shows that OMEL and PJM maximum SP related to average SP within each
year are generally lower than in the other thermal-based systems. In 2001 and 2002,
NEMMCO, a largely thermal system with no capacity payments, was the more volatile
market looking at the coefficient σSP /M SP .
Nord Pool presents small values of SP MAX relative to those observed in most thermal systems and a low yearly volatility in terms of the coefficient σSP/M SP. Nord Pool generation mix can explain some of the average price variation both from year to year and between seasons: SP in hydro systems is generally lower in summer (high water inflow due to snow melting and rainfall) than in winter7 (low water inflow due to freezing and snowfall). Thus, yearly price variations are related to wet or dry years.
To study price volatility, SP data in each market have been grouped by periods (years, summers, winters, months, weeks and days) over the years in T ABLE IV, and average value of the coefficient σSP/M SP has been calculated. This allows price volatility to be explored over a given time horizon. The results are definite: (1) Nord Pool, an hydraulic based system, is the less volatile market within the year; (2) yearly volatility in Nord Pool is comparable to that in OMEL, and both values are lower than in any other markets of the study; and (3), APX and NEMMCO, both large thermal systems with no capacity payments are the most volatile ones over all time horizons.
5. Conclusions
Transition from the monopoly model to different competitive electricity market models
has been analysed as well as the impact of market structure on price behaviour of some relevant wholesale electricity markets. For the markets analysed, price volatility in hydro systems is lower than in thermal ones, over all time horizons within the year. Moreover, capacity payments in thermal systems really diminish price soars and volatility. Acknowledgments
This work has been largely financed by OMEL.
References
[1] J.C. Fernández. “Análisis y evaluación de mercados eléctricos liberalizados a escala
internacional”. Master Thesis. Master en Gestión Técnica y Económica en el Sector
Eléctrico, Universidad Pontificia Comillas, Madrid, Spain. September 2002 (in Spanish).
[2] “Competition in Electricity Markets” International Energy Agency. OECD/IEA 2001.
[3] “Electricity market reform. An IEA handbook”, International Energy Agency, 1999.
[4] S. Hunt and G. Shuttleworth, “Unlocking the grid”, IEEE Spectrum, pp 20-25, July 1996.
[5] C. Vázquez, M. Rivier, I.J. Pérez-Arriaga, “Revisión de modelos de casación de ofertas
para mercados eléctricos”, 6as Jornadas Luso Espa?olas de Ingeniería Eléctrica. Vol. 3, p.
47. Lisboa, Portugal. July 1999, (in Spanish).
“UCTE Power Balance. Retrospect 2001”, available at [6]
https://www.360docs.net/doc/1f14198177.html,/statistics/production/e_default.asp, May 2002.
[7] “Annual report on operations 2000”, PJM INTERCONNECTION, L.L.C. Available at
https://www.360docs.net/doc/1f14198177.html,
[8] “Electricity sector deregulation in the APEC region”, Asia Pacific Energy Research
Centre, March 2001.
[9] NORDEL website. (https://www.360docs.net/doc/1f14198177.html,).
[10] F. A. Wolak, “Market design and price behaviour in restructured electricity markets: an
international comparison”, Program on Workable Energy Regulation (POWER),
University of California Energy Institute, August 1997.
7 Nord Pool SP in winter 2001 is an exception to this rule since winter 1996.