CFD simulation and validation of urban microclimate A case study for Bergpolder Zuid, Rotterdam
CFD simulation and validation of urban microclimate:A case study for Bergpolder Zuid,Rotterdam
Y.Toparlar a ,b ,*,B.Blocken a ,c ,P.Vos b ,G.J.F.van Heijst d ,W.D.Janssen a ,T.van Hooff a ,H.Montazeri a ,H.J.P.Timmermans e
a
Building Physics and Services,Department of the Built Environment,Eindhoven University of Technology,Eindhoven,The Netherlands b
Environmental Modeling,Flemish Institute for Technological Research,Mol,Belgium c
Building Physics Section,Department of Civil Engineering,Leuven University,Heverlee,Belgium d
Fluid Dynamics Laboratory,Department of Applied Physics,Eindhoven University of Technology,Eindhoven,The Netherlands e
Urban Science and Systems,Department of the Built Environment,Eindhoven University of Technology,Eindhoven,The Netherlands
a r t i c l e i n f o
Article history:
Received 16April 2014Received in revised form 16July 2014
Accepted 8August 2014
Available online 19August 2014Keywords:
Urban environment Climate adaptation Building aerodynamics
Heat stress and thermal comfort Built environment Urban physics
a b s t r a c t
Considering climate change and the rapid trend towards urbanization,the analysis of urban microclimate is gaining importance.
The Urban Heat Island (UHI)effect and summer-time heat waves can signi ?cantly affect urban microclimate with negative consequences for human mortality and morbidity and building energy demand.So far,most studies on urban microclimate employed observational approaches with ?eld measurements.However,in order to provide more information towards the design of climate adaptive urban areas,deterministic analyses are required.In this study,Computational Fluid Dynamics (CFD)simulations are performed to predict urban temperatures in the Bergpolder Zuid region in Rot-terdam,which is planned to be renovated to increase its climate resilience.3D unsteady Reynolds-averaged Navier e Stokes (URANS)simulations with the realizable k e εturbulence model are performed on a high-resolution computational grid.The simulations include wind ?ow and heat transfer by con-duction,convection and radiation.The resulting surface temperatures are validated using experimental data from high-resolution thermal infrared satellite imagery performed during the heat wave of July 2006.The results show that the CFD simulations are able to predict urban surface temperatures with an average deviation of 7.9%from the experimental data.It is concluded that CFD has the potential of accurately predicting urban microclimate.Results from CFD simulations can therefore be used to identify problem areas and to evaluate the effect of climate adaptation measures in these areas such as urban greening and evaporative cooling.
?2014Elsevier Ltd.All rights reserved.
1.Introduction
The adverse effect of high temperatures on human morbidity and mortality and energy use in buildings has been investigated in various studies about climate change [1e 3]and heat waves [4e 6].Because of the Urban Heat Island (UHI)effect,the negative conse-quences of high temperatures are even more severe inside urban areas [7e 11].The UHI refers to the fact that temperatures in urban areas are generally higher than the surrounding rural areas,because urban areas retain and release more heat to their local
environment.In view of the rapid trend towards urbanization [12,13],the design of sustainable and comfortable urban spaces and buildings becomes increasingly important [14].In this perspective,the study of urban microclimate is a key element during the design stages of urban settlements,whether it concerns a new project or a redevelopment project [15,16].
Although there are several subtopics which can be a part of urban microclimate research (e.g.wind ?ow,water balance,energy exchange),the urban temperature ?eld and consequently the UHI effect constitute some of the most common subjects covered [17].According to the review paper by Mirzaei and Haghighat [18],techniques to study the urban heat island effect can be divided into two groups.One is termed “observational approaches ”which can be ?eld measurements,thermal remote sensing or small-scale modeling (models built for wind-tunnel tests or for measure-ments in the outdoor environment).The other group is called
*Corresponding author.Building Physics and Services,Eindhoven University of Technology,P.O.box 513,5600MB,Eindhoven,The Netherlands.Tel.:t310402478444;fax:t310402438595.
E-mail address:y.toparlar@tue.nl (Y.Toparlar).Contents lists available at ScienceDirect
Building and Environment
journal homepage:www.elsev https://www.360docs.net/doc/1d17075260.html,/locat e/buildenv
https://www.360docs.net/doc/1d17075260.html,/10.1016/j.buildenv.2014.08.0040360-1323/?2014Elsevier Ltd.All rights reserved.
Building and Environment 83(2015)79e 90
“simulation approaches ”which can be either energy balance models or numerical studies using Computational Fluid Dynamics (CFD).The main advantage of simulation studies compared to observational studies is the possibility to perform comparative analyses based on different scenarios.Moreover,as opposed to observational studies,simulations can provide results for any relevant variable in the whole computational domain.On the other hand,the main drawback of simulation approaches is the necessity to apply several simpli ?cations,as the physics underlying the urban microclimate is very complex.Therefore,careful validation of the simulations is very important.
Among the simulation approaches,the energy balance model [19],which is based on energy conservation for a control volume,is extensively used in the UHI research.A range of studies investi-gated the parameterization [20e 23]and the implementation of this model for various urban regions [24e 27].The main weakness of this model is the absence of the velocity ?eld [18]which implies the decoupling of temperature and wind ?ow.Lower wind veloc-ities inside street canyons and courtyards cause a decrease in heat transferred out of the local environment,which substantially af-fects the UHI effect [28].Therefore,the absence of the velocity ?eld is a serious limitation in urban microclimate research conducted with energy balance models.In that sense,CFD can be a useful tool for coupling temperature and velocity ?elds,but it requires high-resolution modeling of urban areas,the knowledge of relevant boundary conditions and suf ?cient computational resources for the simulations [29,30].As the use of CFD in urban physics continues to gain popularity,several guidelines [31e 36]have been published to improve the quality of the simulations and to limit numerical and physical modeling errors.
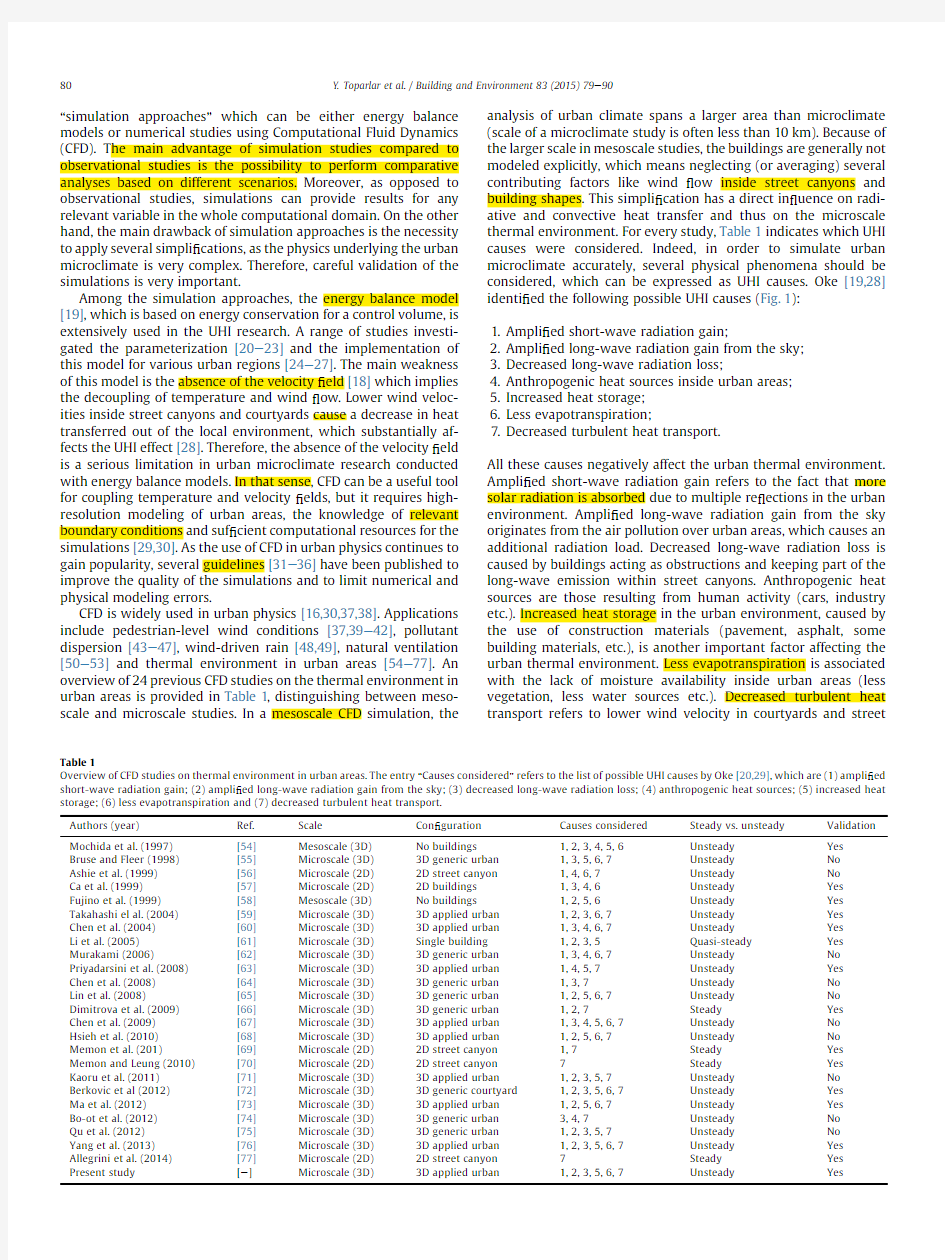
CFD is widely used in urban physics [16,30,37,38].Applications include pedestrian-level wind conditions [37,39e 42],pollutant dispersion [43e 47],wind-driven rain [48,49],natural ventilation [50e 53]and thermal environment in urban areas [54e 77].An overview of 24previous CFD studies on the thermal environment in urban areas is provided in Table 1,distinguishing between meso-scale and microscale studies.In a mesoscale CFD simulation,the
analysis of urban climate spans a larger area than microclimate (scale of a microclimate study is often less than 10km).Because of the larger scale in mesoscale studies,the buildings are generally not modeled explicitly,which means neglecting (or averaging)several contributing factors like wind ?ow inside street canyons and building shapes.This simpli ?cation has a direct in ?uence on radi-ative and convective heat transfer and thus on the microscale thermal environment.For every study,Table 1indicates which UHI causes were considered.Indeed,in order to simulate urban microclimate accurately,several physical phenomena should be considered,which can be expressed as UHI causes.Oke [19,28]identi ?ed the following possible UHI causes (Fig.1):1.Ampli ?ed short-wave radiation gain;
2.Ampli ?ed long-wave radiation gain from the sky;
3.Decreased long-wave radiation loss;
4.Anthropogenic heat sources inside urban areas;
5.Increased heat storage;
6.Less evapotranspiration;
7.
Decreased turbulent heat transport.
All these causes negatively affect the urban thermal environment.Ampli ?ed short-wave radiation gain refers to the fact that more solar radiation is absorbed due to multiple re ?ections in the urban environment.Ampli ?ed long-wave radiation gain from the sky originates from the air pollution over urban areas,which causes an additional radiation load.Decreased long-wave radiation loss is caused by buildings acting as obstructions and keeping part of the long-wave emission within street canyons.Anthropogenic heat sources are those resulting from human activity (cars,industry etc.).Increased heat storage in the urban environment,caused by the use of construction materials (pavement,asphalt,some building materials,etc.),is another important factor affecting the urban thermal environment.Less evapotranspiration is associated with the lack of moisture availability inside urban areas (less vegetation,less water sources etc.).Decreased turbulent heat transport refers to lower wind velocity in courtyards and street
Table 1
Overview of CFD studies on thermal environment in urban areas.The entry “Causes considered ”refers to the list of possible UHI causes by Oke [20,29],which are (1)ampli ?ed short-wave radiation gain;(2)ampli ?ed long-wave radiation gain from the sky;(3)decreased long-wave radiation loss;(4)anthropogenic heat sources;(5)increased heat storage;(6)less evapotranspiration and (7)decreased turbulent heat transport.Authors (year)
Ref.Scale
Con ?guration Causes considered Steady vs.unsteady Validation Mochida et al.(1997)[54]Mesoscale (3D)No buildings
1,2,3,4,5,6Unsteady Yes Bruse and Fleer (1998)[55]Microscale (3D)3D generic urban 1,3,5,6,7
Unsteady No Ashie et al.(1999)[56]Microscale (2D)2D street canyon 1,4,6,7Unsteady No Ca et al.(1999)[57]Microscale (2D)2D buildings 1,3,4,6Unsteady Yes Fujino et al.(1999)[58]Mesoscale (3D)No buildings
1,2,5,6Unsteady Yes Takahashi el al.(2004)[59]Microscale (3D)3D applied urban 1,2,3,6,7Unsteady Yes Chen et al.(2004)[60]Microscale (3D)3D applied urban 1,3,4,6,7Unsteady Yes Li et al.(2005)[61]Microscale (3D)Single building 1,2,3,5Quasi-steady Yes Murakami (2006)
[62]Microscale (3D)3D generic urban 1,3,4,6,7
Unsteady No Priyadarsini et al.(2008)[63]Microscale (3D)3D applied urban 1,4,5,7Unsteady Yes Chen et al.(2008)[64]Microscale (3D)3D generic urban 1,3,7Unsteady No Lin et al.(2008)
[65]Microscale (3D)3D generic urban 1,2,5,6,7Unsteady No Dimitrova et al.(2009)[66]Microscale (3D)3D generic urban 1,2,7Steady Yes Chen et al.(2009)[67]Microscale (3D)3D applied urban 1,3,4,5,6,7Unsteady No Hsieh et al.(2010)[68]Microscale (3D)3D applied urban 1,2,5,6,7
Unsteady No Memon et al.(201)
[69]Microscale (2D)2D street canyon 1,7Steady Yes Memon and Leung (2010)[70]Microscale (2D)2D street canyon 7Steady Yes Kaoru et al.(2011)[71]Microscale (3D)3D applied urban 1,2,3,5,7Unsteady No Berkovic et al (2012)[72]Microscale (3D)3D generic courtyard 1,2,3,5,6,7Unsteady Yes Ma et al.(2012)[73]Microscale (3D)3D applied urban 1,2,5,6,7Unsteady Yes Bo-ot et al.(2012)[74]Microscale (3D)3D generic urban 3,4,7Unsteady No Qu et al.(2012)[75]Microscale (3D)3D generic urban 1,2,3,5,7Unsteady No Yang et al.(2013)[76]Microscale (3D)3D applied urban 1,2,3,
5,6,7
Unsteady Yes Allegrini et al.(2014)[77]Microscale (2D)2D street canyon 7Steady Yes Present study
[e ]
Microscale (3D)
3D applied urban
1,2,3,5,6,7
Unsteady
Yes
Y.Toparlar et al./Building and Environment 83(2015)79e 90
80
canyons and to the resulting decreased convective heat transfer and urban ventilation.
Table 1also indicates the scales of the studies,which type of buildings or urban con ?gurations were considered,whether the simulations were steady or unsteady and whether a validation
study was conducted.CFD can potentially provide accurate infor-mation on urban wind ?ow and heat transfer.If it would be shown that accurate results can be obtained for complex case studies,such simulations could be used to analyze urban thermal environment and to evaluate the effectiveness of adaptation measures in real urban areas.To judge whether a proposed CFD approach is capable of performing a complex analysis of urban microclimate,the study should be conducted at the microscale with a real (applied)urban case with buildings.To model the urban thermal environment correctly,the simulations should consider most of the “possible causes ”and should follow an unsteady approach.Finally,to in-crease the reliability of a CFD approach,validation of the simulation results is required.
According to Table 1,the number of publications about the CFD analysis of urban thermal environment has increased over the years.Considering the scales investigated,only a few of the mentioned studies are conducted at the mesoscale [54,58].Studies at the microscale with 2D computational domains [56,57,69,70]are common but mostly conducted to investigate several funda-mental parameters about the ?ow ?eld or the temperature ?eld.Among the remaining studies (microscale 3D),only a few of them have considered an applied urban case and supported the results with a validation study [59,60,63,73,76].The study by Yang et al.[76]contains the most complex simulation setup when the number of physical models is considered.Although that study has been performed at a real urban area (Guangzhou),the main investigation was the thermal behavior of different ground sur-faces.In the computational domain of Yang et al.[76],only a few buildings were present and the area of interest was not a dense urban environment.Therefore it is necessary to conduct a study which is as comprehensive as the one by Yang et al.[76],but focused on a real and complex urban setting.This is the focus of the present paper.
This study is a 3D microscale study in which the buildings are modeled explicitly and based on a real urban area (3D applied ur-ban con ?guration).Among the possible UHI causes suggested by Oke [19,28],only the effect of anthropogenic heat sources is neglected.The simulations consider wind ?ow and heat transfer (conduction,convection,radiation).They are conducted using the
3D unsteady Reynolds Averaged Navier e Stokes (URANS)equations with the realizable k e εturbulence model [78]on a high-resolution and high-quality computational grid.Validation is conducted for the surface temperatures during the 2006heat wave,which were measured using satellite imagery and reported by Klok et al.[79].After the validation study,the urban microclimate of Bergpolder Zuid is analyzed and the effect of wind velocity on the temperature ?eld is shown.
In Section 2,the problem statement and the urban area are brie ?y described.In Section 3,the urban geometry,the compu-tational domain,the grid and other computational settings and parameters are outlined.Section 4presents the CFD validation for the surface temperatures.In Section 5,air temperatures in-side the urban area are evaluated for an entire day.Finally,the paper concludes with Section 6(discussion)and Section 7(conclusion).
2.Problem statement and urban area 2.1.Problem statement
Several research organizations and consortia have initiated programs and projects on climate change adaptation in cities as the Intergovernmental Panel on Climate Change (IPCC)has continued to express the importance of adaptation measures [80].Climate Proof Cities (CPC)is a consortium of universities,research in-stitutes,policy makers and city of ?cials that aims at performing basic and applied research on climate adaptation of urban areas [81].It includes case studies for several locations in the Netherlands.One of these locations is the Bergpolder Zuid region in Rotterdam,located in the Noord district of the city (Fig.2a).The region is planned to be renovated and the CPC consortium evalu-ates several climate change adaptation measures for potential implementation in this region.Because of the densely built envi-ronment of Rotterdam,basic symptoms of the UHI effect are pre-sent,as demonstrated in earlier studies [79,82].According to Klok et al.[79],average surface temperatures inside Rotterdam can reach up to 45 C during heat waves,which is clearly undesirable.Moreover,according to the same study,the maximum average surface temperature differences between the warmest and the coolest districts of Rotterdam were 12 C during day and 9 C during nighttime.
As mentioned earlier,the numerical analysis of urban microcli-mate is important during the design stages of an urban
Fig.1.Representation of the possible causes of the UHI effect.
Y.Toparlar et al./Building and Environment 83(2015)79e 9081
redevelopment project.The aim of the present study is to analyze the accuracy and suitability of CFD for this type of application and to gain more insight in the temperature distribution inside the Bergpolder Zuid region under the meteorological conditions of a heat wave.
2.2.Urban area and surroundings
The Bergpolder Zuid region is composed of both residential and of ?ce buildings with several narrow streets and surrounded by large avenues (Fig.2).Here,the classi ?cation of streets is made with respect to the aspect ratio between the street width and the adja-cent building height.In general,most of the streets are narrow with an aspect ratio between 1:1and 2:1.
The main color of the building walls is red and the rooftops are commonly grey or dark grey.Street materials generally have lighter colors (light grey)compared to the building materials.The vege-tation levels of the region are fairly low as trees and green ?elds are mostly located in a few small courtyards.The only urban water source is the canal located in the north of the region and there are no additional water facilities within the neighborhood,meaning the region has low evapotranspiration levels,which is typical of dense metropolitan cities.
In order to create an accurate geometrical model of the region,of ?cial drawings and documents were acquired from the Munici-pality of Rotterdam and from the database of AHN.1According to the database,the average height of buildings is 12.6m with the lowest building having a height of 2.8m and the highest building of 51.0m.
Considering the surroundings of the Bergpolder Zuid region,to the south lays the central district of Rotterdam and to the north,mainly green ?elds are found until the city of Delft (located in the northwest).Based on the updated Davenport roughness classi ?-cation [83],the aerodynamic roughness length (z 0)of the sur-roundings,which is necessary as input for the CFD simulations,is determined as shown in Fig.3.The z 0value is determined as a spatial average of the z 0values of the different patches of roughness (land use)of the terrain within a 10km radius upstream of the urban area.A similar methodology was followed in previous CFD studies investigating urban wind ?ow [36,42].
3.CFD simulations:computational settings and parameters https://www.360docs.net/doc/1d17075260.html,putational domain and grid
The computational domain used in this study is hexagonal and contains a circular subdomain that includes the buildings (Figs.3and 4).The edges of the hexagon are 1200m,yielding an area with a maximum distance of 2400m.The hexagonal domain sur-rounds the circular subdomain,which has a diameter of 1200m (Fig.4).The buildings inside the circular subdomain are modeled explicitly (i.e.with their main shape and dimensions)and divided into three categories:(1)buildings in Bergpolder Zuid;(2)buildings in the rest of the Bergpolder region;and (3)the surrounding buildings.The buildings inside Bergpolder Zuid are modeled with high resolution,down to details of 0.5m.Buildings in the rest of the Bergpolder region are modeled more coarsely with details of 1.0m.As suggested by the CFD best practice guidelines [33,35],at least one additional street block around the area of interest (in this case,Bergpolder Zuid)should also be modeled.These surrounding buildings should be placed only to act as obstacles for the approaching wind ?ow.They are modeled coarsely with details of 4.0m e 8.0m.Remaining elements like trees,street poles,cars are not modeled,and this issue is referred to in the discussion section.Outside the circular subdomain,buildings and other urban forms (such as streets,parks,roads)are not modeled explicitly but rather they are represented by using appropriate roughness
Fig.2.(a)Location of Bergpolder inside the city of Rotterdam (modi ?ed from Wiki-pedia.Source:https://www.360docs.net/doc/1d17075260.html,/wiki/File:Rotterdamse_wijken-bergpolder.PNG ).(b)Top view with the borders of Bergpolder and Bergpolder Zuid (modi ?ed from Google Maps.Source:http://goo.gl/maps/zEziy ).(c)Aerial view of Bergpolder Zuid (view from south)(modi ?ed from Google Maps.Source:http://goo.gl/maps/X8Rj2).
1
AHN:Actueel Hoogtebestand Nederland (Updated Height data of the Netherlands)http://www.ahn.nl/.
Y.Toparlar et al./Building and Environment 83(2015)79e 90
82
parameters in the
wall functions.The equivalent sand-grain roughness height (k S )and roughness constant (C S )are deter-mined considering their relationship with the aerodynamic roughness length [34]at the bottom of the domain.The height of the domain is 400m (see Fig.4).The maximum blockage ratio is 1.8%,which is less than the recommended value of 3%[33,35].
Generation of the computational grid is based on the same methodology as introduced by van Hooff &Blocken [36],which starts by meshing the ground plane followed by the extrusion of the ground surface grid along a third axis for obtaining the three-dimensional grid.The grid is ?ner in the area of interest (Berg-polder Zuid)but as the distance from the target area increases,the grid becomes coarser.Special attention is given to the guidelines of Franke et al.[33]and Tominaga et al.[35]by using at least ten cells on the building edges and by keeping the grid stretching ratio below 1.3.This results in a grid with 6,610,456hexahedral cells (see Fig.5).
3.2.Boundary conditions
A ?ow boundary condition either as velocity inlet or pressure outlet is imposed on each outer face of the hexagonal domain,depending on the wind direction simulated.In every simulation,three of these boundaries are speci ?ed as velocity inlets and the remaining three as outlets.Meteorological data used in this study are obtained from the Royal Dutch Meteorological Institute (KNMI)by the Rotterdam weather station,which is located near Rotterdam airport approximately 4km northwest of Bergpolder Zuid (Fig.3).
At the inlets,a logarithmic mean wind speed pro ?le (U)(m/s)(Eq.(1))is imposed with z 0?0.5m or z 0?1.0m,depending on the wind direction (Fig.3).The reference wind speed depends on the hourly meteorological data and varies between 1m/s and 6m/s at 10m height (U 10).
U ez T?u *k ln z tz 0
z 0
(1)
Fig.3.Terrain surrounding the modeled urban area with a radius of 10km.The estimated aerodynamic roughness length (z 0)is shown for different angles.The computational domain used in this study is represented by the black hexagon in the middle.
https://www.360docs.net/doc/1d17075260.html,putational domain.Different colors represent different categories of buildings in terms of detail in modeling.(For interpretation of the references to colour in this ?gure
legend,the reader is referred to the web version of this article.)
Y.Toparlar et al./Building and Environment 83(2015)79e 9083
Turbulent kinetic energy (k )(m 2/s 2)and turbulence dissipation rate (ε)(m 2/s 3)are given by Richards and Hoxey [84]:
k ?u *2??????
C m p (2)
εez T?
u *3k ez tz 0T
(3)
In these equations,k is the von Karman constant (?0.41),u *(m/s)is the atmospheric boundary layer friction velocity,C m is a constant (?0.09),z 0(m)is the aerodynamic roughness length and z (m)is the height coordinate.At the inlet,a spatially constant air tem-perature is imposed and its value and time dependency is given by
the hourly weather data.
At the walls,the standard wall functions [85]are used in com-bination with the sand-grain based roughness modi ?cation [86]and the parameters k S (roughness height)and C S (roughness con-stant)are determined from their appropriate relationship with z 0.The relationship between these parameters depends on the CFD software used.In this study,the commercial CFD software ANSYS Fluent 12is used and for this software,the relationship is given by Blocken et al.[34]:
k S ?
9:793z 0
C S
(4)
Appropriate and consistent roughness parameters should be speci ?ed to obtain a horizontally homogeneous atmospheric boundary layer in the upstream part of the computational domain [34,84].Horizontal homogeneity implies the absence of stream-wise gradients in the vertical pro ?les of the mean wind velocity and turbulence quantities.The ANSYS Fluent software does not allow any k S value higher than z p ,which is the distance between the center point of the wall-adjacent cell to the wall.Therefore,C S values are increased instead.In combination with Eq.(4),this yields:for the hexagonal domain,k S ?1.39m and C S ?3.5(for z 0?0.5m)and k S ?1.39m and C S ?7(for z 0?1.0m).Inside the circular domain,the ground plane is modeled as z 0?0m.
Apart from the standard wall functions,the near-wall region could be resolved with low-Re number modeling,which would mean placing control volumes in every part of the often very thin boundary layer near the wall surface (namely thin viscous sub-layer,the buffer layer and the logarithmic layer).However,this modeling approach would require an excessively high grid reso-lution,which would very strongly increase the computational load [87].Although it is stated in various studies that the wall functions might not perform well for the calculation of convective heat transfer [88],this method is still widely used to calculate convective heat transfer implicitly at the surface [87].
The ground plane of the computational domain is modeled implicitly as a 10m thick earth layer with a constant temperature of 10 C at 10m below ground.The internal air inside the build-ings is assumed to be at 24 C and building walls are composed of brick materials with 0.4m thickness.Material speci ?cations of earth and brick (for building walls and roofs)as used in this study can be found in Table 2.The absorptivity and emissivity of the materials provided in Table 2have the same values for both shortwave and longwave radiation.Considering the fact that the windows are not modeled in the simulations,no transmissivity is considered for the building surfaces.Therefore the shortwave re ?ectivity or albedo value is (1e absorptivity).Here,it should be noted that the material speci ?cations of earth resemble a generic earth material for density,speci ?c heat and thermal conductivity but for re ?ective properties like solar absorptivity and emissivity,speci ?cations are based on light colored concrete.The reason for this choice is to resemble the top of the 10m thick ground plane as light colored concrete,which is the dominant road pavement material in Bergpolder Zuid.
The top of the computational domain is modeled as a free-slip wall,which assumes zero normal gradients for all the variables.At the outlets,zero static pressure is imposed.
Total solar radiation is also acquired from the hourly weather data (to be shown in Section 4).In this study,the effect of anthropogenic heat sources is omitted.As for evapotranspiration in daytime,during morning (6:00e 11:00h)and afternoon (15:00e 18:00h)a constant sink value of 80W/m 2is implemented and during noontime,the sink value is 130W/m.2The sink value of evapotranspiration is only applied for the ground plane and not on building surfaces.This assumption is in accordance with the ob-servations from previous measurement studies [20,27,89]consid-ering heat ?uxes inside dense urban areas.
Fig.5.a)Aerial view of the Bergpolder region from south (modi ?ed from Bing maps.Source:http://binged.it/17VliGv );b)Corresponding computational geometry;c)Computational grid on the building surfaces and on part of the ground surface.The intensity of black lines indicates areas with a higher mesh resolution (6,610,456cells).
Table 2
Speci ?cations of the materials used in this study.Material
Density (kg/m 3)Speci ?c heat (J/kgK)Thermal conductivity (W/mK)Absorptivity
Emissivity
Earth 1150650 1.50.600.90Brick 1400
900
1.7
0.750.88
Y.Toparlar et al./Building and Environment 83(2015)79e 90
84
3.3.Other computational parameters
The3D URANS equations are solved with the realizable k eεturbulence model[78]for closure.For the radiation equations,the P-1radiation model is used[90]and the Boussinesq approximation is used for buoyancy.For the ground and building walls,a one-directional conduction equation,which calculates heat transfer between two sides of the walls,is applied.Ideally,a three-dimensional approach can be followed to consider heat transfer within the planar directions of the walls,which is an issue that will be discussed later in this paper.Parameters such as sun direction vector and the diffuse portion of the total radiation coming to the surface are calculated with the implemented solar calculator of ANSYS Fluent[90].The solar calculator considers a beam using the position of the sun at any time during a year and applies radiative heat?ux on all of the wall type boundaries.The absorption of the radiative heat by the surfaces depends on the absorptivity values shown in Table2.Heat storage by the solid regions is calculated based on the thermal diffusivity(m2/s)of the respective materials.
Pressure-velocity coupling is handled with the SIMPLE algo-rithm and pressure interpolation is second order.Second order discretization schemes are used for all the convection and viscous terms.Second order implicit time integration is used for temporal discretization.Unsteady simulations are performed with15-min (900s)time steps,and each time step was calculated with60it-erations,based on a time-step sensitivity analysis.The scaled re-siduals at the end of each time step reached the following minimum values:10à4e10à5for x,y and z velocity,10à4for k and ε,10à7for energy and radiation,10à3e10à4for continuity.All
simulations are performed considering?ve consecutive days (120h),which corresponds to a total of480time steps.With this approach,it is possible to evaluate the diurnal variation of the temperature?eld.
4.CFD simulations:results and validation
Klok et al.[79]investigated the UHI effect in Rotterdam based on surface temperatures obtained from the thermal images acquired during the July2006heat wave by the NOAA-AVHHR2satellite. AVHRR has a high temporal resolution(able to monitor diurnal behavior of surface temperatures)and medium spatial resolution of 1.1km.The satellite imagery data reported by Klok et al.[79]are for 15,16,17,18and19July,2006.Meteorological data for these days are depicted in Fig.6.The wind direction on15,16,17and19July is mainly from north,northeast and east whereas on18July some southeast wind was also observed.
The surface temperatures reported by Klok et al.[79]are aver-aged over each district and do not consider any maximum or minimum values.There is only a single value reported per district. The data of spatially averaged values do not have any additional information about standard deviation and therefore,minimum or maximum surface temperature values cannot be compared in this validation study.Therefore,the comparison between the satellite imagery data and CFD simulation results is only performed for the spatially averaged values.
To extract spatially averaged values from the CFD simulations, several sampling points located on a grid were placed over Berg-polder Zuid.The number of sampling points was based on a sensitivity analysis for a given moment in time.The sensitivity analysis is based on the percentage deviation of average surface temperatures(CFD versus measurements)for12:10h on15July 2006,when the measured average surface temperature in the Noord district was around30.5 C.The result of the sensitivity analysis is provided in Fig.7.Following the sensitivity analysis,90 sampling points are placed on the building roofs and street surfaces of the computational domain of Bergpolder Zuid(see Fig.8).The simulation results of average surface temperatures are the averages over these90points.
Although simulations are performed for?ve complete and consecutive days(120h),Klok et al.[79]have reported average surface temperatures for42speci?c times within these?ve days. At these speci?c times,the reported average surface tempera-tures are only momentary,which means meteorological condi-tions at that moment are likely to be different from hourly averaged meteorological data.Nevertheless,the CFD simulations have been performed with boundary conditions that are updated every hour based on the hourly averaged meteorological data. The CFD simulation results are compared with the experimental data in Fig.9.
In general,a fair to good agreement is observed,especially in terms of diurnal variation.The minimum,average and maximum deviations of surface temperature are0.27%(19th of July,18:38h), 7.9%and24.2%(16th of July,8:13h),respectively.The surface temperature amplitude is smaller in satellite imagery data than in the simulations.Deviations are especially present during the noontime of18th of July.
Different reasons can be held responsible for the deviations between the CFD simulations and the reported data from the sat-ellite images:
1.The one-directional wall conduction approach used at the wall
boundaries.In reality,some of the heat is transferred in the planar directions of the ground,building walls and roofs(for instance in between warm regions and shaded areas),which increases the thermal inertia of the respective solid zone.
However,with the imposed one-directional wall conduction, the effect of planar conduction is omitted and thus,the ground level is more prone to sudden changes in temperature,which might explain the difference in daily surface temperature variance.
2.The effect of relative humidity.In these?ve days,relative
humidity is very unstable.Average daily relative humidity among these?ve days changes from49%to64%and within a single day,e.g.on18July,it can decrease from96%to32% within only7h.These sudden changes in relative humidity can in?uence the results as the humidity is not directly considered in the simulations but only indirectly as an evap-otranspirational sink.
3.The comparison of momentary experimental data with CFD
simulations based on hourly averaged meteorological data.
Especially within the days where the hourly variation of wind speed and solar radiation is high,hourly data could not be suf-?cient to produce accurate results.
4.Uncertainties in the reported satellite imagery data.The satellite
imagery data reported by Klok et al.[79]presents a single value for a speci?c moment and for an entire district.The modeled Bergpolder Zuid region in Rotterdam constitutes only20%of the complete Noord district.Therefore local conditions in the complete district of Noord might not resemble the conditions inside Bergpolder Zuid region at all times.
5.The thermal strati?cation of the atmospheric boundary layer
(ABL).Considering the wind?ow,a neutral ABL is assumed to be present in the surface layer with constant uniform temperature.
Especially during times with low wind speed,the actual?ow ?eld in the urban environment might deviate from the simu-lated one because of this assumption.
2NOAA e AVHRR:US National Oceanic and Atmospheric Administration e
Advanced Very High Resolution Radiometer.
Y.Toparlar et al./Building and Environment83(2015)79e9085
5.Evaluation of the simulation results
One of the reasons for the UHI effect is the additional heat storage of building materials inside urban areas and its release e mainly during nighttime.In Fig.10,this mechanism is depicted using the CFD simulation results of surface temperature for 16July 2006.Although at 23:00(Fig.10d)incoming solar radiation is zero,there is still heat accumulated within the urban environment:According to the meteorological data,air temperature at that time is around 17.0 C but average surface temperatures are much higher (21.8 C).The heat,which is accumulated within the con-struction materials,is released during the nighttime,which is apparent in Fig.9.The average surface temperatures continue to decrease,as long as the air temperature is higher.The decrease continues in average surface temperatures continue until the sunrise of the next day.
Another important factor contributing to the UHI effect is the decreased turbulent heat transport inside urban regions.As
the
Fig.7.Results of the sensitivity analysis.Percentage deviation is calculated based on the satellite imagery data recorded at 12:10h on July 15,2006and on CFD simulations for the same moment in
time.
Fig.6.Meteorological data of Rotterdam (based on KNMI-Rotterdam weather station)during 15,16,17,18and 19July 2006.Acquired from the hourly dataset of KNMI for:a)air temperature;b)solar radiation;c)wind velocity.
Y.Toparlar et al./Building and Environment 83(2015)79e 90
86
wind velocity might drop signi ?cantly in the courtyards or in the streets,which are positioned perpendicular to the prevailing wind direction,the ventilative cooling effect of the wind is proportionally reduced.Moreover,in these locations,convected air close to the hot surface cannot leave the local environment,which decreases heat release from surfaces.These effects can be observed by the simu-lations performed in this study.In Fig.11,contours of wind velocity at 1m height and surface temperatures at 10:00h on 15July are provided.In the regions with low wind velocity,surface tempera-tures are noticeably higher.Therefore,the methodology used in this study can be considered as a reliable source to pinpoint critical locations with possibly higher temperatures during warm and sunny days.Further CFD research about urban microclimate can focus on topics to mitigate this negative effect,for instance by better ventilation of the streets or by creating air ?ow through courtyards.
6.Discussion
The created urban geometry in this research is based on the drawings and data from the municipality of Rotterdam.However,there are elements in reality that are not taken into account in the
model.Trees,street poles,cars,balconies,canopies and similar details that might affect the incoming solar radiation are neglected.
Due to the scale of this study and the lack of detailed informa-tion,the construction materials of the buildings and at the ground surfaces are considered to have the same properties throughout the domain.In a real urban environment,material use can be different for each building and street and this can locally in ?uence the temperature ?eld.
The vertical inlet pro ?les of mean velocity (U ),turbulent kinetic energy (k )and turbulence dissipation rate (ε)are taken from Richards &Hoxey [84].These pro ?les were derived as analytical solutions of the standard k e εturbulence model.However,they are also commonly used as inlet pro ?les with other turbulence models (e.g.Refs.[33e 35,87,91]).
The inlet pro ?les for U ,k and εused for the simulations in the present study are those for neutral strati ?cation of the atmospheric boundary layer [34,84].For the fairly low wind speed conditions in the present study,using pro ?les for unstable strati ?cation could have been better.However,these pro ?les might suffer from hori-zontal inhomogeneity (e.g.Blocken et al.[34]),and further work on consistent CFD simulation of stable and unstable atmospheric boundary layers is required.In addition,it should be noted that the area with explicitly modeled buildings (i.e.with their main
shapes
Fig.8.Location of sampling points on the building and street surfaces of Bergpolder Zuid.In total 90(10?9)data points are placed
equidistantly.
https://www.360docs.net/doc/1d17075260.html,parison of CFD simulation results and data from satellite images of average surface temperatures for ?ve consecutive days.
Y.Toparlar et al./Building and Environment 83(2015)79e 9087
and dimensions)in the present study is larger than the area of interest (Bergpolder Zuid).This way,the incident pro ?les (i.e.those to which the area of interest is subjected)are partly developed by these surroundings buildings and the surrounding ground roughness.
Concerning the validation methodology,space-averaged values for temperature were used to show that CFD can be an effective tool for the reproduction of the daily temperature variations in an urban area.However,if the focus would be on a smaller scale (i.e.building or road surface,a small street),then other,more detailed validation data with a higher spatial resolution would have been needed.With the current settings of the simulations for wind ?ow and heat transfer,the present study has demonstrated the capability and potential of CFD for predicting urban surface temperatures.
Water vapor transfer inside urban regions can also affect the temperature ?eld.Especially localized sources of evapotranspira-tion (vegetation or water facilities)can signi ?cantly affect tem-perature distribution around the regions where they are located.Note however that in Bergpolder,vegetation is very limited and water facilities are absent.In addition,the relative humidity in the air might be important for the latent heat transfer in an urban area.In this study,water vapor transfer is considered as a sink term of evapotranspiration,which is effective only during daytime (be-tween 6:00h and 18:00h),and the value for the term is based on previous theoretical and observational studies.The evapotranspi-ration sink term can be based upon one of the models developed for energy balance models [20,22]or can be solved coupled to the ?ow and temperature equations,which would require additional computational cost.7.Conclusion
Studies on urban microclimate are gaining importance given the possible negative effects of high temperatures in urban areas on human mortality and morbidity and building energy demand.So far,these studies have been based on observational approaches (e.g.?eld measurements)and simulation approaches about urban microclimate have used mostly energy balance models.For the analysis of urban microclimate,the main weakness of energy bal-ance models is that the velocity ?eld is not directly modeled.On the other hand,in CFD,velocity ?eld can be coupled with temperature ?eld.Therefore CFD has the potential to be an important tool for the deterministic analysis of urban microclimate and consequently for the analysis of adaptation measures in building and urban scale.This paper has presented unsteady CFD simulations considering wind ?ow and heat transfer (conduction,convection and radiation),investigating the Bergpolder Zuid region in Rotterdam,the Netherlands.The simulations were performed using the 3D URANS approach with the realizable k e εturbulence model on a high-resolution grid.Most of the factors affecting the urban microcli-mate (shortwave,longwave radiation,wind velocity,evapotrans-piration,and heat storage)were considered within the simulations whereas only the effect of anthropogenic heat sources was omitted.In order to validate the simulation results of surface tempera-tures inside the urban area,data obtained from satellite images is used.The images were collected during the July 2006heat wave and the results were reported by Klok et al.[79].Meteorological conditions of the days corresponding to the data from satellite images were acquired from the KNMI database.Hourly data ob-tained from the KNMI included wind speed,wind direction,air temperature and solar radiation.Simulations are performed with respect to the meteorological data of 15until 19July 2006.Simu-lation results and reported data were compared and showed fairly good accuracy with the simulation results having only an average 7.9%difference with the experimental data (minimum deviation is 0.3%and the maximum deviation is 24.2%).The presented CFD approach allows analyzing the effect of the heat storage mechanism and the wind-velocity pattern on the temperature ?eld.
It is concluded that CFD has the potential of accurately pre-dicting urban microclimate.Results from CFD simulations can therefore be used to identify problem areas and to evaluate the effect of adaptation measures such as urban greening
and
Fig.10.Contours of simulated temperatures for the Bergpolder region during 16July 2006at:a)5:00h;b)11:00h;c)17:00h;d)23:00h (view from south).
Y.Toparlar et al./Building and Environment 83(2015)79e 90
88
evaporative cooling.Further work will therefore focus on the application of the CFD URANS approach for the evaluation of climate change adaptation measures.Acknowledgments
This research was supported by the Dutch Knowledge for Climate Research Program within the theme Climate Proof Cities (CPC).References
[1]Haines A,Kovats RS,Campbell-Lendrum D,Corvalan C.Climate change and
human health:impacts,vulnerability and public health.Public Health 2006;120:585e 96.
[2]Watkiss P.Final Report.The ClimateCOST project,vol.1.Europe:Stock Envi-ron Inst;2011.
[3]Xu P,Huang YJ,Miller N,Schlegel N,Shen P.Impacts of climate change on
building heating and cooling energy patterns in California.Energy 2012;44:792e 804.
[4]Changnon SA,Kunkel EK,Reinke BC.Impacts and responses to the 1995heat
wave:a call to action.Bull Am Meteorol Soc 1996;77:1497e 506.
[5]Van Garssen J,Harmsen C,de Beer J.Effect of the summer 2003heat wave on
mortality in the Netherlands.Eurosurveillance 2005;10:165e 7.
[6]Conti S,Meli P,Minelli G,Solimini R,Toccaceli V,Vichi M,et al.Epidemiologic
study of mortality during the summer 2003heat wave in Italy.Environ Res 2005;98:390e 9.
[7]Sarrat C,Lemonsu a,Masson V,Guedalia D.Impact of urban heat island on
regional atmospheric pollution.Atmos Environ 2006;40:1743e 58.
[8]Tan J,Zheng Y,Tang X,Guo C,Li L,Song G,et al.The urban heat island and its
impact on heat waves and human health in Shanghai.Int J Biometeorol 2010;54:75e 84.
[9]Memon RA,Leung DYC,Liu C-H,Leung MKH.Urban heat island and its effect
on the cooling and heating demands in urban and suburban areas of Hong Kong.Theor Appl Climatol 2010;103:441e 50.
[10]Emmanuel R,Krüger EL.Urban heat island and its impact on climate change
resilience in a shrinking city:the case of Glasgow,UK.Build Environ 2012;53:137e 49.
[11]Kolokotroni M,Ren X,Davies M,Mavrogianni A.London's urban heat island:
impact on current and future energy consumption in of ?ce buildings.Energy Build 2012;47:302e 11.
[12]Angel S,Sheppard SC,Civco DL.The dynamics of global urban expansion.
Washington DC;2005.
[13]United Nations.World urbanization prospects:the 2011revision.New York;
2012.
[14]Smith C,Levermore G.Designing urban spaces and buildings to improve
sustainability and quality of life in a warmer world.Energy Policy 2008;36:4558e 62.
[15]Mills G.Progress toward sustainable settlements:a role for urban climatology.
Theor Appl Climatol 2005;84:69e 76.
[16]Moonen P,Defraeye T,Dorer V,Blocken B,Carmeliet J.Urban physics:effect of
the micro-climate on comfort,health and energy demand.Front Archit Res 2012;1:197e 228.
[17]Arn ?eld J.Two decades of urban climate research:a review of turbulence,
exchanges of energy and water,and the urban heat island.Int J Climatol 2003;23:1e 26.
[18]Mirzaei PA,Haghighat F.Approaches to study urban heat island e abilities and
limitations.Build Environ 2010;45:2192e 201.
[19]Oke TR.The energetic basis of the urban heat island.Q J R Meteorol Soc
1982;108:1e 24.
[20]Grimmond C,Oke T.An evapotranspiration e interception model for urban
areas.Water Resour Res 1991;27:1739e 55.
[21]Arn ?eld J,Grimmond CSB.An urban canyon energy budget model and its
application to urban storage heat ?ux modeling.Energy Build 1998;27:61e 8.[22]Masson VA.Physically-based scheme for the urban energy budget in atmo-spheric models.Boundary Layer Meteorol 2000;94:357e 97.
[23]Martilli A,Clappier A,Rotach M.An urban surface exchange parameterisation
for mesoscale models.Boundary Layer Meteorol 2002;104:261e 304.
[24]Nunez M,Oke TR.Modeling the daytime urban surface energy balance.Geogr
Anal 1980;12:373e 86.
[25]Oke TR,Zeuner G,Jauregui E.The surface energy balance in Mexico city.
Atmos Environ Part B Urban Atmos 1992;26:433e 44.
[26]Christen A,Vogt R.Energy and radiation balance of a central European city.Int
J Climatol 2004;24:1395e 421.
[27]Offerle B,Grimmond CSB,Fortuniak K,K ?ysik K,Oke TR.Temporal variations
in heat ?uxes over a central European city centre.Theor Appl Climatol 2005;84:103e 15.
[28]Oke TR.Boundary layer climates.2nd ed.London:Methuen;1987.
[29]Erell E,Pearlmutter D,Williamson T.Urban microclimate:designing the
spaces between buildings.1st ed.London:Earthscan;2011.
[30]Blocken B.50years of computational wind engineering:past,present and
future.J Wind Eng Ind Aerodyn 2014;129:69e 102.
[31]Casey M,Wintergerste T.ERCOFTAC special interest group on “quality and
trust in industrial CFD ”e best practice guidelines;2000.
[32]Jakeman AJ,Letcher RA,Norton JP.Ten iterative steps in development and
evaluation of environmental models.Environ Model Softw 2006;21:602e 14.[33]Franke J,Hellsten A,Schlünzen H,Carissimo B.Best practice guideline for the
CFD simulation of ?ows in the urban environment.Hamburg;2007.
[34]Blocken B,Stathopoulos T,Carmeliet J.CFD simulation of the atmospheric
boundary layer:wall function problems.Atmos Environ 2007;41:238e 52.[35]Tominaga Y,Mochida A,Yoshie R,Kataoka H,Nozu T,Yoshikawa M,et al.AIJ
guidelines for practical applications of CFD to pedestrian wind environment around buildings.J Wind Eng Ind Aerodyn 2008;96:1749e 61.
[36]Van Hooff T,Blocken B.Coupled urban wind ?ow and indoor natural venti-lation modelling on a high-resolution grid:a case study for the Amsterdam ArenA stadium.Environ Model Softw 2010;25:51e 65.
[37]Mochida A,Lun IYF.Prediction of wind environment and thermal comfort at
pedestrian level in urban area.J Wind Eng Ind Aerodyn 2008;96:1498e 527.[38]Blocken B,Stathopoulos T,Carmeliet J,Hensen J.Application of CFD in
building performance simulation for the outdoor environment:an overview.J Build Perform Simul 2011;4:157e 84.
[39]Murakami S,Ooka R,Mochida A,Yoshida S.CFD analysis of wind climate from
human scale to urban scale.J Wind Eng Ind Aerodyn 1999;81:57e 81.
[40]Stathopoulos T.Pedestrian level winds and outdoor human comfort.J Wind
Eng Ind Aerodyn 2006;94:769e 80.
[41]Yoshie R,Mochida A,Tominaga Y,Kataoka H,Harimoto K,Nozu T,et al.
Cooperative project for CFD prediction of pedestrian wind environment in the Architectural Institute of Japan.J Wind Eng Ind Aerodyn 2007;95:1551e 78.[42]Blocken B,Janssen WD,van Hooff T.CFD simulation for pedestrian wind
comfort and wind safety in urban areas:general decision framework and case study for the Eindhoven University campus.Environ Model Softw 2012;30:15e 34
.
Fig.11.Simulation results for:a)wind velocity (m/s)at 1m height;and b)surface temperature ( C)for July 152006,10:00h.Both views are from south.
Y.Toparlar et al./Building and Environment 83(2015)79e 9089
[43]Blocken B,Stathopoulos T,Saathoff P,Wang X.Numerical evaluation of
pollutant dispersion in the built environment:comparisons between models and experiments.J Wind Eng Ind Aerodyn2008;96:1817e31.
[44]Gousseau P,Blocken B,Stathopoulos T,van Heijst GJF.CFD simulation of near-
?eld pollutant dispersion on a high-resolution grid:a case study by LES and RANS for a building group in downtown Montreal.Atmos Environ2011;45: 428e38.
[45]Tominaga Y,Stathopoulos T.CFD simulation of near-?eld pollutant dispersion
in the urban environment:a review of current modeling techniques.Atmos Environ2013;79:716e30.
[46]Vos PEJ,Maiheu B,Vankerkom J,Janssen S.Improving local air quality in
cities:to tree or not to tree?Environ Pollut2013;183:113e22.
[47]Di Sabatino S,Buccolieri R,Salizzoni P.Recent advancements in numerical
modelling of?ow and dispersion in urban areas:a short review.Int J Environ Pollut2013;52:172e91.
[48]Choi EC.Simulation of wind-driven-rain around a building.J Wind Eng Ind
Aerodyn1993;46:721e9.
[49]Blocken B,Carmeliet J.A review of wind-driven rain research in building
science.J Wind Eng Ind Aerodyn2004;92:1079e130.
[50]Kato S,Murakami S,Mochida A,Akabayashi S,Tominaga Y.Velocity-pressure
?eld of cross ventilation with open windows analyzed by wind tunnel and numerical simulation.J Wind Eng Ind Aerodyn1992;44:2575e86.
[51]Chen Q.Ventilation performance prediction for buildings:a method overview
and recent applications.Build Environ2009;44:848e58.
[52]Ramponi R,Blocken B.CFD simulation of cross-ventilation for a generic iso-
lated building:impact of computational parameters.Build Environ2012;53: 34e48.
[53]Bjerg B,Cascone G,Lee I-B,Bartzanas T,Norton T,Hong S-W,et al.Modelling
of ammonia emissions from naturally ventilated livestock buildings.Part3: CFD modelling.Biosyst Eng2013;116:259e75.
[54]Mochida A,Murakami S,Ojima T,Kim S,Ooka R,Sugiyama H.CFD analysis of
mesoscale climate in the greater Tokyo area.J Wind Eng Ind Aerodyn1997;67 &68:459e77.
[55]Bruse M,Fleer H.Simulating surface e plant e air interactions inside urban
environments with a three dimensional numerical model.Environ Model Softw1998;13:373e84.
[56]Ashie Y,Ca VT,Asaeda T.Building canopy model for the analysis of urban
climate.J Wind Eng Ind Aerodyn1999;81:237e48.
[57]Ca VT,Asaeda T,Ashie Y.Development of a numerical model for the evalu-
ation of the urban thermal environment.J Wind Eng Ind Aerodyn1999;81: 181e96.
[58]Fujino T,Asaeda T,Thanh Ca V.Numerical analyses of urban thermal envi-
ronment in a basin climate e application of a k eεmodel to complex terrain.
J Wind Eng Ind Aerodyn1999;81:159e69.
[59]Takahashi K,Yoshida H,Tanaka Y,Aotake N,Wang F.Measurement of thermal
environment in Kyoto city and its prediction by CFD simulation.Energy Build 2004;36:771e9.
[60]Chen H,Ooka R,Harayama K,Kato S,Li X.Study on outdoor thermal envi-
ronment of apartment block in Shenzhen,China with coupled simulation of convection,radiation and conduction.Energy Build2004;36:1247e58. [61]Li X,Yu Z,Zhao B,Li Y.Numerical analysis of outdoor thermal environment
around buildings.Build Environ2005;40:853e66.
[62]Murakami S.Environmental design of outdoor climate based on CFD.Fluid
Dyn Res2006;38:108e26.
[63]Priyadarsini R,Hien WN,Wai David CK.Microclimatic modeling of the urban
thermal environment of Singapore to mitigate urban heat island.Sol Energy 2008;82:727e45.
[64]Chen H,Ooka R,Kato S.Study on optimum design method for pleasant out-
door thermal environment using genetic algorithms(GA)and coupled simulation of convection,radiation and conduction.Build Environ2008;43: 18e30.
[65]Lin B,Li X,Zhu Y,Qin Y.Numerical simulation studies of the different vege-
tation patterns'effects on outdoor pedestrian thermal comfort.J Wind Eng Ind Aerodyn2008;96:1707e18.
[66]Dimitrova R,Sini J-F,Richards K,Schatzmann M,Weeks M,Perez García E,
et al.In?uence of thermal effects on the wind?eld within the urban envi-ronment.Boundary Layer Meteorol2009;131:223e43.[67]Chen H,Ooka R,Huang H,Tsuchiya T.Study on mitigation measures for
outdoor thermal environment on present urban blocks in Tokyo using coupled simulation.Build Environ2009;44:2290e9.
[68]Hsieh C-M,Chen H,Ooka R,Yoon J,Kato S,Miisho K.Simulation analysis of
site design and layout planning to mitigate thermal environment of riverside residential development.Build Simul2010;3:51e61.
[69]Memon RA,Leung DYC,Liu C-H.Effects of building aspect ratio and wind
speed on air temperatures in urban-like street canyons.Build Environ 2010;45:176e88.
[70]Memon RA,Leung DYC.On the heating environment in street canyon.Environ
Fluid Mech2010;11:465e80.
[71]Kaoru I,Akira K,Akikazu K.The24-h unsteady analysis of air?ow and tem-
perature in a real city by high-speed radiation calculation method.Build Environ2011;46:1632e8.
[72]Berkovic S,Yezioro A,Bitan A.Study of thermal comfort in courtyards in a hot
arid climate.Sol Energy2012;86:1173e86.
[73]Ma J,Li X,Zhu Y.A simpli?ed method to predict the outdoor thermal envi-
ronment in residential district.Build Simul2012;5:157e67.
[74]Bo-ot LM,Wang Y-H,Chiang C-M,Lai C-M.Effects of a green space layout on
the outdoor thermal environment at the neighborhood level.Energies2012;5: 3723e35.
[75]Qu Y,Milliez M,Musson-Genon L,Carissimo B.Numerical study of the thermal
effects of buildings on low-speed air?ow taking into account3D atmospheric radiation in urban canopy.J Wind Eng Ind Aerodyn2012;104-106:474e83.
[76]Yang X,Zhao L,Bruse M,Meng Q.Evaluation of a microclimate model for
predicting the thermal behavior of different ground surfaces.Build Environ 2013;60:93e104.
[77]Allegrini J,Dorer V,Carmeliet J.Buoyant?ows in street canyons:validation of
CFD simulations with wind tunnel measurements.Build Environ2014;72: 63e74.
[78]Shih T-H,Liou WW,Shabbir A,Yang Z,Zhu J.A new k eεeddy viscosity model
for high reynolds number turbulent?https://www.360docs.net/doc/1d17075260.html,put Fluids1995;24:227e38.
[79]Klok L,Zwart S,Verhagen H,Mauri E.The surface heat island of Rotterdam
and its relationship with urban surface characteristics.Resour Conserv Recycl 2012;64:23e9.
[80]Parry ML,Canziani OF,Palutikof JP,van der Linden PJ,Hanson CE.Contribution
of working group II to the fourth assessment report of the intergovernmental panel on climate change,2007.Cambridge;2007.
[81]Albers RAW,Bosch PR,Blocken B,Dobbelsteen AAJF,van Hove LWA,Spit TJM,
van de Ven F,van Hooff T,Rovers V.Overview of challenges and achievements in the Climate Adaptation of Cities and in the Climate Proof Cities program.
Build Environ2015;83:1e10.
[82]Heusinkveld BG,Steeneveld GJ,van Hove LWA,Jacobs CMJ,Holtslag AAM.
Spatial variability of the Rotterdam urban heat island as in?uenced by urban land use.J Geophys Res Atmos2014;119:677e92.
[83]Wieringa J.Updating the Davenport roughness classi?cation.J Wind Eng Ind
Aerodyn1992;44:357e68.
[84]Richards P,Hoxey R.Appropriate boundary conditions for computational
wind engineering models using the k eεturbulence model.J Wind Eng Ind Aerodyn1993;46&47:145e53.
[85]Launder BE,Spalding DB.The numerical computation of turbulent?ows.
Comput Methods Appl Mech Eng1974;3:269e89.
[86]Cebeci T,Bradshaw P.Momentum transfer in boundary layers.New York:
Hemisphere Publishing Corporation;1977.
[87]Blocken B,Defraeye T,Derome D,Carmeliet J.High-resolution CFD simula-
tions for forced convective heat transfer coef?cients at the facade of a low-rise building.Build Environ2009;44:2396e412.
[88]Murakami https://www.360docs.net/doc/1d17075260.html,parison of various turbulence models applied to a bluff
body.J Wind Eng Ind Aerodyn1993;46:21e36.
[89]Grimmond C,Oke T.Turbulent heat?uxes in urban areas:observations and a
local-scale urban meteorological parameterization scheme(LUMPS).J Appl Meteorol2002:792e810.
[90]ANSYS Inc.ANSYS FLUENT12.0theory guide;2009.
[91]Allegrini J,Dorer V,Carmeliet J.Analysis of convective heat transfer at
building fa?ades in street canyons and its in?uence on the predictions of space cooling demand in buildings.J Wind Eng Ind Aerodyn2012;104-106:464e73.
Y.Toparlar et al./Building and Environment83(2015)79e90 90
第七 章 CFD仿真模拟
第七章CFD仿真模拟 一.初识CFD CFD是英文Computational Fluid Dynamics(计算流体动力学)的简称。它是伴随着计算机技术、数值计算技术的发展而发展的。简单地说,CFD相当于"虚拟"地在计算机做实验,用以模拟仿真实际的流体流动情况。而其基本原理则是数值求解控制流体流动的微分方程,得出流体流动的流场在连续区域上的离散分布,从而近似模拟流体流动情况。可以认为CFD是现代模拟仿真技术的一种。 1933年,英国人Thom首次用手摇计算机数值求解了二维粘性流体偏微分方程,CFD由此而生。1974年,丹麦的Nielsen首次将CFD用于暖通空调工程领域,对通风房间内的空气流动进行模拟。之后短短的20多年内,CFD技术在暖通空调工程中的研究和应用进行得如火如荼。如今,CFD技术逐渐成为广大空调工程师和建筑师解决分析工程问题的有力工具。 二.为什么用CFD CFD是一种模拟仿真技术,在暖通空调工程中的应用主要在于模拟预测室内外或设备内的空气或其他工质流体的流动情况。以预测室内空气分布为例,目前在暖通空调工程中采用的方法主要有四种:射流公式,Zonal model,CFD以及模型实验。 由于建筑空间越来越向复杂化、多样化和大型化发展,实际空调通风房间的气流组织形式变化多样,而传统的射流理论分析方法采用的是基于某些标准或理想条件理论分析或试验得到的射流公式对空调送风口射流的轴心速度和温度、射流轨迹等进行预测,势必会带来较大的误差。并且,射流分析方法只能给出室内的一些集总参数性的信息,不能给出设计人员所需的详细资料,无法满足设计者详细了解室内空气分布情况的要求; Zonal model是将房间划分为一些有限的宏观区域,认为区域内的相关参数如温度、浓度相等,而区域间存在热质交换,通过建立质量和能量守恒方程并充分考虑了区域间压差和流动的关系来研究房间内的温度分布以及流动情况,因此模拟得到的实际上还只是一种相对"精确"的集总结果,且在机械通风中的应用还存在较多问题; 模型实验虽然能够得到设计人员所需要的各种数据,但需要较长的实验周期和昂贵的实验费用,搭建实验模型耗资很大,有文献指出单个实验通常耗资3000~20000美元,而对于不同的条件,可能还需要多个实验,耗资更多,周期也长达数月以上,难于在工程设计中广泛采用。 另一方面,CFD具有成本低、速度快、资料完备且可模拟各种不同的工况等独特的优点,故其逐渐受到人们的青睐。由表1给出的四种室内空气分布预测方法的对比可见,就目前的三种理论预测室内空气分布的方法而言,CFD方法确实具有不可比拟的优点,且由于当前计算机技术的发展,CFD方法的计算周期和成本完全可以为工程应用所接受。尽管CFD方法还存在可靠性和对实际问题的可算性等问题,但这些问题已经逐步得到发展和解决。因此,CFD方法可应用于对室内空气分布情况进行模拟和预测,从而得到房间内速度、温度、湿度以及有害物浓度等物理量的详细分布情况。 进一步而言,对于室外空气流动以及其它设备内的流体流动的模拟预测,一般只有模型实验或CFD方法适用。表1的比较同样表明了CFD方法比模型实验的优越性。故此,CFD方法可作为解决暖通空调工程的流动和传热传质问题的强有力工具而推广应用。 表1四种暖通空调房间空气分布的预测方法比较 比较项目 1射流公式 2 ZONAL MODEL 3CFD 4模型实验 房间形状复杂程度简单较复杂基本不限基本不限 ?对经验参数的依赖性几乎完全很依赖一些不依赖
医药工业洁净厂房设计要求规范
医药工业洁净厂房设计规范 第一章总则 第1.0.1条为了贯彻执行国家《药品生产质量管理规范》(以下简称GMP),提出符合GMP要求的生产厂房、设施及设备的设计要求,特制订本规范。 第1.0.2条本规范适用于新建、改建和扩建的医药制剂、原料药和药用辅料的精制、干燥、包装工序,直接接触药品的药用包装材料、无菌医疗器械等医药工业洁净厂房的设计。 第1.0.3条医药工业洁净厂房诉设计必须贯彻国家有关方针、政策。做到技术先进、确保质量、安全实用、经济合理,符合节约能源和保护环境的要求。 第1.0.4条医药工业洁净厂房的设计,既要满足当前产品生产的工艺要求,也应适当考虑今后生产发展和工艺改进的需要。 第1.0.5条在利用原有建筑和设施进行洁净技术改造时,可根据生产工艺要求,从实际出发,充分利用现有的技术设施,符合因地制宜的原则。 第1.0.6条医药工业洁净厂房的设计应为施工安装、维护、管理、检修、测试和安全运行创造必要的条件。 第1.0.7条医药工业洁净厂房的设计除应执行本规范外,还应符合现行的国家标准、规范和规定的有关要求。 第二章生产区域的环境参数 第一节一般规定 第2.1.1条为了保证医药产品生产质量,防止生产环境对产品的污染,生产区域必须满足规定的环境参数标准。
注2:空气洁净度的测试以静态条件为依据,测试方法应符合国家医药管理工业洁净室和洁净区悬浮粒子的测试方法》中有关规定; 注3:对于空气洁净度为100级的洁净室,室内大于等于5μm尘粒的计数,应进行多次采样,当其多次出现时,方可认为该测试数值是可靠的。 第2.2.2条药品生产有关工序和环境区域的空气洁净度等级按国家CMP等有关规定确定。 第2.2.3条洁净室内的温度和湿度应符合下列规定: 一、生产工艺对温度和湿度无特殊要求时,以穿着洁净工作服不产生不舒服感为宜。空气洁净度100级、10000级区域一般控制温度为20~24℃,相对湿度为45~60%。100000级区域一般控制温度为18~28℃,相对湿度为50~65%。 二、生产工艺对温度和湿度有特殊要求时,应根据工艺要求确定。 第2.2.4条洁净室内应保持一定的新鲜空气量,其数值应取下列风量中的最大值: 一、非单向流洁净室总送风量的10~30%,单向流洁净室总送风量的2~4%; 二、补偿室内排风和保持室内正压值所需的新鲜空气量; 三、保证室内每人每小时的新鲜空气量不小于40m3。 第2.2.5条洁净室必须维持一定的正压。不同空气洁净度的洁净区之间以及洁净区与非洁净区之间的静压差不应小于5Pa,洁净区与室外的静压差不应小于10Pa。 青霉素等特殊药物生产洁净区,固体口服制剂配料、制粒、压片等工序洁净区的气压控制,应符合第8.5.1条要求。 第2.2.6条洁净室和洁净区应根据生产要求提供足够的照度。主要工作室一般照明的照度值不宜低于300LX;辅助工作室、走廊、气闸室、人员净化和物料净化用室可低于300LX,但不宜低于150LX。对照度要求高的部位可增加局部照明。
一维CFD模拟仿真设计
CFD simulation in Laval nozzle SIAE 090441313 Abstract We aim to simulate the quasi one dimension flow in the Laval nozzle based on CFD computation in this paper .We consider the change of the temperature ,the pressure ,the density and the speed of the flow to study the flow.The analytic solution of the flow in the Laval nozzle is provided when the input velocity is supersonic.We use the Mac-Cormack Explicit Difference Scheme to slove the question. Key words :Laval nozzle ,CFD,throat narrow. Contents Abstract .................................................. . (1) Introduction .............................................. .. (2) Simulation of one-dimensional steady flow (3)
Basis equations ................................................. (3) Dimensionless .......................................... . (10) Mac -Cormack Explicit Difference Scheme (11) Boundary conditions ................................................ (13) Reference .............................................. (13) Annex .................................................. .. (14) Introduction Laval nozzle is the most commonly used components of rocket engines and aero-engine, constituted by two tapered tube, one shrink tube, another expansion tube. Laval nozzle is an important part of the thrust chamber. The first half of the nozzle from large to small contraction to a narrow throat to the middle. Narrow throat and then expand
洁净厂房设计规范2019
1 总则 1.0.1为在医药工业洁浄厂房设计中贯彻执行国家有关方针政策,做到技术先进、安全可靠、确保质量、节能环保,制定本标准 1.0.2本标准适用于新建、扩建和改建的医药工业洁净厂房设计。生物制品、毒性药品、精神药品、麻醉药品以及放射性药品的生产和质量检验设施除应执行本标准外,尚应符合国家有关的监管规定。 1.0.3医药工业洁净厂房的设计应为施工安装、系统设施验证、维护管理、检修测试和安全运行创造必要的条件 1.0.4医药工业洁净厂房的设计除应符合本标准外,尚应符合国家现行有关标准规范的规定。 2术语 2.0.1医药洁净室pharmaceutical clean room 空气悬浮粒子和微生物浓度,以及温度、湿度、压力等参数受控的医药生产房间或限定的空间。
2.0.2医药工业洁净厂房pharmaceutical industry clean room 包含医药洁净室的用于药品生产及质量控制的建筑物 2.0.3人员净化用室room forcleaning personne 人员在进人医药洁净室之前按一定程序进行净化的房间 2.0.4物料净化用室room forcleaning materia 物料在进入医药洁净室之前按一定程序进行净化的房间 2.0.5受控环境controlled environment 以规定方法对污染源进行控制的特定区域 2.0.6悬浮粒子airborne particles 用于空气洁净度分级的空气悬浮粒子尺寸范围在0.1um~1000um 的固体和液体粒子。 2.0.7微生物microorganIsms 能够复制或传递基因物质的细菌或非细菌的微小生物实体 2.0.8含尘浓度particle concentration 单位体积空气中悬浮粒子的数量
CFD仿真验证及有效性指南
CFD仿真验证及有效性指南 摘要 本文提出评估CFD建模和仿真可信性的指导方法。评估可信度的两个主要原则是:验证和有效。验证,即确定计算模拟是否准确表现概念模型的过程,但不要求仿真和现实世界相关联。有效,即确定计算模拟是否表现真实世界的过程。本文定义一些重要术语,讨论基本概念,并指定进行CFD仿真验证和有效的一般程序。本文目的在于提供验证和有效的重要问题和概念的基础,因为一些尚未解决的重要问题,本文不建议作为该领域的标准。希望该指南通过建立验证和有效的共同术语和方法,以助于CFD仿真的研究、发展和使用。这些术语和方法也可用于其他工程和科学学科。 前言 现在,使用计算机模拟流体的流动过程,用于设计,研究和工程系统的运行,并确定这些系统在不同工况下的性能。CFD模拟也用于提高对流体物理和化学性质的理解,如湍流和燃烧,有助于天气预报和海洋。虽然CFD模拟广泛用于工业、政府和学术界,但目前评估其可信度的方法还很少。这些指导原则基于以下概念,没有适用于所有CFD模拟的固定的可信度和精确度。模拟所需的精确度取决于模拟的目的。 建立可信度的两个主要原则是验证和有效(V&V)。这里定义,验证即确定模型能准确表现设计者概念模型的描述和模型解决方案的过程,有效即确定预期模型对现实世界表现的准确度的过程。该定义表明,V&V的定义还在变动,还没有一个明确的最终定义。通常完成或充分由实际问题决定,如预算限制和模型的预期用途。复合建模和计算模拟没有任何包括准确性的证明,如在数学分析方面的发展。V&V的定义也强调准确度的评价,一般在验证过程中,准确度以对简化模型问题的基准解决方法符合性确定;有效性时,准确度以对实验数据即现实的符合性确定。 通常,不确定性和误差可视为与建模和仿真准确度相关的正常损失。不确定性,即在任一建模过程中由于缺乏知识导致的潜在缺陷。知识缺乏通常是由对物理特性或参数的不完全了解造成的,如对涡轮叶片表面粗糙度分布的不充分描述。知识缺乏的另一个原因是物理过程的复杂性,如湍流燃烧。误差即在建模和
车流量仿真分析-Flotran CFD
2006年用户年会论文 基于ANSYS流体动力学的车流量仿真分析1 [刘长虹,郑杰,朱晓华,张海波,黄虎,陈力华] [上海工程技术大学汽车工程学院,上海,201600] [ 摘要 ] 将交通流比拟为管道流体模型并且利用有限元分析软件ANSYS中的FLOTRAN CFD流体分析模块对隧道口交通流进行比拟及仿真,得出相应交通流量模型和车辆流动模拟图。并对不同车速下 交叉道口的通行能力进行模拟,确定出最佳车速比。且对不同入口形状进行车流通畅度的 ANSYA软件比较模拟,通过模拟直观的展示出不同道路入口形状对车流和道路的影响。最后对 高峰路段路口设计提出有关建议。 [ 关键词]交通流,交通流模型,ANSYS,模拟 Simulating to Traffic Flux By the ANSYS Fluid Dynamic Analysis [Liu Changhong, Zheng Jie, Zhu Xiaohua, Zhang Haibo, Huang Hu, Chen Lihua] [Automobile College Shanghai University of Engineering Science, Shanghai 201600] [Abstract ] Firstly, based on the fluid dynamic mechanics of channel, a traffic flow model is built. Secondly, the traffic flow model on cross road is simulated with the finite element method software (ANSYS). Then according to the calculating results, the simulating traffic ability at the entrance of the roadl in different speed and the different entrance figures are calculated directly. Finally, some suggestions of designing the heavy road are given. [ Keyword ] traffic flow, traffic flow simulation, ANSYS, Simulation. 1.前言 当前,社会经济的迅速发展与交通建设的相对滞后,已经构成非常突出的世界性矛盾,在发展中国家尤其突出。在我国许多大城市中,交通堵塞,事故频繁,成了众所周知的“都市顽症”。以上海市为例,上世纪九十年代的资料表明,在交通高峰期,市中心机动车平均车速不到15km/h,最低的车速仅仅为4km/h,即低于正常的步行速度。解决这个矛盾的一个重要办法是大力进行市政交通建设,实现交通的立体化,现代化。同时还要保证建设道路的合理性。交通流理论是解决这类方法的一种理论方法[1,2],其中有根据流体动力学理 1上海市教委基金项目(041NE31)和上海市科委基金项目(04QMX1452)资助
医药工业洁净厂房设计规范
医药工业洁净厂房设计规 范 Jenny was compiled in January 2021
医药工业洁净厂房设计规范 第一章总则 第条为了贯彻执行国家《药品生产质量管理规范》(以下简称GMP),提出符合GMP要求的生产厂房、设施及设备的设计要求,特制订本规范。 第条本规范适用于新建、改建和扩建的医药制剂、原料药和药用辅料的精制、干燥、包装工序,直接接触药品的药用包装材料、无菌医疗器械等医药工业洁净厂房的设计。 第条医药工业洁净厂房诉设计必须贯彻国家有关方针、政策。做到技术先进、确保质量、安全实用、经济合理,符合节约能源和保护环境的要求。 第条医药工业洁净厂房的设计,既要满足当前产品生产的工艺要求,也应适当考虑今后生产发展和工艺改进的需要。 第条在利用原有建筑和设施进行洁净技术改造时,可根据生产工艺要求,从实际出发,充分利用现有的技术设施,符合因地制宜的原则。 第条医药工业洁净厂房的设计应为施工安装、维护、管理、检修、测试和安全运行创造必要的条件。 第条医药工业洁净厂房的设计除应执行本规范外,还应符合现行的国家标准、规范和规定的有关要求。 第二章生产区域的环境参数 第一节一般规定 第条为了保证医药产品生产质量,防止生产环境对产品的污染,生产区
注3:对于空气洁净度为100级的洁净室,室内大于等于5μm尘粒的计数,应进行多次采样,当其多次出现时,方可认为该测试数值是可靠的。 第2.2.2条药品生产有关工序和环境区域的空气洁净度等级按国家CMP等有关规定确定。 第2.2.3条洁净室内的温度和湿度应符合下列规定: 一、生产工艺对温度和湿度无特殊要求时,以穿着洁净工作服不产生不舒服感为宜。空气洁净度100级、10000级区域一般控制温度为20~24℃,相对湿度为45~60%。100000级区域一般控制温度为18~28℃,相对湿度为50~65%。 二、生产工艺对温度和湿度有特殊要求时,应根据工艺要求确定。 第2.2.4条洁净室内应保持一定的新鲜空气量,其数值应取下列风量中的最大值: 一、非单向流洁净室总送风量的10~30%,单向流洁净室总送风量的2~4%; 二、补偿室内排风和保持室内正压值所需的新鲜空气量; 三、保证室内每人每小时的新鲜空气量不小于40m3。 第2.2.5条洁净室必须维持一定的正压。不同空气洁净度的洁净区之间以及洁净区与非洁净区之间的静压差不应小于5Pa,洁净区与室外的静压差不应小于10Pa。 青霉素等特殊药物生产洁净区,固体口服制剂配料、制粒、压片等工序洁净区的气压控制,应符合第条要求。
医药工业洁净厂房设计规范GMP-97
医药工业洁净厂房设计规范 GMP—97 目录 医药工业洁净厂房设计规范 (1) 第一章总则 (2) 第二章生产区域的环境参数 (2) 第一节一般规定 (2) 第二节环境参数的设计要求 (2) 第三章厂址选择和总平面布置 (3) 第一节厂址选择 (3) 第二节总平面布置 (4) 第四章工艺设计 (4) 第一节工艺布局 (4) 第二节人员净化 (5) 第三节物料净化 (6) 第五章设备 (6) 第六章工艺管道 (8) 第一节一般规定 (8) 第二节管道材料、阀门和附件 (8) 第三节管道的安装、保温 (8) 第四节安全 (9) 第七章建筑 (9) 第一节一般规定 (9) 第二节防火和疏散 (9) 第三节室内装修 (10) 第八章空气净化 (11) 第一节一般规定 (11) 第二节净化空气调节系统 (11) 第三节气流组织 (12) 第四节风管和附件 (13) 第五节青霉素等药物生产洁净室的特殊要求 (13) 第九章给水排水 (14) 第一节一般规定 (14) 第二节给水 (14) 第三节排水 (14) 第四节工艺用水 (14) 第五节消防设施 (15) 第十章电气 (16) 第一节配电 (16) 第二节照明 (16) 第三节其它电气 (17) 附录一名词解释 (18) 附录二本规范用词说明 (19)
第一章总则 第1.0.1条为了贯彻执行国家《药品生产质量管理规范》(以下简称GMP),提出符合GMP要求的生产厂房、设施及设备的设计要求,特制订本规范。 第1.0.2条本规范适用于新建、改建和扩建的医药制剂、原料药和药用辅料的精制、干燥、包装工序,直接接触药品的药用包装材料、无菌医疗器械等医药工业洁净厂房的设计。 第1.0.3条医药工业洁净厂房诉设计必须贯彻国家有关方针、政策。做到技术先进、确保质量、安全实用、经济合理,符合节约能源和保护环境的要求。 第1.0.4条医药工业洁净厂房的设计,既要满足当前产品生产的工艺要求,也应适当考虑今后生产发展和工艺改进的需要。 第1.0.5条在利用原有建筑和设施进行洁净技术改造时,可根据生产工艺要求,从实际出发,充分利用现有的技术设施,符合因地制宜的原则。 第1.0.6条医药工业洁净厂房的设计应为施工安装、维护、管理、检修、测试和安全运行创造必要的条件。 第1.0.7条医药工业洁净厂房的设计除应执行本规范外,还应符合现行的国家标准、规范和规定的有关要求。 第二章生产区域的环境参数 第一节一般规定 第2.1.1条为了保证医药产品生产质量,防止生产环境对产品的污染,生产区域必须满足规定的环境参数标准。 第2.1.2条医药工业洁净室和洁净区应以微粒和微生物为主要控制对象,同时还应对其环境的温度、湿度、新鲜空气量、状差、照度、噪场院等参数作出必要的规定。 第2.1.3条环境空气中不应有不愉快气味以及有碍药品质量和人体健康的气体。 第二节环境参数的设计要求 第2.2.1条医药工业洁净厂房空气洁净度按表2.2.1规定分为三个等级。 医药工业洁净厂房空气洁净度等级表2.2.1
医药工业洁净厂房设计规范
国家医药管理局医药工业洁净厂房设计规范 默认分类 2008-07-13 12:25 阅读1075 评论3 字号: 大中小 主编部门:国家医药管理局上海医药设计院 批准部门:国家医药管理局 施行日期:1997年1月1日 编制说明 为在我国医药行业深入实施GMP,适应医药工业洁净厂房建设的需要,国家医药局推行GMP、GSP委员会设计规范专业组决定组织编写《医药工业洁净厂房设计规范》。 本规范由上海医药设计院主编,缪德华同志执笔,武汉医药设计院、重庆医药设计院等单位参与。在编写过程中广泛眚注医药行业内有关方面意见,并先后数次组织医药设计单位与大中型骨干企业的专家进行了认真的讲座修改,由局推行GMP、GSP委员会寓言并原则通过。之后,局综合经济司(原局计划)就规范主要内容向卫生部药政局、药品监督办公室的领导、专家征询了意见并得到了她们的理解与支持。在此基础上,局GMP设计规范专业组对本规范作了修改定稿。 本规范编制工作结合国内外GMP的进展与医药工业洁净厂房建设、使用的实践经验,提出了我国医药工业洁净厂房设计的基本要求。各单位在新建、改建与扩建的工程设计中遵照执行。并认真总结经验,提出修改意见,以使本规范日臻完善。 国家医药管理局 第一章总则 第1、0、1条为了贯彻执行国家《药品生产质量管理规范》(以下简称GMP),提出符合GMP要求的生产厂房、设施及设备的设计要求,特制订本规范。 第1、0、2条本规范适用于新建、改建与扩建的医药制剂、原料药与药用辅料的精制、干燥、包装工序,直接接触药品的药用包装材料、无菌医疗器械等医药工业洁净厂房的设计。 第1、0、3条医药工业洁净厂房诉设计必须贯彻国家有关方针、政策。做到技术先进、确保质量、安全实用、经济合理,符合节约能源与保护环境的要求。 第1、0、4条医药工业洁净厂房的设计,既要满足当前产品生产的工艺要求,也应适当考虑今后生产发展与工艺改进的需要。 第1、0、5条在利用原有建筑与设施进行洁净技术改造时,可根据生产工艺要求,从实际出
医药行业洁净车间设计规范
医药工业洁净厂房设计规范 GB/T14294-1993 主编部门:国家医药管理局上海医药设计院 批准部门:国家医药管理局 施行日期:1997年1月1日
编制说明 为在我国医药行业深入实施GMP,适应医药工业洁净厂房建设的需要,国家医药局推行GMP.GSP委员会设计规范专业组决定组织编写《医药工业洁净厂房设计规范》。 本规范由上海医药设计院主编,缪德华同志执笔,武汉医药设计院、重庆医药设计院等单位参与。在编写过程中广泛眚注医药行业内有关方面意见,并先后数次组织医药设计单位和大中型骨干企业的专家进行了认真的讲座修改,由局推行GMP.GSP委员会寓言并原则通过。之后,局综合经济司(原局计划)就规范主要内容向卫生部药政局、药品监督办公室的领导、专家征询了意见并得到了他们的理解和支持。在此基础上,局GMP设计规范专业组对本规范作了修改定稿。 本规范编制工作结合国内外GMP的进展和医药工业洁净厂房建设、使用的实践经验,提出了我国医药工业洁净厂房设计的基本要求。各单位在新建、改建和扩建的工程设计中遵照执行。并认真总结经验,提出修改意见,以使本规范日臻完善。 国家医药管理局 第一章总则 第1.0.1条为了贯彻执行国家《药品生产质量管理规范》(以下简称GMP),提出符合GMP要求的生产厂房、设施及设备的设计要求,特制订本规范。 第1.0.2条本规范适用于新建、改建和扩建的医药制剂、原料药和药用辅料的精制、干燥、包装工序,直接接触药品的药用包装材料、无菌医疗器械等医药工业洁净厂房的设计。 第1.0.3条医药工业洁净厂房诉设计必须贯彻国家有关方针、政策。做到技术先进、确保质量、安全实用、经济合理,符合节约能源和保护环境的要求。 第1.0.4条医药工业洁净厂房的设计,既要满足当前产品生产的工艺要求,也应适当考虑今后生产发展和工艺改进的需要。 第1.0.5条在利用原有建筑和设施进行洁净技术改造时,可根据生产工艺要求,从实际出发,充分利用现有的技术设施,符合因地制宜的原则。 第1.0.6条医药工业洁净厂房的设计应为施工安装、维护、管理、检修、测试和安全运行创造必要的条件。 第1.0.7条医药工业洁净厂房的设计除应执行本规范外,还应符合现行的国家标准、规范和规定的有关要求。 第二章生产区域的环境参数 第一节一般规定 第2.1.1条为了保证医药产品生产质量,防止生产环境对产品的污染,生产区域必须满足规定的环境参数标准。 第2.1.2条医药工业洁净室和洁净区应以微粒和微生物为主要控制对象,同时还应对其环境的温度、湿度、新鲜空气量、状差、照度、噪场院等参数作出必要的规定。 第2.1.3条环境空气中不应有不愉快气味以及有碍药品质量和人体健康的气体。
医药厂房建筑要求
药厂的建筑要求 主编部门:国家医药管理局上海医药设计院 批准部门:国家医药管理局 施行日期:1997年1月1日 编制说明 为在我国医药行业深入实施GMP,适应医药工业洁净厂房建设的需要,国家医药局推行GMP.GSP委员会设计规范专业组决定组织编写《医药工业洁净厂房设计规范》。 本规范由上海医药设计院主编,缪德华同志执笔,武汉医药设计院、重庆医药设计院等单位参与。在编写过程中广泛眚注医药行业内有关方面意见,并先后数次组织医药设计单位和大中型骨干企业的专家进行了认真的讲座修改,由局推行GMP.GSP委员会寓言并原则通过。之后,局综合经济司(原局计划)就规范主要内容向卫生部药政局、药品监督办公室的领导、专家征询了意见并得到了他们的理解和支持。在此基础上,局GMP设计规范专业组对本规范作了修改定稿。 本规范编制工作结合国内外GMP的进展和医药工业洁净厂房建设、使用的实践经验,提出了我国医药工业洁净厂房设计的基本要求。各单位在新建、改建和扩建的工程设计中遵照执行。并认真总结经验,提出修改意见,以使本规范日臻完善。 ?国家医药管理局 ?1996北京 目录 第一章总则 第二章生产区域的环境参数 第一节一般规定 第二节环境参数的设计要求 第三章厂址选择和总平面布置 第一节厂址选择 第二节总平面布置 第四章工艺设计 第一节工艺布局 第二节人员净化 第三节物料净化 第五章设备 第六章工艺管道 第一节一般规定 第二节管道材料、阀门和附件 第三节管道的安装、保温 第四节安全 第六章建筑 第一节一般规定 第二节防火和疏散 第三节室内装修 第七章建筑 1. 一般规定 2. 防火和疏散 第三节室内装修 第八章空气净化 第一节一般规定 第二节净化空气调节系统 第三节气流组织 第四节风管和附件 第五节青霉素等药物生产洁净室的特殊要求 第九章给水排水 第一节一般规定 第二节给水 第三节排水 第四节工艺用水 第五节消防设施 第十章电气 第一节配电 第二节照明 第三节其它电气 附录一名词解释 附录二本规范用词说明 第一章总则 第1.0.1条为了贯彻执行国家《药品生产质量管理规范》(以下简称GMP),提出符合GMP要求的生产厂房、设施及设备的设计要
CFD案例5-发动机仿真
ANSYS对航空工业解决方案(三)航空发动机仿真方案_2 发表时间:2008-10-23 作者: 安世亚太来源: 安世亚太 关键字: 航空航天 CAE 仿真解决方案 ANSYS 安世亚太 第三章航空发动机仿真方案航空发动机行业概况航空发动机研制中的典型CAE问题航空发动机结构力学计算需求及ANSYS实现航空发动机流体力学和温度场的计算需求及ANSYS实现航空发动机电磁场计算需求及ANSYS实现航空发动机耦合场计算需求及ANSYS实现航空发动机关键零部件的设计分析流程简要说明 4航空发动机流体力学和温度场的计算需求及ANSYS实现 航空燃气涡轮发动机内的流场很复杂,不仅动静流场同时存在,同时还伴有多相流、传热、燃烧等现象,即使从物理上进行很大的简化,模型最后仍然是三维、有粘、非定常的可压流动。航空发动机流场数值计算的发展经历了S2流面法、基于一元管道的流线曲率法、有限差分方法求解非正交曲线坐标系中的S1、S2流面基本方程、有限差分、有限体积和有限差分与流线曲率混合的方法对S1流面跨音速流场的计算,而现在由S1与S2流面相互迭代形成的准三元和全三元计算也发展起来了。现在的采用有限体积法求解NS方程全三维流场计算已经广泛采用,航空发动机的流场数值计算已趋于成熟,可以充分考虑旋转流动、转静干涉问题、多相流、燃烧、亚超跨音速等复杂现象。而且现在求解的规模也不断扩大,利用并行等成熟的CFD技术可以计算达几千万甚至上亿的计算网格。因此结果也更为真实有效。 ANSYSCFX凭借TASCFLOW在叶轮机旋转流动的传统优势,结合更为先进的网格处理技术和高效的求解器,更适合航空发动机流动的复杂性,求解问题的规模和计算精度大大提高,一直处于航空发动机流动模拟的最前沿。
洁净厂房洁净区设计规范
洁净厂房洁净区设计规 范 Document serial number【KKGB-LBS98YT-BS8CB-BSUT-BST108】
国家医药管理局医药工业洁净厂房设计规范主编部门:国家医药管理局上海医药设计院 批准部门:国家医药管理局 施行日期:1997年1月1日 编制说明: 为在我国医药行业深入实施GMP,适应医药工业洁净厂房建设的需要,国家医药局推行GMP.GSP委员会设计规范专业组决定组织编写《医药工业洁净厂房设计规范》。 本规范由上海医药设计院主编,缪德华同志执笔,武汉医药设计院、重庆医药设计院等单位参与。在编写过程中广泛眚注医药行业内有关方面意见,并先后数次组织医药设计单位和大中型骨干企业的专家进行了认真的讲座修改,由局推行GMP.GSP委员会寓言并原则通过。之后,局综合经济司(原局计划)就规范主要内容向卫生部药政局、药品监督办公室的领导、专家征询了意见并得到了他们的理解和支持。在此基础上,局GMP设计规范专业组对本规范作了修改定稿。 本规范编制工作结合国内外GMP的进展和医药工业洁净厂房建设、使用的实践经验,提出了我国医药工业洁净厂房设计的基本要求。各单位在新建、改建和扩建的工程设计中遵照执行。并认真总结经验,提出修改意见,以使本规范日臻完善。 国家医药管理局 第一章总则 为了贯彻执行国家《药品生产质量管理规范》(以下简称GMP),提出符合GMP要求的生产厂房、设施及设备的设计要求,特制订本规范。 本规范适用于新建、改建和扩建的医药制剂、原料药和药用辅料的精制、干燥、包装工序,直接接触药品的药用包装材料、无菌医疗器械等医药工业洁净厂房的设计。 医药工业洁净厂房诉设计必须贯彻国家有关方针、政策。做到技术先进、确保质量、安全实用、经济合理,符合节约能源和保护环境的要求。
CFD仿真技术在航空发动机中的应用
CFD仿真技术在航空发动机中的应用 摘要:随着科学技术的发展,航空航天和空间技术有了飞跃的发展,在这些飞 跃的发展技术中主要的技术就是CAE技术。航空工业可以说是CAE技术发展的摇篮,各种CAE技术正是在以航空工业为主的实际工业应用的推动下在不到半个世 纪时间里迅猛发展起来的。以ANSYS、LS-DYNA、Nastran、CFX、Fluent等为代表 的高端CAE软件早已活跃在全球航空工业中。 关键词:CFD仿真技术;航空发动机;应用 1 引言 目前国际知名企业的航空发动机研制周期从过去的10~15年缩短到6~8年 甚至4~5年,试验机也从过去的40~50台减少到10台左右。在发达国家的航 空企业里CAE已经作为产品研发设计与制造流程中不可逾越的一种强制性的工艺 规范加以实施,在生产实践作为必备工具普遍应用。 2、CFD技术国内外使用状况简介 CFD作为CAE技术的一种,已经越来越多的被国内外航空企业广泛的得以应用。第一个商用CFD软件包FLUENT,由与美国空军合作的流体技术服务公司Creare公司于1983年推出的。商业CFD软件的开发及应用,加速了航空工业的 发展,使得基于虚拟样机仿真的现代设计方法成为了可能。以波音公司航空研发 发展历史为例,不难发现,波音公司先后采用了经典的实验测试方法、半经验的 方法、空气动力学的计算、政府内部及企业的CFD代码及广泛的采用CFD商业代码。在波音公司2005年的软件应用报告中明确指明,在1998至2005年内,其 公司每年数值仿真成果的增加量都接近84%左右,采用CAE/CFD的速度超过了工 业的成长速度,CFD技术已经成为其设计的主要手段之一。另外从美国软件公司ANSYS公司的销售业绩报告上显示,航空工业上的应用产值是其公司的主要收益 来源之一。 CFD软件正以其强大的优势在研发中发挥的巨大的作用,例如在NISA的报告 中提到,原本需要7年完成的维吉尼亚级潜水艇的设计,通过CFD技术的应用, 5年就顺利完成;而预计需要11年完成的B-2轰炸机的飞行测试,则在短短的4 年内就通过了测试。 国内在CFD技术上的应用一般,特别是在航空发动方面的使用上,起步与国 外相比较晚,力度上也相差较多。 3、CFD技术的应用 目前在航空发动机的实际应用中是最广泛的一款CFD商业软件是ANSYS旗下 的商业软件FLUENT,其不仅容易使用,而且其准确性及行业的广泛性都是其它商业软件所不能比拟的。CFD软件的使用已经遍及了航空发动机的各个部分的研究,接下来本文通过对其它文献的分析逐一介绍CFD在航空发动机中的使用。 3.1 CFD技术在压缩机、涡轮方面的应用 气动稳定性的设计是当代航空发动机发展研制过程中的重要技术问题之一。 在航空发动机中,对气流最敏感的部件是风扇、压气机和涡轮。在以上3个部件中,CFD的主要应用集中在对压气机和涡轮效率分析上,多级压气机/涡轮最主要 的气动问题就是各级流动是否匹配,总的效率是否达到设计要求。在涡轮方面,CFD不仅可以计算涡轮效率,而且对涡轮叶片的冷却效果分析有着重要的应用。
医药工业洁净厂房的消防设计
仅供参考[整理] 安全管理文书 医药工业洁净厂房的消防设计 日期:__________________ 单位:__________________ 第1 页共6 页
医药工业洁净厂房的消防设计 摘要:介绍了医药工业洁净厂房的特点,分析了其火灾危险性及存在的问题,提出了在消防设计上应注意的事项,探讨 关键词:医药洁净厂房;火灾危险;消防设计 目前,我国正在推行药品GMP(药品生产管理规范)认证,此项认证对厂房洁净度的要求应达标。而医药工业生产工艺复杂,生产过程中使用多种化学危险物品,火灾危险性较大,有的药品价格昂贵,一旦发生火灾,损失严重。医药洁净厂房的设计依据是GB50073—2001《洁净厂房设计规范》,并参照执行国家医药管理局发布的《医药工业洁净厂房设计规范》,笔者就此类厂房的火灾危险性、消防设计及审核应注意的问题做一探讨。医药工业洁净厂房的火灾危险性大 (1)医药工业洁净厂房经常使用各种易燃易爆化学危险物品,且本身化学反应也有燃烧爆炸危险,如使用环氧乙烷、酒精、煤气活性镍、钯炭等极易引起燃烧的物品,制剂工艺灭菌工序中的火焰法和环氧乙烷法的火灾危险性都较大。 (2)建筑或装修材料采用易燃材料。由于洁净厂房需要特殊,加之很多新型复合材料的使用,而建设单位缺乏消防知识,有些选用了有机复合材料,或彩钢板加泡沫,增加了火灾荷载,这些材料燃烧后,又会产生大量的有毒气体。 (3)医药洁净厂房由于洁净无菌的工艺要求,密封性好,但易造成发生火灾后,有毒高温烟气不易及时扩散,甚至会使轰燃提前发生。 (4)人员人口不能满足疏散的要求。医药洁净厂房必须经过清洗、男(女)更衣、消毒等隔离间方可进入,且由于洁净无菌的要求,该疏散门不能采用向疏散方向开启的门,火灾时从人口疏散极为复杂和困难。 第 2 页共 6 页
洁净厂房设计规范(GB50073-2013)
洁净厂房设计规范(GB50073-2013) 4. 1 洁净厂房位置选择和总平面布置 4.1. 1 洁净厂房位置选择应符合下列规定,并经技术经济方案比较后确定:1)应在大气含尘和有害气体浓度较低、自然环境较好的 区域。 2)应远离铁路、码头、飞机场、交通要道以及散发大量粉尘和有害气体的工厂、贮仓、堆场等有严重空气污染、振动或噪声干扰的区域。当不能远离严重空气污染源时,应位于最大频率风向上风侧,或全年最小频率风向下风侧。 3)应布置在厂区内环境清洁,人流、物流不穿越或少穿越的 地段。 4.1.2对于兼有微振控制要求的洁净厂房的位置选择,应实际测定周围现有振源的振动影响,并应与精密设备、精密仪器仪表容许振动值分析比较后确定。 4.1.3洁净厂房新风口与交通干道边沿的最近距离宜大于 50m。 4.1.4洁净厂房周围宜设置环形消防车道,也可沿厂房的两个长边设置消防车道。 4.1.5洁净厂房周围的道路面层应选用整体性能好、发尘少的材 料。 4.1.6洁净厂房周围应进行绿化。可铺植草坪,不应种植对生产有害的植物,并不得妨碍消防作业。 4.2 工艺平面布置和设计综合协调 4.2.1工艺平面布置应符合下列规定: 1)工艺平面布置应合理、紧凑。洁净室或洁净区内应只布置必要的工艺设备,以及有空气洁净度等级要求的工序和工作室。 2) 在满足生产工艺和噪声要求的前提下,对空气洁净度要求 严格的洁净室或洁净区宜靠近空气调节机房,空气洁净度等级相同的工序和工作室宜集中布置。 3) 洁净室内对空气洁净度要求严格的工序应布置在上风侧, 易产生污染的工艺设备应布置在靠近回风口位置。 4) 应考虑大型设备安装和维修的运输路线,并预留设备安装口和检修口。 5) 不同空气洁净度等级房间之间联系频繁时,宜设有防止污 染的措施,如气闸室、传递窗等。 6) 应设置单独的物料入口,物料传递路线应最短,物料进入洁净室(区)之前应进行清洁处理。 4.2.2洁净厂房的平面和空间设计应满足生产工艺和空气洁净度等级要求。洁净区、人员净化、物料净化和其他辅助用房应分区布置,并应与生产操作、工艺设备安装和维修、管线布置、气流流型以及净化空调系统等各种技术设施进行综合协调。 4.2.3洁净厂房内应少设隔间,但在下列情况下应进行分隔: 1)按生产的火灾危险性分类,甲、乙类与非甲、乙类相邻的生产区段之间,或有防火分隔要求者。 2) 按产品生产工艺需要有分憬要求时。
传热模拟CFD 总结
CFD总结一 CFD是英文computational Fluid Dynamics(计算流体力学)的简称。它是伴随着计算机技术和数值计算技术的发展而发展的。简单地说,CFD相当于虚拟的在计算机内做实验,用它模拟仿真实际流体的流动情况。而其基本的原理是数值求解控制流体的微分方程,得出流体流动的流场在连续区域上的离散分布,从而近似模拟流体流动的情况。即CFD=流体力学+热学+数值分析+计算机科学。 流体力学就不用多说了,很多专业都要用到,主要的概念有层流和湍流,牛顿流体和非牛顿流体等等。热学包括热力学和传热学。数值分析就是如何用计算机解人工很难完成的计算,如何处理无解析解得方程。计算机科学主要是计算机语言,如c、fortran)还包括一些图形处理技术,如在后处理,为了使用户对结论有一个很直观的认识,就需要若干图表。以下就对经常在CFD使用的软件做简单的介绍。 一、CFD的结构: 1、提出问题——流动性质(内流、外流;层流、湍流;单相流、多项流;可压、不可压……),流体属性(牛顿流体:液体、单组分气体、多组分气体、化学反应气体;非牛顿流体) 2、分析问题——建模——N-S方程(连续性假设),Boltzmann方程(稀薄气体流动),各类本构方程与封闭模型。 3、解决问题——差分格式的构造/选择,程序的具体编写/软件的选用,后处理的完成。 4、成果说明——形成文字,提交报告,赚取应得的回报。 二、CFD实现过程: (一)建模——物理空间到计算空间的映射。 主要软件: 二维: AutoCAD: 大家不要小看它,非常有用。一般的网格生成软件建模都是它这个思路,很少有参数化建模的。相比之下 AutoCAD的优点在于精度高,草图处理灵活。可以这样说,任何一个网格生成软件自带的建模工具都是非参数化的,而对于非参数化建模来说,AutoCAD应该说是最好的,毕竟它发展了很多很多年! 三维: 1、CATIA: 航空航天界CAD的老大,法国人的东西,NB,实体建模厉害,曲面建模独步武林。本身可以生成有限元网格,前几天又发布了支持ICEM-CFD的插件ICEM-CFD CAA V5。有了它和ICEM-CFD,可以做任何建模与网格划分! 2、UG: 软件本身不错,大公司用得也多,可是就这么打市场,早晚是走下坡路。按CAD建模的功能来说它排不上第一,也不能屈居第二,尤其是加上了I-DEAS更是如虎添翼。现在关键是看市场了。 3、Solidworks: Solidworks讲的是实用主义,中端CAD软件它功能最强,Solidedge功能是不比它差,但是Solidworks的合作伙伴可能是SE的十几倍,接口也比SE多很多,相比之下Solidworks是最佳选择。Autodesk Inventor也只能算是中端软件,目前说来,我是处于观望态度,看发展再决定。总之,Solidworks目前的发展如日中天,合作伙伴多如牛毛。用起来极其顺手。这里极力向大家推荐的是ICEM-CFD DCI FOR Solidworks!有了这个东西画个全机网格也很容易了。