QoS supporting and optimal energy allocation for a cluster based wireless sensor network

QoS supporting and optimal energy allocation for a cluster
based wireless sensor network
Shensheng Tang,Wei Li
*
Department of Electrical Engineering and Computer Science,University of Toledo,Toledo,OH 43606,USA
Available online 3March 2006
Abstract
Wireless sensor networks (WSNs)have become a very active and important area of research due to their potential in civil and military applications.A lot of research works focus on energy e?cient routing protocols due to the limited energy of battery-powered nodes.Currently,the increasing interest in multimedia applications has made the QoS (quality of service)supporting an unavoidable task.In this paper,we perform the analysis of QoS supporting and optimal energy allocation issues by presenting a cluster based WSN.A QoS supporting scheme is developed for dynamic tra?c conditions by controlling data generating rates at individual clusters.In addi-tion,an explicit solution on the energy distribution at di?erent clusters in the WSN is investigated based on an optimal energy allocation criterion.The localized QoS controlling scheme is useful in WSNs due to ?exibility and scalability,and the obtained network energy distribution formula is particularly convenient for node deployment design in WSNs and three speci?c situations are discussed as applications.
ó2006Elsevier B.V.All rights reserved.
Keywords:Wireless sensor network;Clustering;Data loss rate;Source-to-sink delay;QoS;Optimal energy allocation
1.Introduction
Recently,wireless sensor networks (WSNs)have received more and more attention due to their potential in civil and military applications as well as the advances in micro-electro-mechanical systems (MEMS)technology.Sensor networks are composed of a large number of sen-sors equipped with limited power and radio communica-tion capabilities.They can be deployed in extremely hostile environment,such as battle?eld target area,earth-quake disaster area,and inaccessible area inside a chemical plant or nuclear reactor to measure environmental changes or other needed information.A typical network con?gura-tion consists of sensors working unattended and transmit-ting their observation values to some processing or control center,the so-called sink node,which serves as a user inter-face [1].If these sensors are managed by the sink directly,
control overhead,management delay,and management complexity could make such a network less responsive and less energy e?cient.Clustering has been proposed by researchers to group a number of sensors,usually within a geographic neighborhood,to form a cluster [2].Using a clustering approach,sensors can be managed locally by a cluster head,a node elected to manage the cluster and relay the collected data.In addition,clustering provides inherent optimization capabilities at cluster-heads,such as data pre-processing.
Due to the limited transmission range,data generated from sensors that are far away from the sink must be relayed through a number of intermediate clusters (i.e.,multi-hop communications).Most applications for WSNs involve battery-powered nodes with limited energy.Their batteries may not be convenient for recharging or replac-ing.When a node exhausts its energy,it cannot sense or relay data any more.Thus,current research on sensor net-works mostly focused on protocols with energy e?cient mechanisms [3–6].However,the increasing interest in multimedia applications by employing imaging and video
0140-3664/$-see front matter ó2006Elsevier B.V.All rights reserved.doi:10.1016/https://www.360docs.net/doc/219145255.html,com.2006.02.007
*
Corresponding author.Fax:+14195308146.
E-mail addresses:stang@https://www.360docs.net/doc/219145255.html, (S.Tang),wli@https://www.360docs.net/doc/219145255.html, (W.Li).
https://www.360docs.net/doc/219145255.html,/locate/comcom
Computer Communications 29(2006)
2569–2577
sensors,such as target tracking in battle environments and disaster ?eld,has posed additional challenges [7–9],such as controlling the source-to-sink delay (SSD),data loss rate (DLR)or data pass rate (DPR)within acceptable range.These performance metrics are usually referred to as qual-ity of services (QoSs)of networks.Therefore,in the design of WSNs both energy-e?cient and QoS supporting issues should be considered in order to ensure e?ective ?eld data collection and optimal network energy allocation.
In this paper,we present a cluster based linear WSN topology to perform analysis of the two aspects,i.e.,QoS supporting and optimal energy allocation.Each cluster is managed by a cluster-head,which is modeled by a single server ?xed rate (SSFR)node with ?nite capacity and with di?erent data arrival rate depending on the total (relaying)tra?c from other clusters and the tra?c generated from its own cluster.All the tra?c is relayed from a cluster to another until to the sink.Based on the system model,some important performance metrics are analyzed,such as DLR,DPR,and the mean sojourn time for a data unit at individ-ual clusters and the maximum SSD in the network.Then we develop a QoS supporting scheme which can control the packet loss at individual clusters,and also quantitative-ly investigate the energy distribution in di?erent clusters based on an optimal energy allocation criterion.The obtained energy distribution formula is particularly useful for node deployment design of WSNs and three application situations are discussed as well.
The rest of paper is organized as follows.Section 2pre-sents the system model of the WSN.Section 3proposes the QoS supporting scheme.Section 4focuses on optimal ener-gy allocation issues.Section 5presents the results and dis-cussions.Section 6?nally concludes the paper.2.System model
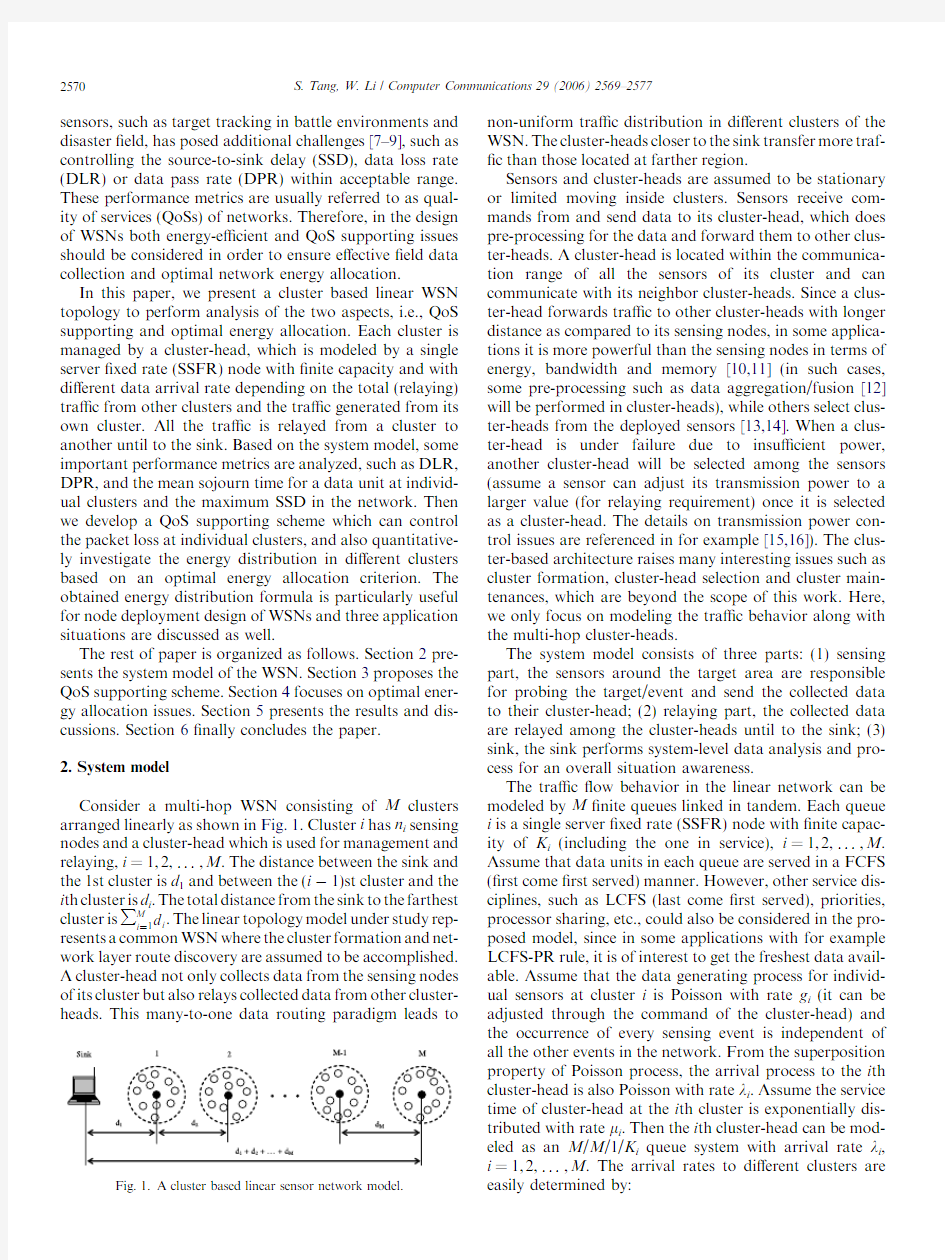
Consider a multi-hop WSN consisting of M clusters arranged linearly as shown in Fig.1.Cluster i has n i sensing nodes and a cluster-head which is used for management and relaying,i =1,2,...,M .The distance between the sink and the 1st cluster is d 1and between the (i à1)st cluster and the i th cluster is d i .The total distance from the sink to the farthest cluster is P M
i ?1d i .The linear topology model under study rep-resents a common WSN where the cluster formation and net-work layer route discovery are assumed to be accomplished.A cluster-head not only collects data from the sensing nodes of its cluster but also relays collected data from other cluster-heads.This many-to-one data routing paradigm leads to
non-uniform tra?c distribution in di?erent clusters of the WSN.The cluster-heads closer to the sink transfer more traf-?c than those located at farther region.
Sensors and cluster-heads are assumed to be stationary or limited moving inside clusters.Sensors receive com-mands from and send data to its cluster-head,which does pre-processing for the data and forward them to other clus-ter-heads.A cluster-head is located within the communica-tion range of all the sensors of its cluster and can communicate with its neighbor cluster-heads.Since a clus-ter-head forwards tra?c to other cluster-heads with longer distance as compared to its sensing nodes,in some applica-tions it is more powerful than the sensing nodes in terms of energy,bandwidth and memory [10,11](in such cases,some pre-processing such as data aggregation/fusion [12]will be performed in cluster-heads),while others select clus-ter-heads from the deployed sensors [13,14].When a clus-ter-head is under failure due to insu?cient power,another cluster-head will be selected among the sensors (assume a sensor can adjust its transmission power to a larger value (for relaying requirement)once it is selected as a cluster-head.The details on transmission power con-trol issues are referenced in for example [15,16]).The clus-ter-based architecture raises many interesting issues such as cluster formation,cluster-head selection and cluster main-tenances,which are beyond the scope of this work.Here,we only focus on modeling the tra?c behavior along with the multi-hop cluster-heads.
The system model consists of three parts:(1)sensing part,the sensors around the target area are responsible for probing the target/event and send the collected data to their cluster-head;(2)relaying part,the collected data are relayed among the cluster-heads until to the sink;(3)sink,the sink performs system-level data analysis and pro-cess for an overall situation awareness.
The tra?c ?ow behavior in the linear network can be modeled by M ?nite queues linked in tandem.Each queue i is a single server ?xed rate (SSFR)node with ?nite capac-ity of K i (including the one in service),i =1,2,...,M .Assume that data units in each queue are served in a FCFS (?rst come ?rst served)manner.However,other service dis-ciplines,such as LCFS (last come ?rst served),priorities,processor sharing,etc.,could also be considered in the pro-posed model,since in some applications with for example LCFS-PR rule,it is of interest to get the freshest data avail-able.Assume that the data generating process for individ-ual sensors at cluster i is Poisson with rate g i (it can be adjusted through the command of the cluster-head)and the occurrence of every sensing event is independent of all the other events in the network.From the superposition property of Poisson process,the arrival process to the i th cluster-head is also Poisson with rate k i .Assume the service time of cluster-head at the i th cluster is exponentially dis-tributed with rate l i .Then the i th cluster-head can be mod-eled as an M /M /1/K i queue system with arrival rate k i ,i =1,2,...,M .The arrival rates to di?erent clusters are easily determined
by:
2570S.Tang,W.Li /Computer Communications 29(2006)2569–2577
k M?n M g M;
k i?n i g itk it1?1àp it1eK it1T
?n i g it
X M
j?it1n j g
j
Y j
k?it1
?1àp keK kT ;
i?1;2;...;Mà1;
e1T
where p i(K i)is the blocking probability of cluster i.By using routine approach[17],the steady-state queue-length distribution of the i th cluster-head is
p i ejT?
e1àq iTq j i
1àq K it1
i
;where q
i
?
k i
l i
.e2TThen many performance metrics can be easily obtained,
such as the data loss rate(DLR)(alternatively,data loss probability(DLP)),data pass rate(DPR)and the mean sojourn time at the i th cluster-head as well as the maximum source-to-sink delay(SSD)in the network.
DLR i?k i p ieK iT;or DLP i?p ieK iT;
DPR i?k i?1àp ieK iT .
e3T
The mean number of data units at the i th cluster-head can be calculated as
E?L i ?
X K i
j?1jp
i
ejT?
q i
1àq i
à
eK it1Tq K it1
i
1àq i i
.
By Little’s law,the mean sojourn time at the i th cluster-head is
E?S i ?E?L i DPR i
?
1
el iàk iT?1àp ieK iT
à
eK it1Tq K i i
l ie1àq K it1
i
T?1àp ieK iT
.e4T
To determine the maximum SSD,we need?rst to ana-lyze the delay-related factors in a multi-hop path.In wire-less mobile networks,the end-to-end packet delay is the total time delay to deliver a packet from source to destina-tion node.It is the sum of delays at all links in the end-to-end path.The delay at an intermediate node usually includes the following components if a retransmission is not considered[18]:(a)processing delay,the time from the arrival of a packet to when it is assigned to a queue for transmission;(b)queuing delay,the time the packet is in queue before transmission starts;(c)transmission delay, the time between transmission of the?rst bit and last bit of the packet;(d)propagation delay,the time for signals to traverse the link.In the above components,processing delay and propagation delay are very small as compared to the queuing delay and transmission delay along a mul-ti-hop path.Therefore,the maximum SSD can be mainly attributed to the sum of the queuing delay and transmis-sion delay at all links between the farthest cluster and the sink,i.e.,SSD max?
X M
i?1
E?S i ;e5T
where the computation should be performed from cluster M to cluster1due to the fact that evaluating cluster i re-quires the information of cluster i+1.
3.QOS supporting
The tra?c in multi-hop WSNs often shows dynamic characteristics due to multimedia applications.Proper traf-?c control scheme should be employed in WSNs to main-tain the QoS requirements under dynamic tra?c conditions.In the above analysis,the cluster-heads are modeled as SSFR nodes with?nite queue capacity.This is due to the fact that sensor nodes are usually constrained in processing and storage capabilities[8].Thus,the node gets full from time to time.Once the node gets full,the next arriving data is rejected and the data is lost.For simplicity, the DLP at individual nodes,DLP i,i=1,2,...,M,are chosen as the QoS metric in this section.Another reason to choose DLP is that the QoS metric is based on individ-ual cluster-heads,which ensures the localized control in cluster-level(rather than network level)and thus less con-trol overhead.The cluster-head is in charge of measuring the DLP of its cluster and controls the data generating rate according to the QoS requirements by exchanging informa-tion with the sensors of its cluster.From Eq.(2),we know that the DLP tends to increase with the increase of tra?c load.Thus,when the DLP i goes above a prede?ned thresh-old due to for example burst tra?c,a command for decreasing data generating rate is broadcast inside the clus-ter.If the DLP i is still unacceptable when the data generat-ing rate reaches the minimum value(assume each cluster is given a minimum data generating rate to maintain appro-priate measuring accurateness),the cluster-head will send a request of decreasing data generating rate to its upstream cluster,and so forth until the QoS metric is controlled under the threshold value.By analysis and experience,we observe that the DLP metric at the cluster closer to the sink always exceeds the threshold earlier.Sometimes the DLP at every cluster is found to be far away below the threshold value,a command for increasing data generating rate is broadcast in the network.The reason for increasing data generating rate is to capture more accurate?eld informa-tion.This,however,also consume more energy from the network.Therefore,tradeo?exists between them.General-ly,it is appropriate to maintain the DLP parameter at a certain range under the threshold,i.e.,b*Th i,where we de?ne0.56b61to maintain the appropriate range of DLP parameter.It should be noted that frequent rate adjustment takes the risk of network oscillations.Proper oscillation elimination method should be adopted in vari-ous QoS control schemes.
Now,we present a QoS supporting scheme which can control the QoS metric within a prede?ned threshold by continuously adjusting the data generating rate at individ-
S.Tang,W.Li/Computer Communications29(2006)2569–25772571
ual clusters.The basic idea is:if the DLP i(usually at the clusters closer to the sink)is larger than the threshold Th i,the i th cluster will decrease the data generating rate by a small delta D i.A simple implementation method is to de?ne D i by a?xed value.However,the prede?ned value is di?cult to accurately select and in such way the resulting scheme cannot adapt well to varying load.Instead of using prede?ned value,a better method would be to predict how much adjustment amount should be every time according to certain rule.Here,we directly locate our objective at the QoS requirement,and then derive an explicit solution to D i with accurate adjusting amount.
From Eq.(2),we know that DLP i is approximately pro-portional to q K i i.If the data generating rate g i is reduced to
a new value g0
i ,then DLP i will be decreased.In view of this,
we construct the following equation:
DLP ien i g0
i
tk it1TK i?Th ien i g itk it1TK i.e6TThen,we obtain
g0 i ?
n i g iàex ià1Tk it1
x ián i
;where x i?
?????????????????????
DLP i=Th i
K i p.
In order to maintain a minimum requirement for envi-
ronment monitoring,we construct a compensation factor
1i in the above equation to ensure that g0
i is not less than
the minimum data generating rate g i_min.Then,we de?ne
g0 i ?
n i g
i
à1iex ià1Tk it1
x ián i
;
where0<1i6n i g iàx i n i g i min
ex ià1Tk it1
.Note that k M+1=0.Thus,
every time the resulting new DLP i will serve as an input
for the next adjustment until returning the threshold value.
The amount of adjustment is calculated as
D i?g iàg0
i
?
ex ià1Ten i g it1i k it1T
x ián i
.e7T
The algorithm for the QoS supporting scheme with
reducing network oscillation mechanism is summarized in
Fig.2.Some simulation results for the algorithm’s execu-
tion are presented in Section5.
4.Optimal energy allocation
For a simpli?ed power consumption model of radio
communication[6,19],the energy consumed per bit in
transmission is
e b?e tete ta d ate re;e8T
where e te is the energy per bit needed by the transmitter elec-
tronics(including the cost of startup energy),e re is for the
receiver electronics,e ta is the consumption of the transmit-
ting ampli?er to send one bit over one unit distance,d is
the transmission distance,a is the path loss factor depending
on the radio frequency environment and is generally between
2and4.This basic model is used for single hop situation.It
can be extended for our multi-hop linear cluster-based WSN.
By combining Eq.(8)with the cluster-based WSN mod-
el in Fig.1,we know the energy consumed at the cluster-
head is much larger than that at individual sensing node.
The reason is as follows:(1)the cluster-head needs to relay
all the tra?c of the cluster;(2)for each data unit,the clus-
ter-head needs to transmit longer distance due to transmis-
sion between clusters,while the sensing nodes just transmit
data inside the cluster.In view of this,let c i and C i be,
respectively,the energy dissipated per data transmission
inside cluster i and between cluster i and cluster(ià1).
Let E i denote the total initial energy in the i th cluster,
i=1,2,...,M.Then the total initial energy in the network
is E?
P M
i?1
E i.With the passage of time,energy is dissipat-
ed from each cluster until one cluster runs out of its energy
after time period T,which is known as the disconnection
time or the lifetime of the network[5].Let R i(t)be the
residual energy at the i th cluster after time t,then we have
R ietT?E iàc i n i g i tàC i k i t
?
E iàec itC iTn i g i tàC i
P M
j?it1
n j g j t
Q j
k?it1
?1àp keK kT ;16i6Mà1;
E Màec MtC MTn M g M t;i?M.
8
><
>:
e9T
Let T i denote the disconnection time of the i th cluster,
then cluster i will exhaust its energy after time T i,i.e.,
R i(T i)=0.In our linear WSN model,the lifetime of the
WSN,T,is de?ned as the time period when the energy at
any one of the clusters exhausts,i.e.,T=min{T1,T2,
...,T M},since the energy exhaustion of any cluster could
lead to the failure of data transmission in the
WSN. 2572S.Tang,W.Li/Computer Communications29(2006)2569–2577
Now,we are interested in?nding an optimal energy allo-cation criterion in the WSN which maximizes the network lifetime.Note that the WSN model has the form of many-to-one data routing paradigm and the clusters closer to the sink transfer more tra?c.If the equal energy allocation pol-icy is used for each cluster,then the closest cluster(to the sink),cluster1,is always the?rst one to exhaust its energy due to the largest amount of data transmission,leading to the failure of the network.However,at this time the other clusters still have some residual energy,leading to unutilized energy in the network and a reduced value of network life-time.Naturally,the ideal(optimal)energy allocation criteri-on is to make all clusters have the same exhaustion time and thus maximizes the network lifetime.From this criterion,we can?gure out the energy distribution formula at individual clusters and the network lifetime,which are the foundation to node deployment design in WSNs.
E i?ec itC iTn i g i TtC i
X M
j?it1
n j g j T
?
Y j
k?it1
?1àp keK kT ;16i6Mà1;e10T
T?
E M
ec MtC MTn M g M
.e11T
As applications of the above results,we discuss three application situations which lead to di?erent node deploy-ments.Finally,it is worthy to note that all the above anal-ysis,though based on a linear network,can be easily extended to a planar topology.
4.1.Energy e?cient solution in homogeneous WSNs
By the above the energy distribution formula,we can quantitatively determine the energy allocation at individual clusters.The cluster closer to the sink will be allocated more energy.If homogeneous sensors are used in the WSN,that is,each sensor has the same initial energy I e, then the cluster closer to the sink should be deployed with higher node density to achieve more total initial energy.By basic mathematics from Eqs.(10)and(11),we have
n i?
C i
ec MtC MTg Màec itC iTg i
X M
j?it1
n j g
j
?
Y j
k?it1
?1àp keK kT ;16i6Mà1.e12T
The above equation determines how many sensors each cluster should have,given the number of sensors at the far-thest cluster n M.In such a way,the node deployment design issues in WSNs can be accurately and e?ectively solved.Note that the dissipated energy of total data trans-mission per unit time at the farthest cluster g M should be greater than that at any other cluster.This is intuitive since the farthest cluster usually corresponds to the most impor-tant target?eld and thus the largest data generating rate.
It is noteworthy that this scheme requires the sensing nodes in high density clusters decrease their data generat-ing rate to save energy and to reduce the tra?c load.Other-wise,more sensors will generate more data and more energy will be needed for relaying.A more practical approach is that the cluster-head in a high density cluster schedules some nodes to enter sleep mode[20]in order to reduce the tra?c load and also keep more candidates for cluster-head.
4.2.Energy e?cient solution in heterogeneous WSNs
If heterogeneous sensors are used in the WSN,that is, each sensor has di?erent initial energy I e,i,j,where i denotes the i th cluster and j denotes the j th sensor in the cluster, 16i6M,16j6n i.Then sensors with larger batteries are selected?rstly as cluster-heads,and the cluster closer to the sink should be allocated more sensors with larger batteries to achieve more total initial energy.The detailed node deployment scheme can be theoretically determined from Eqs.(10)and(11)given the speci?c application requirement is provided,however,the mathematical expression of n i is hard to be obtained.
4.3.Energy e?cient solution by radio range adjustment
From Eq.(8),we know that radio transmissions are attenuated by a path loss in a power-law with distance. The total transmission energy can be reduced by decreasing the transmission distance.Thus,in the design of network topology,especially for a homogeneous WSN,clusters near the sink should be designed with shorter relaying distances to extend their energy usage,while clusters at the periphery should have longer distance to improve the relaying e?-ciency.For example,in Fig.1,we should design the follow-ing distance relationship:d1 5.Numerical analysis In this section,we?rst present some numerical results to evaluate the performance metrics in terms of DLP,mean sojourn times at individual clusters and the maximum source-to-sink delay;then validate the QoS supporting algorithm by simulations;and?nally present some experi-mental examples to show the application of our network energy distribution formula. 5.1.Performance evaluation As discussed previously,the many-to-one data routing paradigm of WSNs inevitably leads to non-uniform tra?c distribution,which will decrease the performance of the clusters closer to the sink.A feasible solution is to reduce data generating rates in these clusters.Now,we show, respectively,the e?ect of the same and di?erent data gener-ating rate at each cluster on di?erent performance metrics by Figs.3–6,and performance comparison will be observed S.Tang,W.Li/Computer Communications29(2006)2569–25772573 naturally.The system con?guration is set as follows.There are M =4clusters involved in the considered system.The number of sensing nodes is n 1=n 2=n 3=n 4=100,and cluster-heads have service rates l 1=l 2=l 3=l 4=20and queue capacity K 1=K 2=K 3=K 4=100.The data gener-ating rates are given at di?erent ?gures. Figs.3and 4show,respectively,the e?ects of same and di?erent data generating rates on DLP at individual clus-ters.First,we observe that the DLP will increase when the data generating rate increases,and drastically increase at the cluster closer to the sink as compared with that at periphery.This is understandable as the queue capacity is ?nite,leading to increased DLP with more data generation;and the cluster closer to the sink needs to relay larger tra?c load.Next,by comparing Figs.3and 4,we ?nd,as expect-ed,the DLPs at di?erent clusters have been decreased by appropriately reducing data generating rates.The e?ect is particularly obvious in the situation of low data generating rate at each sensor. Figs.5and 6show,respectively,the e?ects of data gen-erating rates on the mean sojourn time of a data unit at individual clusters and the maximum SSD (i.e.,the delay from cluster M to the sink).As expected,when the data generating rate increases,the mean sojourn times at indi-vidual clusters will increase,and the increasing trend is gradually slow with the increase of data generating rate.This may be explained as:with the increase of data gener-ating rate,each cluster will hold more data units and each data unit will wait more time to be served;and the relaying tra?c will gradually play a dominant role at especially those clusters closer to the sink,leading to gradually small e?ect of sensing tra?c load.We also observe that the mean sojourn time at the cluster closer to the sink is much larger than that farther to the sink.This also attributes to the higher tra?c load at the cluster closer to the sink.Similar-ly,by comparing Figs.5and 6,we ?nd that both mean sojourn times and maximum SSD have been reduced by 2574 S.Tang,W.Li /Computer Communications 29(2006)2569–2577 appropriately reducing data generating rates.For example, when g=0.07,we have(E[S1]=5.0,E[S2]=4.0, E[S3]=0.17,and SSD max=9.14)in Fig.5and (E[S1]=4.5,E[S2]=0.5,E[S3]=0.14,and SSD max=5.22)in Fig.6. 5.2.QoS algorithm simulation The numerical simulation is performed under M=4 clusters,we still use the same system con?guration as that in part A.In addition,in order to see how the QoS algo-rithm behaves under di?erent tra?c conditions,we per-form the simulation under heavy load and light load, respectively.For simplicity,the acceptable QoS threshold at each cluster is assumed as Th i=10à4,i=1,2,3,4, although it can be set with di?erent value in di?erent clus-ters.The other parameters in the algorithm are set as: g i_min=10à4,b i=0.9,1i is set to be0.3at heavy load and0.95at light load.The objective is to make the DLPs in the clusters closer to the sink get back into the QoS threshold when they get out of the threshold(note that the closer clusters always break out of the QoS threshold earlier than the farther clusters due to the non-uniform tra?c distribution),and to make them go up to a certain level(i.e.,b i*Th i)when all of them are far away from the threshold.The detailed procedures of the simulation executions are shown in Figs.7and8. Fig.7shows how the algorithm performs at the heavy tra?c condition.In the beginning,the DLPs in clusters1 and2are very high,so the algorithm is performed by decreasing the data generating rates in these clusters,while keep clusters3and4with no rate adjustment(since increasing the data generating rates in clusters3and4will further increase the DLPs of clusters1and2,which have already exceeded the threshold).Then,the DLPs of clusters 1and2gradually get down through continuous rate adjust-ments until below the threshold(10à4).We also observed that the DLP of cluster2got below the threshold at the 9th adjustment and the rate did not change any more (g2=0.0175),while the rate of cluster1had to be contin-uously adjusted because the DLP was close to but not yet below the threshold.After a couple of adjusting times, g2was changed from0.0175to0.0174at the15th adjust-ment,and the DLP of cluster1eventually got below the threshold with the same rate(g1=1.0877·10à4,which is very close to g i_min).By some investigation,we found that the regular new data generating rate would be 9.8152·10à5for the15th adjustment,which is smaller than g i_min and de?nitely not be able to use.So a request for decreasing data generation was automatically sent to cluster2,leading to the decrease of g2.This validates the e?ectiveness of the algorithm. Fig.8shows how the algorithm performs at the light tra?c condition.In the beginning,the DLPs in all clusters are much lower than the threshold,so the algorithm is per-formed by increasing the data generating rate in each clus-ter.When the DLP of one of the clusters gets close to the prede?ned value(b*Th i),the algorithm will stop. 5.3.Applications of energy allocation Now,we present some experiment examples to show how to apply the energy distribution formula in the WSN design.The system con?guration is the same as that in part A.In addition,for simplicity,we set the same cluster size and the same distance between two adjacent clusters,that means each cluster has the same c i and C i.Set c i=1energy unit,C i=5energy units,and network lifetime T is set as 100time units,which may be hours,days,weeks,etc. Fig.9quantitatively shows that the energy distribution with the same data generating rate at each cluster.The energy consumption is larger for the cluster closer to the sink due to the transmission of more tra?c.Thus,in the cluster based WSN design,the cluster closer to the sink should be allocated more energy to achieve optimal energy S.Tang,W.Li/Computer Communications29(2006)2569–25772575 utilization.For our speci?c system con?guration,the quan-titative energy values at individual clusters are presented under various data generating rates.Fig.10shows the same problem with di?erent data generating rate at each cluster.Due to the intrinsic nature of non-uniform tra?c distribution in WSNs,we reduce the data generating rates of the clusters closer to the sink.By comparing Figs.9and 10,we observe that the needed energy in Fig.10is much less than that in Fig.9for maintaining the same network lifetime.This result shows that,by appropriately control-ling data generating rates at individual clusters,we can not only save energy of the network,but also provide QoS supporting through the developed algorithm under heavy tra?c condition. Figs.11and 12show an energy e?cient solution exam-ple in homogeneous WSN.By designing di?erent data gen-erating rates at individual clusters,we can ?gure out the accurate number of sensors at every cluster with optimal energy distribution (as shown in Fig.11),which is very use-ful for sensor deployment design in WSNs.Moreover,the DLP metrics at individual clusters under the designed sensor deployment also satisfy the QoS threshold,for example,at one designed deployment (n 4=180,n 3=300,n 2=367,and n 1=402),the DLPs are (DLP 4=2.732·10à45,DLP 3=3.061·10à19,DLP 2=6.236·10à9,and DLP 1=1.723·10à4).If the DLPs do not satisfy the QoS requirement,the QoS supporting algorithm will be applied.6.Conclusions We have performed the analysis of QoS supporting and optimal energy allocation issues by presenting a cluster based WSN.A QoS supporting scheme is developed for dynamic tra?c conditions by controlling data generating 2576 S.Tang,W.Li /Computer Communications 29(2006)2569–2577 rates at individual clusters and the speci?c algorithm is pre-sented and validated by numerical simulations.Besides,an explicit solution on the energy distribution at di?erent clus-ters in the WSN is investigated based on an optimal energy allocation criterion.The localized QoS controlling scheme is useful in WSNs due to?exibility and scalability.The obtained network energy distribution formula is particular-ly convenient for node deployment design in WSNs and application situations are also discussed and presented by experimental examples. Acknowledgements The authors thank the anonymous referees for the care-fully reading of the original manuscript.Their comments and suggestions have led to a much better presentation of the paper.The second author of the paper would like to acknowledge that his work is partially supported by the National Science Foundation of US with Grant No. 0515263and partially supported by the National Natural Science Foundation of China with contract No.60474067. References [1]C.-F.Chiasserini,M.Garetto,Modeling the performance of wireless sensor networks,in:IEEE INFOCOM’04,9–11March2004,Hong Kong,China. [2]J.Deng,Y.Han,W.Heinzelman,P.Varshney,Scheduling sleeping nodes in high density cluster-based sensor networks,ACM/Kluwer Mobile Networks and Applications(MONET).Special Issue on Energy Constraints and Lifetime Performance in Wireless Sensor Networks,10(6)(2005)825–835. [3]C.E.Jones,K.M.Sivalingam,P.Agrawal,J.C.Chen,A survey of energy e?cient network protocols for wireless networks,Wireless Networks7(4)(2001)343–358. [4]R.Shah,J.Rabaey,Energy aware routing for low energy ad hoc sensor networks,in:Proc.of IEEE Wireless Communications and Networking Conference(WCNC02),Orlando,FL,March2002. [5]V.Rai,R.Mahapatra,Lifetime modeling of a sensor network,in:IEEE Intl.Conf.on Design,Automation and Test in Europe(DATE)2005. [6]J.Haapola,Z.Shelby,C.A.Pomalaza-Ra′ez,P.Ma¨ho¨nen,Cross- layer energy analysis of multi-hop wireless sensor networks,in: Proceedings of the European Workshop on Wireless Sensor Net-works,Jan.31–Feb.2,2005,Istanbul,Turkey. [7]D.Chen,P.K.Varshney,QoS support in wireless sensor networks:a survey,in:Proc.of the2004International Conference on Wireless Networks(ICWN04),June2004,Las Vegas,Nevada,USA. [8]M.Younis,K.Akayya,M.Eltowiessy,A.Wadaa,On handling QoS tra?c in wireless sensor networks,in:Proc.of International Confer-ence on System Sciences(HICSS-37),Hawaii,Jan.2004. [9]K.Akkaya,M.Younis,An energy-aware QoS routing protocol for wireless sensor networks,in:Proc.of the IEEE Workshop on Mobile and Wireless Networks(MWN2003),Providence,RI,May2003. [10]M.Younis,M.Youssef,K.Arisha,Energy-aware routing in cluster- based sensor networks,in:Proc.of the10th IEEE/ACM Sym.on Modeling,Analysis and Simulation of Computer and Telecom Systems(MASCOTS’02),Fort Worth,TX,October2002. [11]L.Subramanian,R.H.Katz,An architecture for building self con?gurable systems,in:Proc.of IEEE/ACM Workshop on Mobile Ad Hoc Networking and Computing,Boston,MA,August2000. [12]J.N.Al-Karaki,A.E.Kamal,Routing techniques in wireless sensor networks:a survey,IEEE Personal Communications11(6)(2004)6–28.[13]W.R.Heinzelman, A.Chandrakasan,H.Balakrishnan,Energy- e?cient communication protocol for wireless sensor networks,in: Proc.of the33rd Hawaii International Conference on System Sciences,Jan.2000. [14]S.Lindsey,C.S.Raghavendra,PEGASIS:power e?cient gathering in sensor information systems,in:Proc.of the IEEE Aerospace Conference,Big Sky,Montana,March2002. [15]M.Kubisch,H.Karl,A.Wolisz,L.Zhong,J.Rabaey,Distributed algorithms for transmission power control in wireless sensor net-works,in:IEEE Wireless Communications and Networking Confer-ence(WCNC03),New Orleans,March2003. [16]V.Kawadia,P.R.Kumar,Principles and protocols for power control in ad hoc networks,IEEE J.Select.Areas Commun.23(1)(2005) 76–88. [17]L.Kleinrock,Queueing Systems Volume1:Theory,Wiley,New York,1975. [18]D.Bertsekas,R.Gallager,Data Networks,second ed.,Prentice-Hall, Englewood Cli?s,NJ,1992. [19]Q.Gao,K.Blow,D.Holding,I.Marshall,X.Peng,Radio range adjustment for energy e?cient wireless sensor networks,Journal of Ad Hoc Networks(2004). [20]Y.Xu,J.Heidemann, D.Estrin,Geography-informed energy conservation for ad hoc routing,in:Proceedings of ACMMobile’01, Rome,Italy,July2001,pp. 70–84. Shensheng Tang received his BS degree in Tianjin University,China in1990and MS degree in China Academy of Telecommunications Tech- nology(CATT)in1997,both in electrical engi- neering.He is presently pursuing his PhD degree in the department of electrical engineering and computer science,University of Toledo,Ohio, USA.He has over8years of industrial experience in electronics and telecommunications areas, which involves the development of electronic instruments and mobile communication base stations as well as the research related to3G TD-SCDMA and WCDMA technologies.His current research interest focuses on wireless communi-cations and networking,including wireless LANs,mobile ad hoc net-works,wireless sensor networks,3G and future generations of wireless cellular networks. Wei Li received his PhD degree from the Chinese Academy of Sciences in1994.He is currently an Associate Professor in the Department of Elec- trical Engineering and Computer Science at the University of Toledo,USA.He was once an Assistant Professor,Endowed Chair Professor in Bell South Mobility/BORSF in Telecommunica- tions at the University of Louisiana at Lafayette, and also a recipient of US Air Force Summer Faculty Fellowship.Dr.Li’s research interests are in the wireless and mobile networks,mobile ad hoc networks,wireless sensor networks and queuing networks etc.Dr.Li has published over60peer-reviewed papers in professional journals,over 20referred papers in the proceedings of professional conferences and3 books.Dr.Li is currently serving as an Editor for EURASIP Journal on Wireless Communications and Networking,for International Journal of Computer and Their Applications,for International Journal of High Performance Computing and Networking,and for International Journal of Sensor Networks.He has also served as a TPC member for some professional conferences such as IEEE ICC’05,04,02,IEEE Glob-Com’05,03,IEEE WCNC’05,04,00,IEEE WirelessCom’05,Qshine’05,04, IEEE VTC’03,etc. S.Tang,W.Li/Computer Communications29(2006)2569–25772577 对水轮机尾水管回收动能机理的认识 一、水轮机的尾水管的作用 1、将转轮出口的水流平顺地引向下游。 2、利用下游水平面至转轮出口处的高程差,形成转轮出口处的静力真空,从而利用转轮的吸出高度。 3、回收转轮出口的水流动能,将其转换为转轮出口处的动力真空,减少了转轮出口的动能损失,从而提高水轮机效率。 二、水轮机尾水管的工作原理 由能量平衡方程: 设转轮所利用的水流能量为ΔE △E= 取2—2断面为基准面,则 △E=( ) (1) (1)转轮出口没有装置尾水管 水轮机没有装置尾水管,转轮出口直接与大气相通,则 代入(1)式可得转轮所利用的能量为 (2)转轮出口装置圆柱形尾水管(如图所示) 取5—5断面为基准面,对2—2,5—5断面列能量平衡方程式, 则: 由于圆柱形尾水管出口断面面积相等, 代入上式化简得: 代入(1)式可得转轮所利用的能量为: (3)转轮出口装置扩散形尾水管 同转轮出口装置园柱形尾水管一样列能量平衡方程式,则 a p p =2()) 2(2022 1-?+-=?E h g H d υ 5 225 5 22 2 202-?++ + =+ ++h g p g p h H s υγ υγ ())2(5022 2-?+-+=?E h g H H s d υ2 2 2 + ++p h H s υ()) 2( 2022 1-?+-=?E h g H d υ())2(502 2 2-?+-+=?E h g H H s d υ 式中 由于扩散形尾水管 ,则: = 代入(1)式可得转轮所利用的能量为: 由以上可以看出: 结论: (1) 没有装置尾水管时,转轮只利用了电站总水头的部分,同时损失掉转轮出 口水流的全部动能 (2) 装置圆柱形尾水管时,与没有装置尾水管相比,此时转轮多利用了 的能量。 这一多出部分称之为静力真空,它是在圆柱形尾水管作用下,转轮出口处不再是大气压而是相应的负压,由于负压存在相当于增加了作用在转轮两 端的压力差。但水轮机仍然损失掉转轮出口水流的全部动能 (3) 装置扩散形尾水管时,除多利用了 的能量外,由于尾水管出口断面的扩散 作用,转轮出口处的流速由 降低到 ,与没有装置尾水管相比,又多 利用了部分的能量。这一部分称之为动力真空,它是在扩散形尾水 ())2( 5025 3-'?+-+=?E h g H H s d υ 齐头并进堵源治本高校校园网ARP攻击防御解决方案 DIGTIAL CHINA DIGITAL CAMPUS 神州数码网络有限公司 2008-07 前言 自2006年以来,基于病毒的arp攻击愈演愈烈,几乎所有的校园网都有遭遇过。地址转换协议ARP(Address Resolution Protocol)是个链路层协议,它工作在OSI参考模型的第二层即数据链路层,与下层物理层之间通过硬件接口进行联系,同时为上层网络层提供服务。ARP攻击原理虽然简单,易于分析,但是网络攻击往往是越简单越易于散布,造成的危害越大。对于网络协议,可以说只要没有验证机制,那么就可以存在欺骗攻击,可以被非法利用。下面我们介绍几种常见ARP攻击典型的症状: ?上网的时候经常会弹出一些广告,有弹出窗口形式的,也有嵌入网页形式的。下载的软件不是原本要下载的,而是其它非法程序。 ?网关设备ARP表项存在大量虚假信息,上网时断时续;网页打开速度让使用者无法接受。 ?终端不断弹出“本机的XXX段硬件地址与网络中的XXX段地址冲突”的对话框。 对于ARP攻击,可以简单分为两类: 一、ARP欺骗攻击,又分为ARP仿冒网关攻击和ARP仿冒主机攻击。 二、ARP泛洪(Flood)攻击,也可以称为ARP扫描攻击。 对于这两类攻击,攻击程序都是通过构造非法的ARP报文,修改报文中的源IP地址与(或)源MAC地址,不同之处在于前者用自己的MAC地址进行欺骗,后者则大量发送虚假的ARP报文,拥塞网络。 图一 ARP仿冒网关攻击示例 神州数码网络秉承“IT服务随需而动”的理念,对于困扰高教各位老师已久的ARP 攻击问题,结合各个学校网络现状,推出业内最全、适用面最广、最彻底的ARP整体解决方案。 神州数码网络公司从客户端程序、接入交换机、汇聚交换机,最后到网关设备,都研发了ARP攻击防护功能,高校老师可以通过根据自己学校的网络特点,选取相关的网络设备和方案进行实施。 S5600系列交换机典型配置举例 2.1.1 静态路由典型配置 1. 组网需求 (1)需求分析 某小型公司办公网络需要任意两个节点之间能够互通,网络结构简单、稳定, 用户希望最大限度利用现有设备。用户现在拥有的设备不支持动态路由协议。 根据用户需求及用户网络环境,选择静态路由实现用户网络之间互通。 (2)网络规划 根据用户需求,设计如图2-1所示网络拓扑图。 图2-1 静态路由配置举例组网图 2. 配置步骤 交换机上的配置步骤: # 设置以太网交换机Switch A的静态路由。 [SwitchB] ip route-static 1.1.1.0 255.255.255.0 1.1.3.1 # 设置以太网交换机Switch C的静态路由。 神州数码交换机路由器命令汇总(部分) 2016年3月23日星期三修改_________________________________________________________________________ 注:本文档命令为最简命令,如不懂请在机器上实验 注:交换机版本信息: DCRS-5650-28(R4) Device, Compiled on Aug 12 10:58:26 2013 sysLocation China CPU Mac 00:03:0f:24:a2:a7 Vlan MAC 00:03:0f:24:a2:a6 SoftWare Version 7.0.3.1(B0043.0003) BootRom Version 7.1.103 HardWare Version 2.0.1 CPLD Version N/A Serial No.:1 Copyright (C) 2001-2013 by Digital China Networks Limited. All rights reserved Last reboot is warm reset. Uptime is 0 weeks, 0 days, 1 hours, 42 minutes 路由器版本信息: Digital China Networks Limited Internetwork Operating System Software DCR-2659 Series Software, Version 1.3.3H (MIDDLE), RELEASE SOFTWARE Copyright 2012 by Digital China Networks(BeiJing) Limited Compiled: 2012-06-07 11:58:07 by system, Image text-base: 0x6004 ROM: System Bootstrap, Version 0.4.2 Serial num:8IRTJ610CA15000001, ID num:201404 System image file is "DCR-2659_1.3.3H.bin" Digital China-DCR-2659 (PowerPC) Processor 65536K bytes of memory,16384K bytes of flash Router uptime is 0:00:44:44, The current time: 2002-01-01 00:44:44 Slot 0: SCC Slot Port 0: 10/100Mbps full-duplex Ethernet Port 1: 2M full-duplex Serial Port 2: 2M full-duplex Serial Port 3: 1000Mbps full-duplex Ethernet Port 4: 1000Mbps full-duplex Ethernet Port 5: 1000Mbps full-duplex Ethernet Port 6: 1000Mbps full-duplex Ethernet 拥有SPA水疗机15 大好处 第1它是孩子的水中乐园:水的浮力和压力可锻炼孩子的心肺功能,水的温度可促进骨骼再生,水的气泡拍打可刺激神经促进大脑发育,强健骨骼,提高记忆力,使孩子聪明活泼的健康成长。 第2它是女人的美容院:水疗让女人肌肤美白、淡斑、美体塑身、净血排毒、生殖美疗,更加自信、漂亮、有魅力。 第3它是男人的健身房:水疗让男人减轻压力、消除疲劳、精力充沛、补充能量、强化机能,成为男人中的男人。 第4它是爸妈疗养中心:水疗可增强运动,提高免疫力、活化细胞、补充氧气、疏通经络、促进血液循环、新陈代谢,让爸妈健康的生活、延缓衰老、避免疾病、延年益寿。 第5它是一个全新的空气净化机:让我们全家人呼吸上森林里、大海边、瀑布前,高品质的新鲜空气,回归自然。 第6它是一个成本最低的净水机:让我们全家人喝上无菌、无毒、含氧量高的活氧水,节能环保,经济实惠。 第7它是一个多功能洗菜机:降解农药、分解毒素让我们全家人吃上安全、绿色,无农药残留的放心食品,病从口入,把好第一关。第8它是一个全自动洗澡机:让我们全家人享受国际水疗、科技时尚、拍打细胞、自动清洁,补氧补血、运动健身全新的洗澡方式。第9它是一个消毒洗衣机:让我们全家人穿上无菌、无化学残留,环保健康的衣服 第10它是一个懒人跑步机:让我们全家人泡澡15分钟,相当于慢跑3—5公里,生命在于运动,解决大部分人没时间运动,不持续运动,不懂得运动,实现“你不动,水来动”的水疗运动方式。 第11它是一个专业按摩机:做水疗3—5分钟,相当于专业按摩1 小时,可按摩全身所有穴位及五脏六腑,称之“内按摩” 第12它是一个深层排毒机:水疗是21世纪排毒最好的一种方法,可把人体多年累积的毒素、毒垢,由内到外,通过毛孔排出来的汗 液又咸、又苦、又涩,水的颜色甚至会变黄、变黑、变绿。 第13它是一个辅助治疗机:经过百人体验调查见证,对高血压、风湿、类风湿、前列腺炎、妇科病、皮肤病、痔疮、肩周炎、便秘、失眠、淡斑、手脚冰凉、美体瘦身、提高免疫力等有明显改善效果。第14它是一个预防疾病长寿机:水疗是现代人健康管理的最好方式,也是全家的保护伞,可为全身的每个细胞输送健康能量,打通 人体的四大循环系统,“气、血、水、淋巴”,中医讲“气血畅通, 百病不生”。医生建议:亚健康人群,经常水疗,不易引发各类疾病。一次性投资,全家享受,一天一元钱,每天15分钟,让人舒爽一整天,洗出美丽,洗出健康、洗出财富。 第15它是一个时代趋势的商机:这是一个崭新的行业,这是一个惊人的项目,这是一个体验完人人都说好的产品,这是一个竟争最小、投资最少、空间最大、风险最低、前景最好的机遇,这是一个 风靡全球的家用电器,它以卓越的功能和神奇的功效将成为专家、 教授、医生关注的焦点,即将在中国崛起之商机,它正在悄悄的改 变着人们的生活,它让我们走进了跨世纪的财富时代。它的问世必 将震惊“医疗界、美容界、养生界”,它让世人对“健康”二字重新定位,倡导家庭健康水疗,普及全民水疗文化,它是一种潮流浴室 革命,让世界的浴室动起来。 第一篇水力机械 第一章绪论 动能水轮发电机 水流能量机械能电能 势能水泵电动机 水水轮机+发电机————> 水轮发电机组。功能:发电 轮水泵+电动机————> 水泵抽水机组。功能:输水 机水泵+水轮机————> 抽水蓄能机组。功能:抽水蓄能 本篇重要内容:水轮机(turbine) 水轮机是将水能转变为旋转机械能,从而带动发电机发出电能的一种机械,是水电站动力设备之一。研究的目的是充分利用水能资源,为厂房布置设计作准备。 第一章水轮机的主要类型、构造及其工作原理 §1.1 水轮机的工作参数(working parameters) 一、基本概念 水流经引水道进入水轮机,由于水流和水轮机的相互作用,水流便把自己的能量传给了水轮机,水轮机获得能量后开始旋转作功。 水流流经水轮机时,水流能量发生改变的过程——水轮机的工作过程。反映水轮机工作状况特性值的一些参数,称水轮机的基本参数。 由水能出力公式: N=9.81QHη 可知,其基本参数包括:工作水头H、流量Q、出力N、效率η,此外还有工作力矩M、机组转速n。 二、工作 水头 (working head) 如图所 示,A—A为引 水道进口,B— B为水轮机进口,C—C为尾水管出口,D—D为尾水渠。根据能量方程可以推导出: 1、水电站的毛水头(nominal productive head) H m=E A-E C=Z A+H A=Z上—Z下 2 、水轮机的工作水头(working head) H G=E B - E D=H M - h A-B 毛水头- 水头损失=净水头(即水轮机的工作水头) 3 、特征水头(characteristic head) 水轮机的工作水头随上下游水位而变化,因此提出特征水头的概念,用于表示水轮机的运行工况和运行范围。特征水头一般由水能规划计算确定。 最大工作水头: H max=Z正—Z下min—h A-B Z正为上游正常设计水位,Z下min为下游最低水位,一般取一台机组发电时下游水位。 最小工作水头: H min=Z死—Z下max—h A-B 1,天泉鼎丰空气鲜榨水简介 水是生命之源,在我们的日常生活中是不可或缺的,它是大自然给予我们人类的礼物,在科技越来越发达的同时,水质污染问题也越来越严重,要想喝到放心又安全的饮用水,我们做了很多努力,发明了电解制水机,很好的解决了饮用水的安全问题,通过科技与自然的完美结合,使用电解制水机更好的为人类服务,出放心又安全的人类饮用水。 ——节能,不使用任何水资源,自主生产安全饮用水; ——环保,低耗电量和低碳排放,亦可配备零风力发电、太阳能发电设备,有效改善环境污染、缓解水资源污染匮乏问题; ——健康,微电脑控制自动灭菌、活水循环系统,去除溶解盐类、胶体、微生物、有机物等高达99.9%,生产出高品质的健康美容活水好水。 ——智能,人工智能系统操作使用便捷,一机涵盖生产饮用水和净化空气的双重功能,有效改善营造生活宜居环境和条件。 ——经济,日常实用率高,一次性投入,制水成本低; ——安全,根据不同环境自动启用智能产水系统,配备家用保护系统避免儿童老人热水烫伤。 ——适用广泛,规模大小可根据民用和企业所需而定,一次性投入节省资金,特别是解决海岛、边防哨所、矿山、偏远地区、机关、学校、美容院等用水需求。 2,天泉鼎丰空气鲜榨水的功能特点: 以自来水为原水的自来水终端处理饮水机。安全、方便、廉价进入千家万户的健康水机。 以健康水理论为基础研发的。符合健康水理念的、有生命力的高科技产品。回归天然、把世界长寿村的水接到家!含大量、钾、镁等矿物质,补充营养,增强体能。天泉鼎丰制水机在自来水原水的基础上,再经净化、活化、矿化完整处理的具有自然活性的、符合人体生理需要的小分子团水。吸收快,渗透性强,促进新陈代谢。PH值呈现弱碱性,排除体内酸性废物,维护体液酸碱平衡。负电位、抗氧化,让细胞更有活力。 1.人工智能控制系统 全电脑自动中央总控系统,全自动24小时监控运行。 2. 鲜榨空气水 低碳环保的大气甘露转化系统,“零防腐、零添加、零用水”将空气转化为安全饮用水。 3. 大气H2O转化系统 将空气中的水分子转化为弱碱性、无重金属、含矿物质的天然健康饮用水,达世界卫生组织最高标准。 4. 航天科技反渗透过滤系统 顶级过滤级别达至0.0001微米。一次性深层净化水中的镁、细菌、有机物、无机物、金属离子和放射性物质等。 5. 九层纳米过滤系统 以纯物理方式通过9层过滤,去除水中的铁锈、灰尘、余氯、有害的重金属离子、细菌和病毒。 6. 活水循环系统 360度全自动活水循环系统,有效保持水分子活性及自然流动性,利用智能科技转化水能量进行生命运动。 7. 三层紫外光消毒系统 无需化学药品,不会产生任何毒副产物。杀菌无臭味,无噪声,保持 通过在外网口配置nat基本就OK了,以下配置假设Ethernet0/0为局域网接口,Ethernet0/1为外网口。 1、配置内网接口(E t h e r n e t0/0):[M S R20-20]i n t e r f a c e E t h e r n e t0/0 [M S R20-20 2、使用动态分配地址的方式为局域网中的P C分配地址[M S R20-20]d h c p s e r v e r i p-p o o l 1 [M S R20-20-d h c p-p o o l-1]n e t w o r k2 4 [M S R20-20 [M S R20-20 3、配置n a t [M S R20-20]n a t a d d r e s s-g r o u p1公网I P公网I P [MSR20-20]acl number 3000 [MSR20-20-acl-adv-3000]rule 0 permit ip 4、配置外网接口(Ethernet0/1) [MSR20-20] interface Ethernet0/1 [MSR20-20- Ethernet0/1]ip add 公网IP [MSR20-20- Ethernet0/1] nat outbound 3000 address-group 1 5.加默缺省路由 [MSR20-20]route-stac 0.0.0外网网关 总结: 在2020路由器下面, 配置外网口, 配置内网口, 配置acl 作nat, 一条默认路由指向电信网关. ok! Console登陆认证功能的配置 关键词:MSR;console; 一、组网需求: 要求用户从console登录时输入已配置的用户名h3c和对应的口令h3c,用户名和口令正确才能登录成功。 二、组网图: 三、配置步骤: 第一部分交换机配置 一、基础配置 1、模式进入 Switch> Switch>en Switch#config Switch(Config)#interface ethernet 0/2 2、配置交换机主机名 命令:hostname <主机名> 3、配置交换机IP地址 Switch(Config)#interface vlan 1 Switch(Config-If-Vlan1)#ip address 10.1.128.251 255.255.255.0 Switch(Config-If-Vlan1)#no shut 4、为交换机设置Telnet授权用户和口令: 登录到Telnet的配置界面,需要输入正确的用户名和口令,否则交换机将拒绝该Telnet用户的访问。该项措施是为了保护交换机免受非授权用户的非法操作。若交换机没有设置授权Telnet用户,则任何用户都无法进入交换机的Telnet配置界面。因此在允许Telnet方式配置管理交换机时,必须在Console的全局配置模式下使用命令username 劲爆饮水机十大品牌,黑马能量源 如今社会,饮水机已经成为一个家庭必备的电器,一台好的饮水机,能让一个家庭活得健康,现如今饮水机种类繁多,市场上各种各样的品牌充斥其中,饮水机十大品牌却是变幻莫测,想买一台好的水机,确实不容易,那么现在,让我们看看饮水机十大品牌有什么优势。 我们目前只考虑国内产品,因为中国的饮水机产品不比国外的差,所以,我们优先考虑中国饮水机十大品牌。第一个说到的饮水机十大品牌,是能量源,可能很多人会吃惊,为什么是它,能量源是一个高科技产品品牌,是饮水机最新一代能量产品,完全抛弃了纯净水和活水的弊端,成为最好、最安全、最有营养的引用水。能量源的总部沃鑫国际有限公司总部在香港,市场部在上海,在全国享有非常高的声誉。这时候来回答一下很多人心中的疑问,为什么是饮水机十大品牌之首是能量源,其他譬如美的、沁园、海尔之类的大品牌却不是,其实,这个问题很简单,因为美的、沁园之类的饮水机都是净水器,而能量源却是整水机,两者有质的区别。饮水机十大品牌之首非净水器,净水器无矿物质、无微量元素,是酸性、大分子团、干净的死水,说得通俗一点,就是这水对身体无益,反而会损失人体内的营养元素,而整水机不仅干净、有活性、有营养,能彻底解决水垢的烦恼,避免结石病的发生,而且有能量,能快速排除酸毒,抵抗氧化,延缓衰老,并可排查细胞障碍,整水机的优点显而易见,当然了,如果大家非要觉得美的之类的净水器品牌好,那也没办法,不过有科学实验证明,净水不健康。饮水机十大品牌,能量源能上位,靠的不是打广告,而是赢得用户的信任,一传十,十传百,能量源才能打出一片市场。 饮水机十大品牌就功能而言,美的、沁园等较能量源差太多了,首先,净水器没有从用户角度考虑,单单把水净化干净,没有给它提供矿物质和微量元素等,这是很糟糕的,是对用户的不负责任,能量源就是从这一角度,给消费者提供健康、安全、有营养的饮用水,所以,饮水机十大品牌,美的之类只能靠边站,为老百姓考虑,能量源是一匹值得尊敬的大黑马。 1.下列应用使用TCP连接的有(本题3项正确) A.Telnet B.BGP C.FTP D.TFTP 2.TCP和UDP协议的相似之处是 A.传输层协议 B.面向连接的协议 C.面向非连接的协议 D.其它三项均不对 3.下列应用使用UDP连接的有(本题3项正确) A.TFTP B.Syslog C.SNMP D.HTTP 4.第一个八位组以二进1110开头的IP地址是()地址 A.Class A B.Class B C.Class C D.Class D 5.下面哪些不是ICMP提供的信息 A.目的地不可达 B.目标重定向 C.回声应答 D.源逆制 6.C类地址最大可能子网位数是 A.6 B.8 C.12 D.14 7.()协议是一种基于广播的协议,主机通过它可以动态的发现对应于一个IP地址的MAC地址 A.ARP B.DNS C.ICMP D.RARP 8.IP地址为子网掩码为的地址,可以划分多少个子网位,多少个主机位 A.2,32 B.4,30 C.254,254 D.2,30 9.关于IPX的描述正确的是(本题3项正确) A.IPX地址总长度为80位,其中网络地址占48位,节点地址占32位 B.IPX地址总长度为80位,其中网络地址占32位,节点地址占48位 C.IPX是一个对应于OSI参考模型的第三层的可路由的协议 D.NCP属于应用层的协议,主要在工作站和服务器间建立连接,并在服务器和客户 机间传送请求和响应 10.在无盘工作站向服务器申请IP地址时,使用的是()协议 A.ARP B.RARP C.BOOTP D.ICMP 11.以太网交换机的数据转发方式可以被设置为(本题2项正确) A.自动协商方式 B.存储转发方式 C.迂回方式 D.直通方式 12.当交换机检测到一个数据包携带的目的地址与源地址属于同一个端口时,交换机会怎样处理? A.把数据转发到网络上的其他端口 B.不再把数据转发到其他端口 C.在两个端口间传送数据 D.在工作在不同协议的网络间传送数据 13.下面哪个标准描述了生成树协议 A. B. C. D. 14.下列有关端口隔离的描述正确的是:(本题2项正确) A.DCS-3726B出厂时即是端口隔离状态,所有端口都可以与第一个端口通信,但之 间不可以互通 B.DCS-3726S可以通过配置实现与3726B一样的端口隔离功能,但出厂默认不时隔 离状态 C.可以通过配置私有VLAN功能实现端口隔离 D.可以通过配置公用端口实现端口隔离 15.下列关于静态配置链路聚合和动态配置链路聚合的理解正确的是: A.静态配置链路聚合需要在聚合组的每个聚合端口中进行配置 B.动态配置链路聚合只需要在主端口中配置一次,在全局模式中配置启用lacp协 议即可 C.静态配置链路聚合不能进行负载均衡 D.动态配置链路聚合不需要配置聚合组号,交换机会根据目前聚合组的情况自动 指定 16.网络接口卡(NIC)可以做什么? A.建立、管理、终止应用之间的会话,管理表示层实体之间的数据交换 B.在计算机之间建立网络通信机制 C.为应用进程提供服务 D.提供建立、维护、终止应用之间的会话,管理表示层实体之间的数据交换17.以下关于以太网交换机的说法哪些是正确的? 操作手册 IP路由分册 IPv6 静态路由目录 目录 第1章 IPv6静态路由配置......................................................................................................1-1 1.1 IPv6静态路由简介.............................................................................................................1-1 1.1.1 IPv6静态路由属性及功能........................................................................................1-1 1.1.2 IPv6缺省路由..........................................................................................................1-1 1.2 配置IPv6静态路由.............................................................................................................1-2 1.2.1 配置准备..................................................................................................................1-2 1.2.2 配置IPv6静态路由...................................................................................................1-2 1.3 IPv6静态路由显示和维护..................................................................................................1-2 1.4 IPv6静态路由典型配置举例(路由应用).........................................................................1-3 1.5 IPv6静态路由典型配置举例(交换应用).........................................................................1-5 路由 ssh aaa authentication login ssh local aaa authentication enable default enable enable password 0 123456 username admin password 0 123456 ip sshd enable ip sshd auth-method ssh ip sshd auth-retries 5 ip sshd timeout 60 TELNET R1_config#aaa authentication login default local R1_config#aaa authentication enable default enable R1_config#enable password 0 ruijie R1_config#line vty 0 4 R1_config_line#login authentication default R1_config_line#password 0 cisco 方法2,不需要经过3A认证 R1_config#aaa authentication login default none R1_config#aaa authentication enable default enable R1_config#enable password 0 cisco R1_config#line vty 0 4 R1_config_line#login authentication default CHAP认证单向认证,密码可以不一致 R2_config#aaa authentication ppp test local R2_config#username R2 password 0 123456 R2_config_s0/2#enc ppp R2_config_s0/2#ppp authentication chap test R2_config_s0/2#ppp chap hostname R1 R1_config#aaa authentication ppp test local R1_config#username R1 password 0 123456 R1_config_s0/1#enc ppp R1_config_s0/1#ppp authentication chap test R1_config_s0/1#ppp chap hostname R2 蓄能器的基本功能 蓄能器的基本功能 蓄能器的功用主要分为存储能量、吸收液压冲击、消除脉动和回收能量等。 2.1 存储能量 这一类功用主要应用蓄能器能够较大量存储能量的功能。在实际使用中又可细分为作辅助动力源、减小装机容量、补偿泄漏、作紧急动力源以及构成恒压油源等。 2.1.1 作辅助动力源 典型液压源回路见图2-1,带蓄能器的液压源回路见图2-2。 图2-1 一般液压源回路图2-2 带蓄能器的液压源回路 两种回路从表面看仅为是否有蓄能器的差别,两种回路的性能差别却非常大。蓄能器作为能量储存装置在液压源回路中出现,其主要用途是作为辅助油源,该回路经常在间歇性操作工况的液压系统中被采用。液压源回路中安装蓄能装置,在减小液压泵的驱动功率、节约能源、降低噪声、消除肪动、降低设备运行成本等方面效果非常明显;另一方面还可以提高液压系统的安全性和可靠性,一旦发生故障或停电时,还可以作为应急动力源,促使主机恢复到安全状态,避免重大事故的发生。 这类回路在液压系统工作时能补充油量,减少液压油泵供油,降低电机功率,减少液压系统尺寸及重量,节约投资。常用于间歇动作,且工作时间很短;或在一个工作循环中速度差别很大,要求瞬间补充大量液压 油的场合。 典型辅助能源回路如图2-3所示。液压机液压系统中当模具接触工作慢进及保压时,部分液压油储入蓄能器;而在冲模快速向工件移动及快速退回时,蓄能器与泵同时供油,使液压缸快速动作。 对于图2-4所示的回路,调节节流阀,可以控制油缸运动速度,低速时系统压力波动很小,油泵保持卸荷状态,由蓄能器提供压力油,蓄能器成为动力源,驱动油缸运动。 图2-4 蓄能器为动力源的回路 负电位能量水有什么作用? 2010-07-28 16:54:29| 分类:默认分类|字号大中小订阅 氧化反应电位(又称ORP)是物质氧化或还原性质的一种表示,即氧化和还原反应,氧化还原对于净化时去除氰化物,铬酸盐,亚硝酸盐非常重要,凡是能释放一个或多个电子的物质称之为还原剂,获得电子的是氧化剂,因此,在还原反应中电子数目增加,在氧化反应中电子数目减少。ORP值是水溶液氧化还原能力的测量指标,其单位是mv。离子化水ORP值呈现较低值和负值,而普通水的ORP值呈较高值。 负电位水的保健作用机理有以下几点: 1.负电位水的PH值偏碱性,它有利于平衡人体内由于过度劳累(精神和体力)产生的血乳酸,使人尽快恢复疲劳; 2.负电位的水,水中离子钙含量较高,这是一种有益于人体的健康元素; 3.由于负电位水的溶解度较高,渗透力较强,对油脂有一定的乳化能力,因此有利于缓解由于高蛋白,高热量饮食引起的高血脂、高胆固醇、高血粘度等症状; 4.更重要的是低电位或负电位的水(ORP从0~负200mv),它可以平衡人体在新陈代谢过程中产生的过氧化自由基,提高SOD的活力以及消除过氧化脂质的降解物丙二醛(MDA),使细胞始终充满活力保持健康,负离子可以帮助人体清除有害的氰化物、铬酸盐、亚硝酸盐以及重金属和惰性金属,由于上述一些因素以及综合作用,使得负电位的水成为一种具体保健作用的饮用水。 实践证明:长期饮用负电位的水对一些“富贵病”,如糖尿病、高血脂、高血粘度、高胆固醇、泌尿系统结石以及疲劳、失眠、便秘、单纯肥胖等等都有一定的保健康复作用。 在自然界中存在的好水大部分只能符合前四项标准,而天年多功能制水机所生产出的碱性离子水却能满足健康饮用水的五大标准,其中最关键的是天年多功能制水机生产出的碱性离子水含有较高的负电位。负电位对于人体的健康是非常重要的,人体内负电位减少的话,身体会感到不舒服。其实人本是由无数的细胞所形成的,每个细胞均被细胞膜所包起来,对人体细胞而言,如同是一个电容器,细胞内带负电,细胞膜外带正电,如使体内储存大量负电位能量,便可平衡对人体有害的正离子,因此,长期饮用带有负电位的碱性离子水会使体液由酸性恢复到弱碱性。 如果负电位少时,正离子就会增加,而正离子增加时,就会引起养分的吸收及排出废物的困难,此种现象称为新陈代谢不好,引起生理机能的衰退。因此,每天补充身体内的正负电位是非常重要的。而最为简捷有效的方法就是长期饮用带有负电位的碱性离子水,清除体内垃圾,饮用水中负电位越低,对于体内垃圾的清除效果越好。常饮天年离子水补充身体负电位,有效清洁身体内环境,喝出健康来。(水是生命之源。饮水是健康的关键,而只有饮用健康的水才能达到健康的目的。世界卫生组) 本篇文章来自百拇医药网 原文链接:https://www.360docs.net/doc/219145255.html,/html/DirDu/2004/06/10/82/23/95.htm 在自然界中存在的好水大部分只能符合前四项标准,而天年多功能制水机所生产出的碱性离子水却能满足健康饮用水的五大标准,其中最关键的是天年多功能制水机生产出的碱性离子水含有较高的负电位。负电位对于人体的健康是非常重要的,人体内负电位减少的话,身体会感到不舒服。其实人本是由无数的细胞所形成的,每个细胞均被细胞膜所包起来,对人体细胞而言,如同是一个电容器,细胞内带负电,细胞膜外带正电,如使体内储存大量负电位能量,便可平衡对人体有害的正离子,因此,长期饮用带有负电位的碱性离子水会使体液由酸性恢复到弱碱性。 如果负电位少时,正离子就会增加,而正离子增加时,就会引起养分的吸收及排出废物的困难,此种现象称为新陈代谢不好,引起生理机能的衰退。因此,每天补充身体内的正负电位是非常重要的。而最为简捷有效的方法就是长期饮用带有负电位的碱性离子水,清除体内垃圾,饮用水中负电位越低,对于体内垃圾的清除效果越好。常饮天年离子水补充身体负电位,有效清洁身体内环境,喝出健康来。(水是生命之源。饮水是健康的关键,而只有饮用健康的水才能达到健康的目的。世界卫生组) 本篇文章来自百拇医药网 原文链接:https://www.360docs.net/doc/219145255.html,/html/DirDu/2004/06/10/82/23/95.htm 世界卫生组织规定的人类饮水水六大标准:①干净的水——不含病菌、杂质、有机物重金属等的水;②营养的水——含有适当比例矿物质及微量元素,且以离子状态存在;③弱碱性水——PH值为7.2-8.5;④小分子团水——渗透性强,溶解性好;⑤负电位的水⑥富含溶解氧的水。——( 1. 基本配置: 开启SSH服务:debug ssh-server 设置特权模式密码:enable password [8] 计水轮机尾水管回收能量的认识与尾水管简单设计
神码网络设备防ARP
H3C S5600系列交换机典型配置举例
神州数码交换机路由器命令汇总(最简输入版)
拥有水疗机的15大好处
水力机械介绍
制水机简介、特点、原理和制水流程
H3C路由器配置实例
神州数码配置命令总结 (已更新)
饮水机十大品牌
神州数码模拟试题
H3C IPv6 静态路由配置
神州数码路由交换配置命令(全)
蓄能器的基本功能
负电位能量水有什么作用
DCN配置命令