Accuracy and robustness of Kinect pose estimation in the context of coaching of elderly population
Accuracy and Robustness of Kinect Pose Estimation in the Context of Coaching of Elderly Population
ˇStˇe p′a n Obdrˇz′a lek1,Gregorij Kurillo1,Ferda O?i1,Ruzena Bajcsy1,
Edmund Seto2,Holly Jimison3and Michael Pavel3
Abstract—The Microsoft Kinect camera is becoming in-creasingly popular in many areas aside from entertainment, including human activity monitoring and rehabilitation.Many people,however,fail to consider the reliability and accuracy of the Kinect human pose estimation when they depend on it as a measuring system.In this paper we compare the Kinect pose estimation(skeletonization)with more established techniques for pose estimation from motion capture data, examining the accuracy of joint localization and robustness of pose estimation with respect to the orientation and occlusions. We have evaluated six physical exercises aimed at coaching of elderly population.Experimental results present pose estima-tion accuracy rates and corresponding error bounds for the Kinect system.
I.I NTRODUCTION
Observation of human activity through various sensor technologies is becoming increasingly popular in applica-tions of remote healthcare delivery and disease management. Until recently,the motion capture systems with active or passive markers have been used predominantly in the study of human movement kinematics where one is interested in the temporal advances of joint position or angles.The motion capture systems,however,have been due to their size and cost limited to biomechanics or kinesthetic laboratories rather than physician’s of?ces,therapy out?ts,or even homes.The human motion can also be measured through various vision based cameras using marker-based or marker-less methods to extract the kinematics.
Recently released Microsoft Kinect camera[1],primarily intended as a human natural interface for the Microsoft gaming system XBox360,has found itself in the mainstream of development of low-cost alternatives for rehabilitation and movement analysis.The Kinect camera captures depth and color images with30frames per second(fps),generating a cloud of three-dimensional(3D)points from an infra-red pattern projected onto the scene.The Kinect Software Development Kit(SDK)features real-time tracking of human limbs for the gesture-based interaction.The underlying body tracking algorithm[2],which was trained on a large dataset of depth-images from able bodied users for in-game inter-actions,has several assumptions,such as users are standing, 1ˇS.Obdrˇz′a lek,G.Kurillo,F.O?i and R.Bajcsy are with Department of Electrical Engineering and Computer Sciences,University of California at Berkeley,Berkeley CA94720,USA(xobdrzal,gregorij, fofli,bajcsy)@https://www.360docs.net/doc/3e3601117.html,
2E.Seto is with School of Public Health,University of California at Berkeley,Berkeley CA94720,USA(seto@https://www.360docs.net/doc/3e3601117.html,
3H.Jimison and M.Pavel are with Oregon Health&Science University, Portland OR97239,USA(jimisonh,pavelm)@https://www.360docs.net/doc/3e3601117.html, the view is unobstructed,assumes an able bodied user(e.g. not in a wheelchair),body limbs are away from the trunk and not interacting with objects.
When applying the Kinect system to human pose estima-tion in a context other than gaming,it is important to examine the accuracy and robustness of the algorithms.In our work we are planning to use the Kinect system for observation and on-line feedback for coaching elderly people.In the paper we compare the Kinect pose estimation with more established techniques for pose estimation from motion capture data and analyze the accuracy and robustness.We report pose estimation accuracy rates and corresponding error bounds for a set of representative exercises,including upper and lower extremities,in standing and sitting position.
II.R ELATED W ORK
The3D depth accuracy of the Kinect camera has been evaluated quite extensively[3],[4]showing that after calibra-tion,the camera can provide accuracy of depth reconstruction in the order of1-4cm at the range of1-4m.On the other hand,the accuracy of the joint positions from the Kinect pose estimation has not been evaluated previously. Several studies have recognized the advantages of using an inexpensive depth camera,such as the Microsoft Kinect, for rehabilitation and assessment of body function.Stone and Skubic[5]have used several Kinect cameras to measure temporal and spatial gait parameters for in-home assessment. In their study they compared parameters obtained from the Kinect with parameters obtained from a motion capture system;however,they were only interested in determining position of the feet and not whole body.Huang[6]developed Kinerehab system based on the Kinect camera to assist rehabilitation of patients with muscle atrophy and cerebral palsy,however,no evaluation of the accuracy was presented. Lange et al.[7]presented an interactive game-based re-habilitation tool aimed at improving the balance in adults after neurological injury.The system was applied in a pilot study to evaluate the acceptability of Kinect-based therapy, however,no report was given on the accuracy of the results. More extensive evaluation of an alternative open source pose estimation algorithm,Flexible Action and Articulated Skeleton Toolkit(FAAST),was presented by Schonauer et al.
[8]who used the Kinect for real-time feedback in treadmill-based training.The authors compared position of hands and feet using motion capture and Kinect,reporting errors in the range of5-7cm.Up to date we have not found any
evaluations done on the of?cial Microsoft Kinect SDK pose estimation.
We recognize that the accuracy of the body tracking to great extent depends on the type of poses being observed, distance form the sensor and possible occlusions.Due to size limitation of the paper,we focus on six exercises that are more challenging for the pose estimation algorithm since the subject is either seated or positioned next to a chair.The tracking in seating position is especially relevant in a rehabilitation context as users may be bounded to a wheelchair.
III.A CQUISITION S YSTEMS
We have simultaneously captured human poses using a marker-based motion capture system Impulse(PhaseSpace Inc.,[9])and the Microsoft Kinect.Impulse motion capture system is capable of tracking3D location of active LED markers(with unique IDs)with the frequency of480Hz and sub-millimeter accuracy.We used nine infra-red cameras positioned in a circular fashion to cover workspace of about3 m×3m×3m.We have built a custom tight-?tting motion capture suit containing43markers roughly positioned at standard body landmarks.A skeletonization process then?ts the recorded3D marker data with an articulated kinematic chain corresponding to human body.
We have applied two different skeletonization methods using commercial software.In the?rst method,using Phase-Space Recap software,the skeletons are generated at the time of data acquisition.A two-step calibration procedure is required prior to the acquisition:(a)the markers are manually mapped to the corresponding limbs of a prede?ned skeleton structure and(b)the limb lengths are estimated based on a training procedure.The procedure requires the subject to perform a range of circular movements,one joint at a time (ankles,knees,hips,wrists and elbows).
The second skeletonization was done of?ine using Au-todesk MotionBuilder software[10].The calibration pro-cedure here was similar to Recap:after the markers were manually associated with different sections of human body, a generic human model had to be adjusted to the captured LED positions by scaling,translating,and rotating the model and its segments.As opposed to Recap,the second step requires manual interaction with the virtual model.One of the drawbacks of the MotionBuilder pose estimation algorithm is in its inability to robustly handle missing or imprecise marker measurements.
Compared to the marker-based system,the Kinect works with much denser but less precise3D data.A matrix of 320x240depth measurements with precision in the cen-timeter range is captured and used for the skeletonization. The pose estimation algorithm is fully automatic and does not require,nor allow,any user interaction,calibration or correction.
In our experiments we have used a single Kinect camera positioned at about3m distance from the subject–a minimum distance needed to see whole body of a human. Poses were captured at30
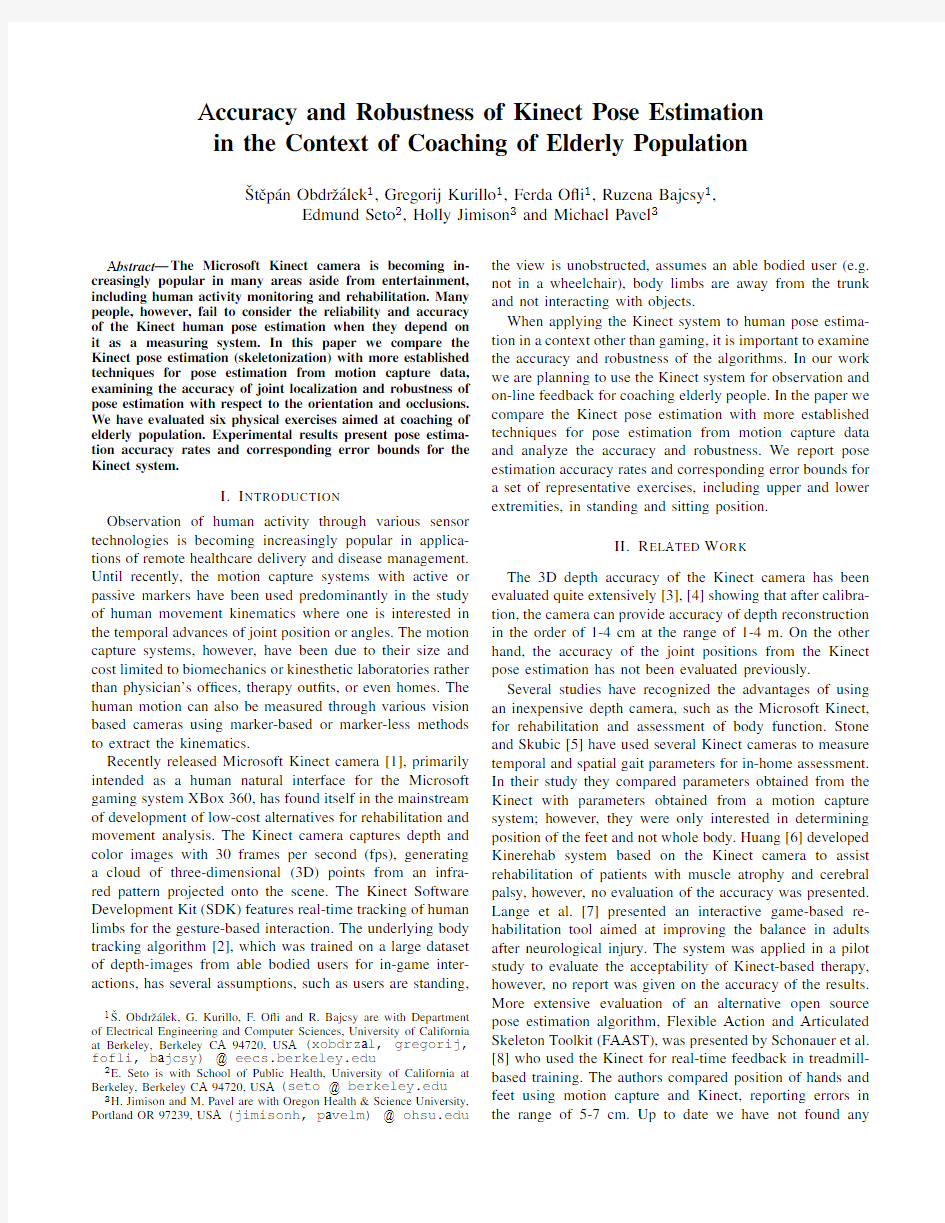
https://www.360docs.net/doc/3e3601117.html,parison of human pose representation by the three systems: Kinect,PhaseSpace Recap and Autodesk MotionBuilder.Noticeable differ-ences are in unnaturally high hip joints by the Kinect and the choice to represent heels instead of ankles by the PhaseSpace system.
IV.E XPERIMENTS
Initially we have recorded a30-minute coaching session that would be normally applied for daily exercise routine of elderly.From the video recording we have identi?ed representative exercises that focus on the upper and lower extremities and captured four subjects performing these exercises.The captured data include spatial coordinates of 43LED markers attached to the subjects,measured by PhaseSpace Impulse system,poses derived from these mark-ers by PhaseSpace Recap tool and poses estimated by the Microsoft Kinect.After the recording another set of poses was obtained by the post-processing of marker data using Autodesk MotionBuilder.
The setup and calibration of the LED-based motion cap-ture system took about half an hour for each subject.After putting on the suit,the subject undertook a calibration proce-dure to calibrate the position of the joints and limb lengths by the motion capture software.For the Kinect camera,a suitable location and elevation was determined to capture the whole body in both standing and sitting positions.No other calibration was needed.
The captured data were post-processed by?rst aligning all the modalities both in spatial and temporal domain. The temporal synchronization was obtained from a clapping action at the beginning of each sequence and from time-stamps assigned to each measurement.For the spatial align-ment we took shoulder,elbow and knee locations over all sequences and computed a rigid3D transformation(rotation and translation)that minimized the square distance of the joints,while ignoring outliers.
The three different methods of pose estimation produced
Fig.2.The six exercises in the study:‘Knee Lift’,‘Cops and Robbers’,‘Deep Breathing’,‘Pendulum Legs’,‘Stand ups’and ‘Line
tapping’.
Fig.3.Vertical position of knee joint (from the ground level)during the Knee Lift exercise.The trajectory of the LED marker attached close to the knee (black line)is close to ground truth trajectory.Of the skeleton ?tting algorithms the magnitude of the movement is best captured by PhaseSpace,with Kinect consistently reporting larger and MotionBuilder smaller numbers.Amount of noise is comparable for all three systems.
kinematic models (i.e.skeletons)which differ in the number and position of joints,arrangements of which are not fully anthropometric.Figure 1shows the three skeletons obtained for a typical T-pose body con?guration.The most signi?cant differences are the unnaturally high placement of hip joints by the Kinect and the choice to represent heels instead of ankles by the PhaseSpace system.Both Recap and Motion-Builder pre-calibrate the limb (bone)lengths which are then kept constant through the entire sequence.The Kinect on the other hand has no such calibration procedure and the limb lengths vary from frame to frame.
We present results measured in six exercises.In ‘Knee Lift’the sitting subject raises knee as high as (s)he can,alternating between left and right leg.In ‘Cops and Robbers’exercise,upper arms are kept horizontal (elbows at
shoulder
Fig.4.Vertical position of wrist joint (from the ground level)during ‘Cops and Robbers’exercise.The joint location is best estimated by the PhaseSpace system.
height)and lower arms are periodically raised from horizon-tal to vertical position and lowered back.Third exercise is ‘Deep Breathing’,with only minimal torso movement dur-ing inhalations and exhalations.Fourth is called ‘Pendulum Legs’,when,standing behind a chair for support,left legs are swung to the left and right legs to the right.To avoid occlusion by the chair,we have recorded this exercise from behind.Fifth is a balance exercise ‘Stand ups’from a chair,with arms crossed on chest.The ?nal sixth exercise is called ‘Line tapping’in which a standing subject taps a line marked on the ground in front of him/her.Figure 2illustrates postures typical for the exercises.The exercises were recorded at four different orientations of the subject,ranging from frontal to side view in 30?increment (i.e.the angle between camera optical axis and the sagittal plane was 0?,30?,60?and 90?).
Fig.5.Upper and lower leg bone lengths determined from the inferred poses as observed in three different orientations of the subject with respect to the camera.The Kinect estimates body geometry in every frame,varying joint to joint
distances.
Fig.6.Example of a failed skeletonization by the Kinect (green skeleton).The chair rest was mistaken for the left arm.
A.Pose Estimation Accuracy
In this section we analyze the accuracy of the estimated skeletons.With exact location of physical joints unavailable,we are using the position of selected LED markers as ground truth.We have manually identi?ed parts of the recorded sequences where knee and wrist markers were well vertically aligned with the physical joints,and used the position on the vertical axis (ground distance)as a ground truth.
Figures 3and 4show ground distance of left knee and left wrist for the ?rst two exercises.Ground truth trajectories of the LED markers are drawn with thicker black line,the joints computed by Kinect are green,joints by PhaseSpace’s Recap are red and joints by MotionBuilder are blue.From the three,the best accuracy is achieved by Recap where the typical error between the LED marker and estimated joint is about 1cm most of the time.Typical errors of the Kinect and MotionBuilder skeletons are about 5
cm.
Fig.7.Example of a failed skeletonization by the MotionBuilder (blue skeleton).An incorrectly interpolated trajectory of an occluded marker displaced the overall location of the skeleton.
B.Robustness of Pose Estimation
The markerless skeleton tracking of Kinect depends solely on dense depth information and thus frequently fails due to occlusions (e.g.self-occlusion by other body parts,especially if only a single Kinect device is used),non-distinguishing depths (limbs close to the body)or clutter (other objects in the scene,e.g.a chair).Figure 6shows an example where an armrest of the chair was mistaken for the left arm.
The marker-based systems infer the skeleton from only a small number of sparse measurements and as such are also susceptible to occlusions of individual markers.For example,sitting in a chair with the arms folded on the lap hides large number of markers,consequently providing insuf?cient information for proper skeleton ?tting.The example in Figure 7shows a situation where the MotionBuilder did not obtain a reasonable pose due to missing readings of markers
on hips.On the other hand,proximity of other body parts,or other markers,does not in?uence the localization of markers, as they are uniquely identi?ed.Nor do other objects in the scene intervene with the capture unless they occlude the markers.
https://www.360docs.net/doc/3e3601117.html,paring Kinect To PhaseSpace’s Recap
From the observations presented above we concluded that the Recap system by PhaseSpace provides the most reliable and accurate pose estimation of the available methods.In this section we compare the skeletons computed by Kinect to the ones by PhaseSpace.For each pose t and joint j∈{shoulder,elbow,wrist,hip,knee,ankle}we compute the euclidean distance D t,j=||x t,j,Kinect?x t,j,PhaseSpace||2 between3D positions x of Kinect’s and PhaseSpace’s joints. The distance is not expected to be zero due to different underlying human models,but rather of a constant value μj.The differences in distances due to inaccurate pose estimation are modeled as Gaussian with standard deviation σj.In case of failed pose detection,e.g.due to occlusion,the distances between Kinect and PhaseSpace joints are assumed to have a uniform distribution on interval(0,600)mm. Combined,we consider the distances D t,j,t∈(1...T) to be realizations of random variable
D j~ρj·N(μj,σ2j)+(1?ρj)·U(0,600mm),
a mixture of Gaussian and Uniform distributions.The mix-ture weightρj corresponds to the ratio of inliers(cases where the pose estimation did not fail).
mean dist std.dev mix outliers indicated I indicated O
Jointμjσjρj|O P|
T |I P∩I K|
|I P|
|O P∩O K|
|O P|
Left Hip213mm27mm 1.000%100%—Right Hip234mm23mm 1.000%100%—Left Knee79mm16mm0.7819%100%0% Right Knee77mm12mm0.7424%100%1% Left Ankle146mm39mm0.879%97%8% Right Ankle193mm38mm0.8611%99%6% Left Shoulder49mm18mm0.8512%100%0% Right Shoulder44mm17mm0.8512%100%0% Left Elbow57mm25mm0.8214%95%8% Right Elbow76mm31mm0.8312%96%0% Left Wrist67mm30mm0.8114%97%86% Right Wrist76mm42mm0.8113%93%61%
TABLE I
P ARAMETERS OF DISTRIBUTION D OF L2DISTANCES BETWEEN JOINTS OF P HASE S PACE AND K INECT SKELETONS,AND THE SUCCESS RATE IN IDENTIFYING INLIERS AND OUTLIERS BY THE K INECT.A LL EXERCISES,
ALL SUBJECTS,FRONTAL VIEW.
Maximum likelihood estimates of parametersρj,μj and σj of the distribution,accumulated over the six exercises and all subjects,and split by the camera-to-user orientation angle,are shown in Tables I,II,III,and https://www.360docs.net/doc/3e3601117.html,rgest distances are seen for hips and ankles,corresponding to the largest differences between the respective human models. The outlier ratio,as well as variations in distances,are higher for joints down the kinematic chain(wrist and ankles)than for joints at torso.
mean dist std.dev mix outliers indicated I indicated O Jointμjσjρj|O P|
T
|I P∩I K|
|I P|
|O P∩O K|
|O P| Left Hip216mm30mm 1.000%100%—Right Hip229mm22mm 1.000%100%—Left Knee74mm20mm0.8017%99%2% Right Knee88mm21mm0.8115%99%2% Left Ankle148mm36mm0.8610%92%10% Right Ankle158mm52mm0.878%92%2% Left Shoulder46mm18mm0.8314%100%1% Right Shoulder55mm21mm0.8413%100%1% Left Elbow53mm25mm0.7322%96%4% Right Elbow72mm29mm0.8213%98%42% Left Wrist69mm29mm0.7421%98%38% Right Wrist69mm36mm0.7618%90%60%
TABLE II
P ARAMETERS OF DISTRIBUTION D OF L2DISTANCES BETWEEN JOINTS OF P HASE S PACE AND K INECT SKELETONS,30?VIEW.
mean dist std.dev mix outliers indicated I indicated O
Jointμjσjρj|O P|
T
|I P∩I K|
|I P|
|O P∩O K|
|O P| Left Hip216mm32mm 1.000%81%—Right Hip225mm24mm0.990%82%96% Left Knee78mm22mm0.8016%99%8% Right Knee92mm21mm0.7917%98%15% Left Ankle138mm35mm0.8610%93%22% Right Ankle159mm55mm0.868%85%20% Left Shoulder45mm17mm0.8017%80%21% Right Shoulder64mm26mm0.7520%87%47% Left Elbow52mm24mm0.7223%97%6% Right Elbow73mm32mm0.7916%91%47% Left Wrist73mm31mm0.7122%98%32% Right Wrist67mm34mm0.7023%85%50%
TABLE III
P ARAMETERS OF DISTRIBUTION D OF L2DISTANCES BETWEEN JOINTS OF P HASE S PACE AND K INECT SKELETONS,60?VIEW.
As expected,the percentage of failed joint estimates increases,more for the right limbs,as the subject turns away from the Kinect camera to the right.The Kinect works best when faced frontally,but the decrease in performance with the view angle is only gradual.
For each joint the Kinect provides an indication whether the joint was directly observed or not,in which case it may have been inferred from past positions and assumptions about body geometry.Let us denote I P j the set of Kinect measurements x t,j,Kinect that we classify as inliers based on the PhaseSpace’s skeleton,i.e.joints at distances D t,j for whichρj·N(μj,σ2j)>(1?ρj)·U(0,600mm).Similarly,let I K j be the set of Kinect’s joints indicated as directly observed by the Kinect.For algorithms subsequently processing the human pose it would be ideal if the Kinect reliably indicated which measurements are imprecise,i.e.if the two sets were identical.Unfortunately they are not.The last two columns in the tables show the percentage of inliers that were marked as directly observed joints by the Kinect,and the percentage of outliers that were marked as unobserved(the closer to 100%the better).In the tables we have denoted the sets of outliers,complementary to the inlier sets,as O P and O K. To reiterate,the results are presented under the assump-tions that the skeletons by Recap are correct and accurate,
mean dist std.dev mix outliers indicated I indicated O
Jointμjσjρj|O P|
T |I P∩I K|
|I P|
|O P∩O K|
|O P|
Left Hip212mm36mm 1.000%57%—Right Hip228mm31mm0.963%67%100% Left Knee77mm21mm0.8215%97%19% Right Knee92mm21mm0.6926%95%40% Left Ankle132mm35mm0.888%93%27% Right Ankle153mm56mm0.8210%78%36% Left Shoulder47mm19mm0.7819%62%48% Right Shoulder60mm22mm0.5142%86%76% Left Elbow53mm22mm0.7026%97%20% Right Elbow74mm32mm0.6428%84%73% Left Wrist75mm32mm0.7221%98%37% Right Wrist63mm30mm0.5438%84%49%
TABLE IV
P ARAMETERS OF DISTRIBUTION D OF L2DISTANCES BETWEEN JOINTS OF P HASE S PACE AND K INECT SKELETONS,90?VIEW.
and that the differences between Recap and Kinect are rea-sonably modelled by the chosen Gaussian-Uniform mixture.
D.Stability of Kinect Body Geometry
We have investigated how stable is the frame-to-frame estimation of body geometry(bone lengths)by Kinect. Figure5shows the measured lengths of the upper and lower leg during the‘Deep Breathing’exercise performed in a sitting position.The subject was captured in three different orientations,relative to the camera,approximately45?apart. The red line indicates bone lengths manually measured on the subject.Constant lines(blue for left leg,green for right) are the lengths from Recap,re?ecting the accuracy of the pre-calibration.
During the three repetitions of the exercise the legs were not moving signi?cantly,yet the variation in Kinect’s bone lengths was about2cm for the frontal view and about5 cm for the45?view.In the?nal90?view the Kinect often failed to recover a meaningful pose since half of the body was occluded.
To demonstrate changes in geometry between signi?cantly different postures,the T-pose,and a transition from standing to sitting position,is included at the beginning of the test sequence(leftmost part of Figure5).The leg length variability is much higher there,about10cm,indicating that without markers it is dif?cult to determine the exact knee and hip location when the legs are straightened.Similar behavior was observed for elbows when the arms are straight.
V.C ONCLUSIONS
In this paper we compared the Kinect pose estimation with more established techniques relying on motion capture data. We believe system such as Kinect has signi?cant potential as a low-cost alternative for real-time motion capture and body tracking in health applications.In the context of physical exercise of elderly population we observed that the Kinect skeleton tracking struggles with occluding body parts or objects in the scene(e.g.a chair).One of the main drawbacks of the Kinect skeleton for the purpose of healthcare is in a very non-anthropometric kinematic model with variable limb lengths.
In a more controlled body posture(e.g.standing and exercising arms),the accuracy of the joint estimation is comparable to motion capture.However,in general postures, the variability of the current implementation of the pose estimation is about10cm.The measurements could be used to assess general trends in the movement,but for quantitative estimation an improved skeletonization with an anthropometric model is needed.Such algorithms should also address occlusions and self-occlusions,unconventional body postures or use of wheelchairs or walkers.
A CKNOWLEDGMENT
The authors would like to thank Po Yan for assistance with the data acquisition.This research was supported in part by National Science Foundation(NSF)grant1111965 and by Grant Number HHS90TR0003/01.Its contents are solely the responsibility of the authors and do not necessarily represent the of?cial views of the HHS.
R EFERENCES
[1]Microsoft,“Kinect,”2010.url:https://www.360docs.net/doc/3e3601117.html,/en-us/kinect
(accessed March7,2012).
[2]J.Shotton, A.W.Fitzgibbon,M.Cook,T.Sharp,M.Finocchio,
R.Moore,A.Kipman,and A.Blake,“Real-time human pose recog-nition in parts from single depth images,”in CVPR,pp.1297–1304, 2011.
[3]K.Khoshelham and S.O.Elberink,“Accuracy and resolution of kinect
depth data for indoor mapping applications,”Sensors,vol.12,no.2, pp.1437–1454,2012.
[4]J.Smisek,M.Jancosek,and T.Pajdla,“3d with kinect,”in ICCV
Workshops,pp.1154–1160,2011.
[5] E.E.Stone and M.Skubic,“Evaluation of an inexpensive depth
camera for passive in-home fall risk assessment,”in PervasiveHealth, pp.71–77,2011.
[6]J.-D.Huang,“Kinerehab:A kinect-based system for physical reha-
bilitation a pilot study for young adults with motor disabilities,”in In Proceedings of ASSETS11,(Dundee,Scotland,UK.),pp.319–320, October24262011.
[7] https://www.360docs.net/doc/3e3601117.html,nge, C.-y.Chang, E.Suma, B.Newman, A.S.Rizzo,and
M.Bolas,“Development and evaluation of low cost game-based bal-ance rehabilitation tool using the microsoft kinect sensor,”Conference Proceedings of the International Conference of IEEE Engineering in Medicine and Biology Society,vol.2011,pp.1831–1834.
[8] C.Schonauer,T.Pintaric,H.Kaufmann,S.Jansen Kosterink,and
M.V ollenbroek-Hutten,“Chronic pain rehabilitation with a serious game using multimodal input,”in Virtual Rehabilitation(ICVR),2011 International Conference on,pp.1–8,june2011.
[9]PhaseSpace,“Impulse motion capture.”url:
https://www.360docs.net/doc/3e3601117.html,(accessed March15,2012).
[10]Autodesk,“Motionbuilder.”url:https://www.360docs.net/doc/3e3601117.html,(accessed
March15,2012).
2位十进制高精度数字频率计设计
广州大学学生实验报告 实验室:电子信息楼 317EDA 2017 年 10 月 2 日 学院机电学院年级、专 业、班 电信 151 姓名苏伟强学号1507400051 实验课 程名称 可编程逻辑器件及硬件描述语言实验成绩 实验项 目名称 实验4 2位十进制高精度数字频率计设计指导老师 秦剑 一实验目的 1 熟悉原理图输入法中74系列等宏功能元件的使用方法,掌握更复杂的原理图层次化设计技术和数字系统设计方法。 2 完成2位十进制频率计的设计,学会利用实验系统上的FPGA/CPLD验证较复杂设计项目的方法。 二实验原理 1 若某一信号在T秒时间里重复变化了N 次,则根据频率的定义可知该信号的频率fs 为:fs=N/T 通常测量时间T取1秒或它的十进制时间。 三实验设备 1 FPGA 实验箱,quarteus软件 四实验内容和结果 1 2位十进制计数器设计 1.1 设计原理图:新建quarteus工程,新建block diagram/schematic File文件,绘制原理图,命名为conter8,如图1,保存,编译,注意:ql[3..0]输出的低4位(十进制的个位), qh[3..0]输出的高4位(十进制的十位) 图片11.2 系统仿真:如图2建立波形图进行波形仿真,如图可以看到完全符合设计要求,当clk输入时钟信号时,clr有清零功能,当enb高电平时允许计数,低电平禁止计数,当低4位计数到9时向高4位进1 图2 1.3 生成元件符号:File->create/updata->create symbol file for current file,保存,命名为conter8,如图3为元件符号(block symbol file 文件): 图3 2 频率计主结构电路设计 2.1 绘制原理图:关闭原理的工程,新建工程,命名为ft_top,新建原理图文件,在project navigator的file 选项卡,右键file->add file to the project->libraries->project library name添加之前conters8工程的目录在该目录下,这样做的目的是因为我们会用到里面的conters8进行原理图绘制,绘制原理图,如图4,为了显示更多的过程信息,我们将74374的输出也作为output,重新绘制了原理图,图5 图4
测量中的重要概念——精确度,准确度,敏感度和分辨率
测量中的重要概念——精确度,准确度,敏感度和分辨率 问题简述:在测量中经常会遇到测量精确度(accuracy)、准确度(precision)、敏感度(sensitivity)以及分辨率(resolution)的概念,它们的含义是什么,以及在何种程度上会影响到测量结果,是不是分辨率越高精确度就越好,本文就这些内容作一个探讨。 问题解答:对于精确度(accuracy)和准确度(precision),简单来说,精确度表征的是测量结果与真实值偏差的多少,准确度则是指多次测量结果的一致性如何。以下图为例,我们将测量比作打靶。精确度越高,多次测量结果取平均值就越接近真实值;准确度越高,多次测量结果越一致。 工程应用中,准确度(precision)也是一个十分重要的指标。由于实际现场存在许多不可预期因素,测量结果的精确度总是会随着时间、温度、湿度、光线强度等因素的变化而发生变化。但如果测量的准确度足够高,即测量结果的一致性较好,就可以通过一定的方式对测量结果进行校正,减小系统误差,提高精确度。 在测量系统中,分辨率(resolution)和敏感度(sensitivity)也是常见指标。以NI 的M 系列数据采集卡为例。下图是NI 6259 的部分技术参数: 可以看到,6259 模拟输入的分辨率是16 位,即采用的是16 位的ADC。那么在满量程下(-10,10V),ADC 的码宽为20/2^16=305μV ,通常我们也将该值称为1LSB(1LSB = V FSR/2N,其中V FSR为满量程电压,N 是ADC 的分辨率)。在满量程下,6259 的精确度为
1920μV。敏感度是采集卡所能感知到的最小电压变化值。它是噪声的函数。 数据采集卡可能在基准电压,可编程仪器放大器(PGIA),ADC 等处引入测量误差,如下图所示。 NI 的数据采集卡精确度遵循以下计算公式: 精确度= 读数×增益误差+ 量程×偏移误差+ 噪声不确定度 增益误差= 残余增益误差+ 增益温度系数×上次内部校准至今的温度改变+ 参考温度系数×上次外部校准至今的温度改变 偏移误差= 残余偏移误差+ 偏置温度系数×上次内部校准的温度改变+ INL_误差 可以在625X 的技术手册中查找公式中的各项参数,如下表所示: 其中增益误差主要由于放大器的非线性引起,而ADC 的分辨率主要影响INL(Integral nonlinearity)误差(积分非线性误差)。 DNL(Differential nonlinearity)误差定义(微分非线性误差)为实际量化台阶与对应于1LSB 的理想值之间的差异(见下图)。对于一个理想ADC,跳变值之间的间隔为精确的1LSB。若DNL误差指标≤1LSB,就意味着传输函数具有保证的单调性,没有丢码。当一个ADC 的数字量输出随着模拟输入信号的增加而增加时(或保持不变),就称其具有单调性,相应传输函数曲线的斜率没有变号。
02 第二章 精度指标与误差传播
第二章:精度指标与误差传播 内容及学习要求 本章详细讨论偶然误差分布的规律性,衡量精度的绝对指标-中误差,相对指标-权及其确定权的实用方法;方差、协因数定义及其传播律等问题。本章内容是是测量平差的理论基础,也是本课程的重点之一。学习本章要求深刻理解精度指标的含义,掌握权、协方差、协因数概念,确定权及根据已知协方差、协因数的观测值求其函数的方差、协因数的方法(协因数、协方差传播律)。 §2-1概述 概括本章内容,其主线是偶然误差的统计规律→衡量单个随机变量的精度指标-方差→衡量随机向量的精度指标-协方差阵→求观测值向量函数的精度指标-协方差传播律→精度的相对指标-权。 §2-2偶然误差的规律性 本小节阐述偶然误差的统计规律性,提出偶然误差服从正态分布的结论 任何一个观测值,客观上总是存在一个真正代表其值的量,这一数值就称观测值的真`值。从概率统计的观点看,当观测量仅含偶然误差时,真值就是其数学期望。 某一随机变量的数学期望为:i n i i p x X E ∑== 1 )( 或 ?+∞ ∞ -=dx x xf X E )()( 期望的实质是一种理论平均值,可用无穷观测,以概率为权,取加权平均值的概念理解.dx x f )(表示x 出现在小区间dx 的概率。 设对n 个量进行了观测,观测值为。 、、、n L L L ???21其相应的真值分别为。 、、、n L L L ???21令i i i i L L ?-=?, 即真误差。由于假定测量平差所处理的观测值只含偶然误差,所以真误差i ?就是偶然误差。用向量形式表述为: ? ????????????=?n b L L L L 211、?????? ????????=?n n L L L L ..211、?? ?????????????=??n n .211 则有:111???-=?n n n L L 注意:本教程中凡是不加说明,即没有下标说明的向量都是列向量,若表示行向量则加以转置符号表示,如:T T T B A L 、、等。 对单个的偶然误差而言,大小和符号都没有规律,及事先完全不可预知。但从大量测量实践中知道,在相同的观测条件下,偶然误差就总体而言,有一定的统计规律,表现为如下几点: 1、 误差绝对值有一定限值 2、 绝对值小的比大的多 3、 绝对值相等的正负误差出现的个数相等或接近。 教材中分别列举两个实例,以358和421个三角形闭合差的分析结果验证了上述结论(闭合差是理论值与观测值之差,故是真误差)。注意:统计规律只有当有较多的观测量时,才能得出正确结论。 为了形象地刻画误差分布情况,以横坐标表示误差的大小,纵坐标采用单位区间频率(出现在某区间内的频率,等于该区间内出现的误差个数i v 除误差总个数n ,而采用单位频率 i i nd V ?为纵坐标值,使曲线(直方图)趋势不因区间间隔不同而变化)。根据统计规律可知,在相同条件下所得一组独立观测值,n 足够大时,误差出现在各个区间的频率总是稳定在某一常数(理论频率)附近,n 越大;稳定程度越高。n 趋于∞,则频率等于概率(理论频率)。令区间长度0→?d ,则长方条顶形成的折线变成光滑曲线,称概率曲线。
高精度单片机频率计的设计
《综合课程设计》 一.数字频率计的设计 姓名:万咬春学号2005142135 一、课程设计的目的 通过本课程设计使学生进一步巩固光纤通信、单片机原理与技术的基本概念、基本理论、分析问题的基本方法;增强学生的软件编程实现能力和解决实际问题的能力,使学生能有效地将理论和实际紧密结合,拓展学生在工程实践方面的专业知识和相关技能。 二、课程设计的内容和要求 1.课程设计内容 (硬件类)频率测量仪的设计 2.课程设计要求 频率测量仪的设计 要求学生能够熟练地用单片机中定时/计数、中断等技术,针对周期性信号的特点,采用不同的算法,编程实现对信号频率的测量,将测量的结果显示在LCD 1602 上,并运用Proteus软件绘制电路原理图,进行仿真验证。 三.实验原理 可用两种方法测待测信号的频率 方法一:(定时1s测信号脉冲次数) 用一个定时计数器做定时中断,定时1s,另一定时计数器仅做计数器使用,初始化完毕后同时开启两个定时计数器,直到产生1s中断,产生1s中断后立即关闭T0和T1(起保护程序和数据的作用)取出计数器寄存器内的值就是1s内待测信号的下跳沿次数即待测信号的频率。用相关函数显示完毕后再开启T0和T1这样即可进入下一轮测量。 原理示意图如下:
实验原理分析: 1.根据该实验原理待测信号的频率不应该大于计数器的最大值65535,也就是说待测信号应小于65535Hz。 2.实验的误差应当是均与的与待测信号的频率无关。 方法二(测信号正半周期) 对于1:1占空比的方波,仅用一个定时计数器做计数器,外部中断引脚作待测信号输入口,置计数器为外部中断引脚控制(外部中断引脚为“1”切TRx=1计数器开始计数)。单片机初始化完毕后程序等待半个正半周期(以便准确打开TRx)打开TRx,这时只要INTx (外部中断引脚)为高电平计数器即不断计数,低电平则不计数,待信号从高电平后计数器终止计数,关闭TRx保护计数器寄存器的值,该值即为待测信号一个正半周期的单片机机器周期数,即可求出待测信号的周期:待测信号周期T=2*cnt/(12/fsoc) cnt为测得待测信号的一个正半周期机器周期数;fsoc为单片机的晶振。所以待测信号的频率f=1/T。 原理示意图如下: 实验原理分析: 1.根据该实验原理该方法只适用于1:1占空比的方波信号,要测非1:1占空比的方波信号 2.由于有执行f=1/(2*cnt/(12/fsoc))的浮点运算,而数据类型转换时未用LCD 浮点显示,故测得的频率将会被取整,如1234.893Hz理论显示为1234Hz,测 得结果会有一定程度的偏小。也就是说测量结果与信号频率的奇偶有一定关 系。 3.由于计数器的寄存器取值在1~65535之间,用该原理时,待测信号的频率小于单片机周期的1/12时,单片机方可较标准的测得待测信号的正半周期。故用 该原理测得信号的最高频率理论应为fsoc/12 如12MHZ的单片机为1MHz。 而最小频率为f=1/(2*65535/(12/fsoc))如12MHZ的单片机为8Hz。 四.实验内容及步骤 1. 仿真模型的构建 数字方波频率计的设计总体可分为两个模块。一是信号频率测量,二是将测得的频率数据显示在1602液晶显示模块上。因此可搭建单片机最小系统构建构建频率计的仿真模型。原理图,仿真模型的总原理图如下:
计算机毕业论文_基于FPGA的等精度频率计的设计与实现
目录 前言...............................................................1 第一章 FPGA及Verilog HDL..........................................2 1.1 FPGA简介.....................................................2 1.2 Verilog HDL 概述.............................................2 第二章数字频率计的设计原理........................................3 2.1 设计要求.....................................................3 2.2 频率测量.....................................................3 2.3.系统的硬件框架设计..............................................4 2.4系统设计与方案论证............................................5 第三章数字频率计的设计............................................8 3.1系统设计顶层电路原理图........................................8 3.2频率计的VHDL设计.............................................9 第四章软件的测试...............................................15 4.1测试的环境——MAX+plusII.....................................15 4.2调试和器件编程...............................................15 4.3频率测试.....................................................16
如何理解电子测量仪器的精度指标
如何理解电子测量仪器的精度指标 精确度是衡量电子测量仪器性能最重要的指标,通常由读数精度、量程精度两部分组成。本文结合几个具体案例,讲述误差的产生、计算以及标定方法,正确理解精度指标能够帮助您选择合适的仪器仪表。 一、测量误差的定义 误差常见的表示方法有:绝对误差、相对误差、引用误差。 1)绝对误差:测量值x*与其被测真值x之差称为近似值x*的绝对误差,简称ε。 计算公式:绝对误差 = 测量值 - 真实值; 2)相对误差:测量所造成的绝对误差与被测量(约定)真值之比乘以100%所得的数值,以百分数表示。 计算公式:相对误差 =(测量值 - 真实值)/真实值×100%(即绝对误差占真实值的百分比); 3)测量的绝对误差与仪表的满量程值之比,称为仪表的引用误差,它常以百分数表示。引用误差=(绝对误差的最大值/仪表量程)×100% 引用误差越小,仪表的准确度越高,而引用误差与仪表的量程范围有关,所以在使用同一准确度的仪表时,往往采取压缩量程范围,以减小测量误差 举个例子,使用万用表测得电压1.005V,假定电压真实值为1V,万用表量程10V,精度(引用误差)0.1%F.S,此时万用表测试误差是否在允许范围内? 分析过程如下: 绝对误差:E = 1.005V - 1V = +0.005V; 相对误差:δ=0.005V/1V×100%=0.5%; 万用表引用误差:10V×0.1%F.S=0.1V; 因为绝对误差0.005V<0.1V,所以10V量程引用误差0.1%F.S的万用表,测量1V相对误差为0.5%,仍在误差允许范围内。 二、测量误差的产生 绝对误差客观存在但人们无法确定得到,且绝对误差不可避免,相对误差可以尽量减少。误差组成成分可分为随机误差与系统误差,即:误差=测量结果-真值=随机误差+系统误差因此任意一个误差均可分解为系统误差和随机误差的代数和系统误差: 1)系统误差(Systematic error) 定义:在重复性条件下,对同一被测量进行无限多次测量所得结果的平均值与被测量的真值之差。 产生原因:由于测量工具(或测量仪器)本身固有误差、测量原理或测量方法本身理论的缺陷、实验操作及实验人员本身心理生理条件的制约而带来的测量误差。 特性:是在相同测量条件下、重复测量所得测量结果总是偏大或偏小,且误差数值一定或按一定规律变化。 优化方法:方法通常可以改变测量工具或测量方法,还可以对测量结果考虑修正值。 2)随机误差。 定义:随机误差又叫偶然误差,是指测量结果与同一待测量的大量重复测量的平均结果之差。产生原因:即使在完全消除系统误差这种理想情况下,多次重复测量同一测量对象,仍会由于各种偶然的、无法预测的不确定因素干扰而产生测量误差。 特点:是对同一测量对象多次重复测量,测量结果的误差呈现无规则涨落,可能是正偏差,也可能是负偏差,且误差绝对值起伏无规则。但误差的分布服从统计规律,表现出以下三个
等精度数字频率计的设计
等精度数字频率计的设计 李艳秋 摘要 基于传统测频原理的频率计的测量精度将随着被测信号频率的下降而降低,在实用中有很大的局限性,而等精度频率计不但有较高的测量精度,而且在整个测频区域内保持恒定的测试精度。运用等精度测量原理,结合单片机技术设计了一种数字频率计,由于采用了屏蔽驱动电路及数字均值滤波等技术措施,因而能在较宽定的频率范围和幅度范围内对频率,周期,脉宽,占空比等参数进行测量,并可通过调整闸门时间预置测量精度。选取的这种综合测量法作为数字频率计的测量算法,提出了基于FPGA 的数字频率计的设计方案。给出了该设计方案的实际测量效果,证明该设计方案切实可行,能达到较高的频率测量精度。 关键词等精度测量,单片机,频率计,闸门时间,FPGA Ⅱ
ABSTRACT Along with is measured based on the traditional frequency measurement principle frequency meter measuring accuracy the signalling frequency the drop but to reduce, in is practical has the very big limitation, but and so on the precision frequency meter not only has teaches the high measuring accuracy, moreover maintains the constant test precision in the entire frequency measurement region. Using and so on the precision survey principle, unified the monolithic integrated circuit technical design one kind of numeral frequency meter, because has used the shield actuation electric circuit and technical measure and so on digital average value filter, thus could in compared in the frequency range and the scope scope which the width decided to the frequency, the cycle, the pulse width, occupied parameter and so on spatial ratio carries on the survey, and might through the adjustment strobe time initialization measuring accuracy. Selection this kind of synthesis measured the mensuration took the digital frequency meter the survey algorithm, proposed based on the FPGA digital frequency meter design proposal. Has produced this design proposal actual survey effect, proved this design proposal is practical and feasible, can achieve the high frequency measurement precision Keywords Precision survey, microcontroller, frequency meter, strobe time,field programmable gate array Ⅱ
公差与配合标准表
公差与配合(摘自GB1800~1804-79)1.基本偏差系列及配合种类 .2.标准公差值及孔和轴的极限偏差值 基本尺寸 mm 公差等级 IT5 IT6 IT7 IT8 IT9 IT10 IT11 IT12 >6~10 >10~18 >18~30 >30~50 >50~80 >80~120 >120~180 >180~250 >250~315 >315~400 >400~500 6 8 9 11 13 15 18 20 23 25 27 9 11 13 16 19 22 25 29 32 36 40 15 18 21 25 30 35 40 46 52 57 63 22 27 33 39 46 54 63 72 81 89 97 36 43 52 62 74 87 100 115 130 140 155 58 70 84 100 120 140 160 185 210 230 250 90 110 130 160 190 220 250 290 320 360 400 150 180 210 250 300 350 400 460 520 570 630
孔的极限差值(基本尺寸由大于10至315mm)μm
轴的极限偏差(基本尺寸由于大于10至315mm)
公差带级 >10~18>18~30 >30~50 >50~80 >80~120>120~180 >180~250>250~315 K 5 +9 +1 +11 +2 +13 +2 +15 +2 +18 +3 +21 +3 +24 +4 +27 +4 ▼6 +12 +1 +15 +2 +18 +2 +21 +2 +25 +3 +28 +3 +33 +3 +36 +4 7 +19 +1 +23 +2 +27 +2 +32 +2 +38 +3 +43 +3 +50 +4 +56 +4 M 5 +15 +7 +17 +8 +20 +9 +24 +11 +28 +13 +33 +15 +37 +17 +43 +20 6 +18 +7 +21 +8 +25 +9 +30 +11 +35 +13 +40 +15 +46 +17 +52 +20 7 +25 +7 +29 +8 +34 +9 +41 +11 +48 +13 +55 +15 +63 +17 +72 +20 N 5 +20 +12 +24 +15 +28 +17 +33 +22 +38 +23 +45 +27 +51 +31 +57 +34 ▼6 +23 +12 +28 +15 +33 +17 +39 +20 +45 +23 +52 +27 +60 +31 +66 +34 7 +30 +12 +36 +15 +42 +17 +50 +20 +58 +23 +67 +27 +77 +31 +86 +34 p 5 +26 +18 +31 +22 +37 +26 +45 +32 +52 +37 +61 +43 +70 +50 +79 +56 ▼6 +29 +18 +35 +22 +42 +26 +51 +32 +59 +37 +68 +43 +79 +50 +88 +56 7 +36 +18 +43 +22 +51 +26 +62 +32 +72 +37 +83 +43 +96 +50 +108 +56 注:标注▼者为优先公差等级,应优先选用。 形状和位置公差(摘自GB1182~1184-80) 形位公差符号 分类形状公差位置公差 项目直线 度 平面 度 圆度 圆柱 度 平行 度 垂直 度 倾斜 度 同轴 度 对称 度 位置 度 圆跳 动 全跳动 符号
分辨率与精度
分辨率与精度的区别 2010-10-07 10:28:37 很多人对于精度和分辨率的概念不清楚,这里我做一下总结,希望大家不要混淆。 我们搞编码器制做和销售的,经常跟“精度”与“分辨率”打交道,这个问题不是三言两语能搞得清楚的,在这里只作抛砖引玉了。 简单点说,“精度”是用来描述物理量的准确程度的,而“分辨率”是用来描述刻度划分的。从定义上看,这两个量应该是风马牛不相及的。(是不是有朋友感到愕然^_^)。很多卖传感器的JS就是利用这一点来糊弄人的了。简单做个比喻:有这么一把常见的塑料尺(中学生用的那种),它的量程是10厘米,上面有100个刻度,最小能读出1毫米的有效值。那么我们就说这把尺子的分辨率是1毫米,或者量程的1%;而它的实际精度就不得而知了(算是0.1毫米吧)。当我们用火来烤一下它,并且把它拉长一段,然后再考察一下它。我们不难发现,它还有有100个刻度,它的“分辨率”还是1毫米,跟原来一样!然而,您还会认为它的精度还是原来的0.1毫米么?(这个例子是引用网上的,个人觉得比喻的很形象!) 所以在这里利用这个例子帮大家把这两个概念理一下,以后大家就可以理直气壮的说精度和分辨率了,而不是将精度理解为分辨率。呵呵,希望对大家有用!^_^ 加工精度是加工后零件表面的实际尺寸、形状、位置三种几何参数与图纸要求的理想几何参数的符合程度。理想的几何参数,对尺寸而言,就是平均尺寸;对表面几何形状而言,就是绝对的圆、圆柱、平面、锥面和直线等;对表面之间的相互位置而言,就是绝对的平行、垂直、同轴、对称等。零件实际几何参数与理想几何参数的偏离数值称为加工误差。加工精度与加工误差都是评价加工表面几何参数的术语。加工精度用公差等级衡量,等级值越小,其精度越高;加工误差用数值表示,数值越大,其误差越大。加工精度高,就是加工误差小,反之亦然。 任何加工方法所得到的实际参数都不会绝对准确,从零件的功能看,只要加工误差在零件图要求的公差范围内,就认为保证了加工精度。 机器的质量取决于零件的加工质量和机器的装配质量,零件加工质量包含零件加工精度和表面质量两大部分。 机械加工精度是指零件加工后的实际几何参数(尺寸、形状和位置)与理想几何参数相符合的程度。它们之间的差异称为加工误差。加工误差的大小反映了加工精度的高低。误差越大加工精度越低,误差越小加工精度越高。 加工精度包括三个方面内容: 尺寸精度指加工后零件的实际尺寸与零件尺寸的公差带中心的相符合程度。 形状精度指加工后的零件表面的实际几何形状与理想的几何形状的相符合程度。 位置精度指加工后零件有关表面之间的实际位置与理想 精度就是结果值与结果真值的差值。 精度Accuracy 观测结果、计算值或估计值与真值(或被认为是真值)之间的接近程度。每一种物理量要用数值表示时,必须先要制定一种标准,并选定一种单位(unit)。标准及单位的制定,是为了沟通人与人之间对于物理现象的认识。这种标准的制定,通常是根据人们对于所要测量的物理量的认识与了解,并且要考虑这标准是否容易复制,或测量的过程是否容易操作等实际问题。由
建筑物沉降观测精度指标及评定方法
建筑物沉降观测精度指标及评定方法 摘要:本文结合相关标准,探讨了建筑物沉降观测精度指标的含义及其估算方法,并对沉降观测结果的精度评定进行了研究。 关键词:建筑物;沉降观测;精度评定;精度指标 0 引言 沉降观测的精度要求取决于观测的目的、该建筑物的允许变形值以及建筑物的结构与基础类型[1]。由于沉降观测的精度直接影响到观测成果的可靠性和精确性,因此精度指标的确定及评定是沉降观测中的一个重要环节。然而,在现实工作中,建筑物沉降观测的精度评定经常被忽视,不少测量工作者甚至不清楚精度指标的含义及精度评定的方法。本文结合标准《建筑物沉降观测方法》DGJ32/J18-2006及《建筑变形测量规范》JGJ8-2007的要求,对建筑物的精度指标及评定进行深入探讨,弄清精度指标的概念及精度评定的方法。 1 基本概念 在测量中,由于受到测量仪器、观测者、外界条件等种种因素的影响,产生误差是不可避免的。测量误差分为偶尔误差和系统误差两大类,所谓精度,就是描述偶然误差分布的参数,精度越高,表示偶然误差的离散度越小,观测成果越可靠,反之亦然。 为了衡量观测精度的高低,利用一些数字反映误差分布的离散程度,这些数字称为衡量精度的指标,较常用的精度指标为方差和中误差,计算公式如下: (1) (2) 方差和中误差是表征精度的绝对数字指标,权、协因数(权倒数)则是表征精度的相对数字指标。设有观测值,对应的方差为,如选定任一常数,协因数的计算公式为: (3) 则称为的协因数或权倒数,为单位权中误差。对于水准测量,常用每公里观测高差中误差或者每测站高差中误差作为单位权中误差。 2 建筑物沉降观测精度指标及评定方法 2.1 精度指标
等精度数字频率计的设计
等精度数字频率计的设计 (Design of equal precision digital frequency meter)作者:李欢(电子工程学院光信息科学与技术 1103班) 指导教师:惠战强 摘要:伴随着集成电路(IC)技术的发展,电子设计自动化(EDA)逐渐成为重要的设计手段,已经广泛应用于模拟与数字电路系统等许多领域。电子设计自动化是一种实现电系统或电子产品自动化设计的技术,它与电子技术、微电子技术的发展密切相关,它吸收了计算机科学领域的大多数最新研究成果,以高性能的计算机作为工作平台,促进了工程发展。 数字频率计是一种基本的测量仪器。它被广泛应用于航天、电子、测控等领域。采用等精度频率测量方法具有测量精度保持恒定,不随所测信号的变化而变化的特点。本文首先综述了EDA技术的发展概况,FPGA/CPLD开发的涵义、优缺点,VHDL语言的历史及其优点,然后介绍了频率测量的一般原理。 关键字:电子设计自动化;VHDL语言;频率测量;数字频率计 Abstract The Electronic Design Automation (EDA) technology has become an important design method of analog and digital circuit system as the integrated circuit's growing. The EDA technology, which is closely connected with the electronic technology, microelectronics technology and computer science, can be used in designing electronic product automatically. Digital frequency meter is a basic measuring instruments. It is widely used in aerospace, electronics, monitoring and other fields. With equal precision frequency measurement accuracy to maintain a constant, and not with the measured signal varies.We firstly present some background information of EDA, FPGA/CPLD and VHDL;then introduced the general principle of frequency measurement. Keywords: Electronic Design Automation,VHDL, Frequency measurement,digital frequency meter.
AD精度和分辨率的区别
最近做了一块板子,当然考虑到元器件的选型了,由于指标中要求精度比较高,所以对于AD的选型很慎重。很多人对于精度和分辨率的概念不清楚,这里我做一下总结,希望大家不要混淆。我们搞电子开发的,经常跟“精度”与“分辨率”打交道,这个问题不是三言两语能搞得清楚的,在这里只作抛砖引玉了。 简单点说,“精度”是用来描述物理量的准确程度的,而“分辨率”是用来描述刻度划分的。从定义上看,这两个量应该是风马牛不相及的。(是不是有朋友感到愕然^_^)。很多卖传感器的JS就是利用这一点来糊弄人的了。简单做个比喻:有这么一把常见的塑料尺(中学生用的那种),它的量程是10厘米,上面有100个刻度,最小能读出1毫米的有效值。那么我们就说这把尺子的分辨率是1毫米,或者量程的1%;而它的实际精度就不得而知了(算是0.1毫米吧)。当我们用火来烤一下它,并且把它拉长一段,然后再考察一下它。我们不难发现,它还有有100个刻度,它的“分辨率”还是1毫米,跟原来一样!然而,您还会认为它的精度还是原来的0.1毫米么?(这个例子是引用网上的,个人觉得比喻的很形象!) 回到电子技术上,我们考察一个常用的数字温度传感器:AD7416。供应商只是大肆宣扬它有10位的AD,分辨率是1/1024。那么,很多人就会这么欣喜:哇塞,如果测量温度0-100摄氏度,100/1024……约等于0.098摄氏度!这么高的精度,足够用了。但是我们去浏览一下AD7416的数据手册,居然发现里面赫然写着:测量精度0.25摄氏度!所以说分辨率跟精度完全是两回事,在这个温度传感器里,只要你愿意,你甚至可以用一个14位的AD, 获得1/16384的分辨率,但是测量值的精度还是0.25摄氏度^_^ AD的参考电压为VREF,则AD理论上能测到的最小电压值为分辨率*VREF。实际上还跟精度有关系。 所以很多朋友一谈到精度,马上就和分辨率联系起来了,包括有些项目负责人,只会在那里说:这个系统精度要求很高啊,你们AD的位数至少要多少多少啊…… 其实,仔细浏览一下AD的数据手册,会发现跟精度有关的有两个很重要的指标:DNL和INL。似乎知道这两个指标的朋友并不多,所以在这里很有必要解释一下。 DNL:DifferencialNonLiner——微分非线性度 INL:IntergerNonLiner——积分非线性度(精度主要用这个值来表示) 他表示了ADC器件在所有的数值点上对应的模拟值,和真实值之间误差最大的那一点的误差值。也就是,输出数值偏离线性最大的距离。单位是LSB(即最低位所表示的量)。 当然,像有的AD如△—∑系列的AD,也用Linearity error 来表示精度。 为什么有的AD很贵,就是因为INL很低。分辨率同为12bit的两个ADC,一个INL=±3LSB,而一个做到了±1.5LSB,那么他们的价格可能相差一倍。 所以在这里帮大家把这两个概念理一下,以后大家就可以理直气壮的说精度和分辨率了,而不是将精度理解为分辨率。呵呵,希望对大家有用!^_^
基于FPGA的等精度频率计
光电与通信工程学院课程设计报告书 课设名称:等精度频率计 年级专业及班级: 姓名: 学号:
一、课程设计目的 1、进一步熟悉 Quartus Ⅱ的软件使用方法,熟悉 keil 软件使用; 2、熟悉单片机与可编程逻辑器件的开发流程及硬件测试方法; 3、掌握等精度频率计设计的基本原理。 4、掌握独立系统设计及调试方法,提高系统设计能力。 实验设备 EDA最小系统板一块(康芯)、PC机一台、示波器一台、信号发生器一台、万用表一个。 二、设计任务 利用单片机与FPGA设计一款等精度频率计,待测脉冲的检测及计数部分由FPGA实现,FPGA的计数结果送由单片机进行计算,并将最终频率结果显示在数码管上。要求该频率计具有较高的测量精度,且在整个频率区域能保持恒定的测试精度,具体指标如下: a)具有频率测试功能:测频范围 100Hz~5MHz。测频精度:相对误差恒为基准频率的万分之一。 b)具有脉宽测试功能:测试范围 10μs~1s,测试精度:0.1μs。 c)具有占空比测试功能:测试精度1%~99%。 d)具有相位测试功能。 (注:任务a 为基本要求,任务 b、c、d 为提高要求) 三、基本原理 基于传统测频原理的频率计的测量精度将随被测信号频率的下降而降低,在实用中有较大的局限性,而等精度频率计不但具有较高的测量精度,而且在整个频率区域能保持恒定的测试精度。 3.1 等精度测频原理 等精度频率计主控结构如图 1 所示
预置门控信号 CL 选择为 0.1~1s 之间(通过测试实验得出结论:CL 在这个 范围内选择时间宽度对测频精度几乎没有影响)。BZH 和 TF 分别是 2 个高速计数器,BZH 对标准频率信号(频率为 Fs)进行计数,设计数结果为 Ns;TF 对被测信号(频率为Fx)进行计数,计数结果为 Nx,则有 MUX64-8 模块并不是必须的,可根据实际设计进行取舍。分析测频计测控时序,着重分析 START的作用,完成等精度频率计设计。 3.2 FPGA 模块 FPGA模块所要完成的功能如图 1 所示,由于单片机的速度慢,不能直接测量高频信号,所以使用高速 FPGA 为测频核心。100MHZ 的标准频率信号由FPGA 内部的 PLL 倍频实现,待测信号 TCLK 为方波,由信号发生器给出待测方波信号(注意:该方波信号带有直流偏置,没有负电压,幅值3.3V)。预制
示波器的垂直精度与垂直分辨率
广州致远电子股份有限公司 示波器的垂直精度与垂直分辨率 示波器的垂直世界 类别 内容 关键词 垂直精度、垂直分辨率 摘 要 示波器的垂直精度与垂直分辨率解析
修订历史
目录 1. 概述 (1) 1.1垂直精度 (1) 1.2垂直分辨率解析 (1) 1.3算法提高分辨率 (1) 1.3.1几个基本概念 (1) 1.3.2平均算法 (2) 1.3.3高分辨率算法 (3) 2. 小结 (4) 3. 免责声明 (5)
1. 概述 数字存储示波器与万用表相比,测量电压到底是谁更准确呢?当然是万用表,但是为什么大家还会经常使用示波器来进行测量呢? 1.1 垂直精度 提到测量问题,就会涉及到测量精度。用数字存储示波器测量模拟波形第一步就是用ADC将连续的模拟波形信号转换成量化的数字信号,最常用的是8位ADC,也就说对于任何一个波形值都是用256个0和1来重组。 当我们用同一个示波器在不同垂直档位下测量同一信号时,一般情况下得到的测量结果是不一样的,事实上,它涉及到垂直精度的问题,假设当垂直档位为500mV/div时,示波器垂直方向有8格,则其垂直精度分别为(500mV*8)/256=15.625 mV,也就是小于15.625 mV 的电压不会准确测量出来,测量同一个信号,在垂直档位为50mV/div的情况下,即(50mV*8)/256=1.5625 mV,垂直精度就达到了1.5625 mV,小于该垂直精度的电压值是不能测量出来的,即数字测量仪器都是存在采集的量化误差的,只能说ADC的位数越高,量化误差就会越小,但它只能无限减小,并不能消除。 所以当我们在对波形进行测量时,尽量使波形占满示波器屏幕,目的就是为了提高垂直精度,使测量结果更准确。 图1.1 垂直精度示意图 1.2 垂直分辨率解析 我们通常用示波器的垂直分辨率来描述数字示波器中ADC的位数,即位数越高,垂直分辨率越高,该分辨率由硬件决定,一旦确定无法改变。而示波器整个系统的有效位数(ENOB)形成的分辨率与前者不同,它可以由8位变为12位,甚至16位! 示波器整个系统的有效位数(ENOB),它限制着测量系统区分和表示小信号的能力,该能力用噪声失真比(SINAD)表示,其值越大代表信号的噪声干扰越小,有效位数(ENOB)与噪声失真比(SINAD)之间的关系为: SINAD(噪声失真比,单位:dB)=6.02* ENOB(有效位数)+1.76 根据该数学关系式可知,SINAD(噪声失真比)大约每增加6 dB,ENOB(有效位数)就能增加1bit。所以提高信噪比,就能提高所谓的系统等效分辨率。 但是只要ADC位数不变,无论怎样提高所谓的分辨率归根结底都是对ADC采样后的数据进行数字信号处理,最终只能是在“软件”上提高了分辨率,并不能达到硬件上实现的性能,因为软件算法提高分辨率会产生副作用,影响采样率等关键指标,波形显示可能会发生失真现象等等。 1.3 改善等效分辨率 示波器都是如何通过改变算法来实现提高分辨率的呢? 1.3.1 几个基本概念 我们将ADC转换成的离散数字信号称为采样点,相邻采样点之间的时间称为采样时间
等精度数字频率计的设计与实现
FPGA/SOPC课程设计报告书 课题名称:等精度数字频率计的设计与实现 姓名: 学号: 院系:电子与信息工程系 专业:电子信息工程 指导教师: 时间:2012年6月
课程设计项目成绩评定表设计项目成绩评定表
课程设计报告书目录 设计报告书目录 一、设计目的 (1) 二、设计思路 (1) 三、设计过程 (1) 3.1、系统方案论证 (1) 3.2、模块电路设计 (3) 四、系统调试与结果 (4) 五、主要元器件与设备 (6) 六、课程设计体会与建议 (6) 6.1、设计体会 (6) 6.2、设计建议 (7) 七、参考文献 (7)
一、设计目的 1、熟悉DE2_70电路板的引脚安排。 2、掌握芯片的逻辑功能及使用方法。 3、了解面包板结构及其接线方法。 4、了解等精度数字频率计的组成及工作原理。 5、熟悉等精度数字频率计的设计与制作。 二、设计思路 1、设计测量计算频率电路。 2、设计译码显示电路。 三、设计过程 3.1、系统方案论证 等精度测频的实现方法可简化为如图1 所示的框图。图中CNT l和CNT2 是两个可控计数器, 标准频率( fs ) 信号从CN Tl的时钟输入端CLK 输入, 经整 形后的被测信号( fx ) 从CNT 2 的时钟输入端CLK输入。每个计数器中的CEN 输入端为使能端, 用来控制计数器计数。当预置闸门信号为高电平( 预置时间开始) 时, 被测信号的上升沿通过D触发器的输入端, 同时启动两个计数器计数; 同样, 当预置闸门信号为低电平( 预置时间结束) 时, 被测信号的上升沿通过 D触发器的输出端, 使计数器停止计数。 图1 等精度数字频率计设计原理
AD精确度和分辨率
ADC制造商在数据手册中定义ADC性能的方式令人困惑,并且可能会在应用开发中导致错误的推断。最大的困惑也许就是“分辨率”和“精确度”了——即Resolution和Accuracy,这是两个不同的参数,却经常被混用,但事实上,分辨率并不能代表精确度,反之亦然。本文提出并解释了ADC“分辨率”和“精确度”,它们与动态范围、噪声层的关系,以及在诸如计量等应用中的含义。 ADC动态范围,精确度和分辨率 动态范围被定义为系统可测量到的最小和最大信号的比例。 最大信号可为峰间值,零到峰(Zero-to-Peak)值或均方根(RMS)满量程。其中任何一个都会给出不同值。例如,对于一个1V正弦波来说: 峰间(满量程)值=2V 零到峰值=1V RMS满量程=0.707×峰值振幅=0.707×1V=0.707V 最小信号通常为RMS噪声,这是在未应用信号时测量的信号的均方根值。测量得到的RMS 噪声级别将取决于测量时使用的带宽。每当带宽翻倍,记录的噪声将增长1.41或3dB。 因此,一定要注意动态范围数字始终与某个带宽相关,而后者通常未被指定,这使记录的值变得没有意义。 器件的信噪比(SNR)和动态范围多数时候被定义为同一个值,即: 动态范围=SNR =RMS满量程/RMS噪声 并且经常使用dB作为单位,即 动态范围(dB) =SNR(dB) =20*Log10 (RMS满量程/RMS噪声) 与使用RMS满量程相反,一些制造商为了使图表看上去更漂亮,引用零到峰或峰间值,这使得最终的动态范围或SNR增加了3dB或9dB,因此我们需要仔细研究规范以避免误解。 在讨论ADC性能时,分辨率和精确度是经常被混用的两个术语。一定要注意,分辨率并不能代表精确度,反之亦然。 ADC分辨率由数字化输入信号时所使用的比特数决定。对于16位器件,总电压范围被表示为216 (65536)个独立的数字值或输出代码。因此,系统可以测量的绝对最小电平表示为1比特,或ADC电压范围的1/65536。 A/D转换器的精确度是指对于给定模拟输入,实际数字输出与理论预期数字输出之间的接近度。换而言之,转换器的精确度决定了数字输出代码中有多少个比特表示有关输入信号的有用信息。