0409moel

Finite Element Analysis (FEA) models are routinely being adopted for up-front automotive body structure design. FEA models serve two important functions: first, to assess a design versus an absolute target; second, to assess the performance of various design alternatives. Means of assessing model ca-pability are required to feed appropriate information into the design process. Being able to document model capability im-proves the credibility of the FEA model information. Previous work addressed assessing the absolute performance of model technology using a metric based on a statistical hypotheses test that determines membership in a reference set. This article extends the use of quality technology to determining the ca-pability of the FEA model to span the design space using De-signed Experiments. The advantage of a design of experiments (DOE) structure is that both the design effects and their sta-tistical significance are uncovered.
Computer Aided Engineering (CAE) has been replacing pro-totype testing in the automotive industry on a very large scale, due to ever-increasing prototype costs and time to market pres-sures. Indeed, the prohibitive prototype costs found in the aero-space industry have already led to it adopting a more CAE-based design philosophy. As with any industrial process, the issues of quality control and continuous improvement must be addressed, typically through some form of monitoring or pro-cess control. Unfortunately, this has not always been the case for CAE predictions.
A Quality Operating System (QOS) in accordance with ISO9001 should be developed to control and improve the CAE environment. One such attempt is suggested by NAFEMS,1 but the idea of CAE quality is not unique to them. An important aspect of a QOS is being able to objectively evaluate the pre-dictive performance of the analysis.
An objective metric to assess the baseline capability of CAE
models was developed in Reference 2. The metric is capable of determining the probability that a CAE model is represen-tative of test data based on a comparison of frequency response functions. This is accomplished by developing a statistic d based on the differences between the CAE model and test fre-quency response functions (FRFs). The metric d/s is a statistic where d represents the summation of the squared differences between a test article (or CAE prediction) and a reference set average at each frequency band, across all FRFs, as well as across all articles in the reference set while s represents the standard deviation at each frequency band pooled across all FRFs and test articles in the reference set. Consequently, d/s values less than or close to 1 indicate “no difference” between the test article (or CAE prediction) and the reference set. Un-der certain assumptions d/s is chi-squared distributed and the probability of the CAE model being representative of the test model can be ascertained.
In this article, the ability of FEA predictions to span the de-sign space is evaluated by comparing a hardware-designed ex-periment (DOE) to predicted results. This technique was ini-tially proposed to evaluate statistical energy analysis (SEA) model predictions.3-5 This article explores the predictive ca-pability of a FEA body model for both a BIW (Body-In-White)with fixed glass and a trimmed body model.
BIW with Fixed Glass Model
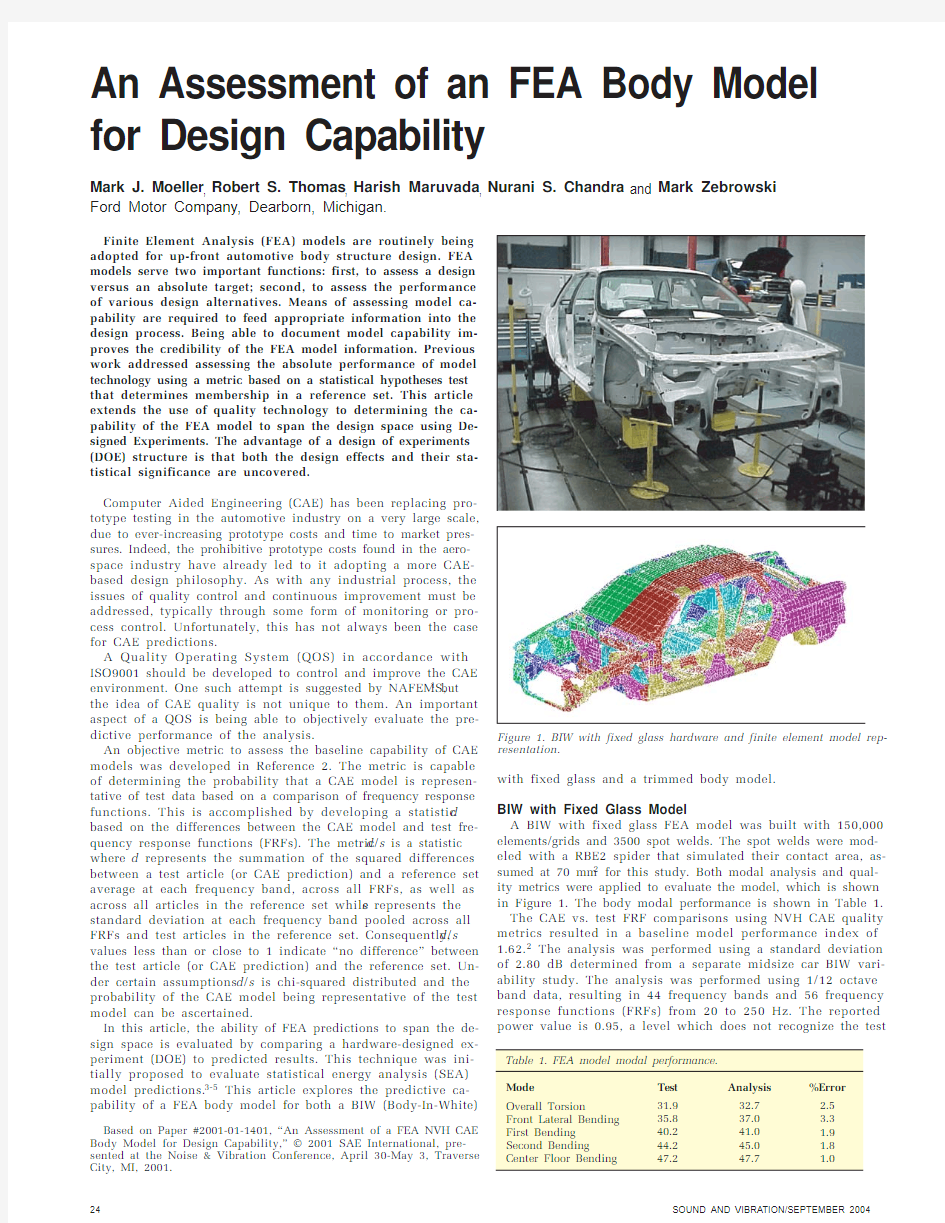
A BIW with fixed glass FEA model was built with 150,000 elements/grids and 3500 spot welds. The spot welds were mod-eled with a RBE2 spider that simulated their contact area, as-sumed at 70 mm2 for this study. Both modal analysis and qual-ity metrics were applied to evaluate the model, which is shown in Figure 1. The body modal performance is shown in Table 1. The CAE vs. test FRF comparisons using NVH CAE quality metrics resulted in a baseline model performance index of 1.62.2 The analysis was performed using a standard deviation of 2.80 d
B determined from a separate midsize car BIW vari-ability study. The analysis was performed using 1/12 octave band data, resulting in 44 frequency bands and 56 frequency response functions (FRFs) from 20 to 250 Hz. The reported power value is 0.95, a level which does not recognize the test
An Assessment of an FEA Body Model for Design Capability
Mark J. Moeller, Robert S. Thomas, Harish Maruvada, Nurani S. Chandra and Mark Zebrowski
Ford Motor Company, Dearborn, Michigan.
Based on Paper #2001-01-1401, “An Assessment of a FEA NVH CAE Body Model for Design Capability,” ? 2001 SAE International, pre-sented at the Noise & Vibration Conference, April 30-May 3, Traverse City, MI, 2001.
Figure 1. BIW with fixed glass hardware and finite element model rep-resentation.
results as a member of the test set. Sample FRFs are shown for both 0-100 Hz performance and 0-250 Hz performance in Fig-ure 2.Body-In-Prime DOE Study
In a brainstorming meeting, five design changes were se-lected to implement a DOE to assess the design space. Factor A was a quad box to rail reinforcement, Factor B was a tunnel strap, Factor C was a floor to roof pole, Factor D was an inverted V support between the rear shock towers and the rear floor, and Factor E was a front shock to radiator support. The five hard-ware changes are shown in Figure 3, while the test matrix for the hardware DOE is shown in Table 2.
Two drive points and 28 response points were selected for
Figure 2. Sample frequency response functions, 0 - 100 Hz.
Figure 2a. Sample frequency response function, 0 - 250 Hz.
Figure 2b. Sample frequency response function, 0 - 250 Hz.
Figure 3. A – quad box to rail support, B – tunnel strap, C – floor to
roof pole, D – rear shocks to rear floor support, E – front shock to ra-
diator support.
Figure 4. Factor effect for inverted V compared to noise estimate vs. frequency.
Figure 5. Effects plot for CAE and test for inverted V brace. Figure 6. Cross plot of test and CAE effects for inverted V.Figure 7. Factor effect comparison for K brace. Figure 8. Factor effect cross plot for front K brace. Figure 9. Effects plots for quad box to rail support.
the experiment. Frequency responses were measured and pre-
dicted for these points, and the points were distributed
throughout the body in prime. The drive points were on the
front rail laterally and the rear rail vertically. Because of ex-
cessively high noise estimates in the physical experiment, the
experiment was folded over resulting in a 16 trial experiment.
The data were processed with the NVH CAE quality metrics
to determine if the hardware changes resulted in statistically
significant changes to the vehicle. The results are shown in
Table 3. The test and CAE results for each run were compared
to the test and CAE baseline runs respectively. CAE success-
fully predicted the level of change compared to the baseline
in each case.
The data were then processed to determine the factor effects
for each of the drive points and the corresponding noise esti-
mates using Lenth’s method, with a typical result shown in Fig-
ure 4. The red line shows the factor effect and the dashed lines
represent the noise estimate at the 80% level of statistical sig-
nificance. An effect that falls inside the dashed line could be
due to mere chance variation.
The same DOE structure was exercised for the CAE model
and the CAE effect plots were generated. The CAE effect plots
can then be compared to the test effects as in Figure 5, which
shows the measured effect in black and the CAE effect in red.
Note the similarity between the two curves. The trend in the
Figure 10. Cross plot for quad box to rail support.
Figure 11. Flagpole factor, trimmed body.
data suggests that the CAE is a good representation of the test. This information can be presented in another form by cross plotting the test effects versus the CAE effects, shown in Fig-ure 6. Exact replication would be a straight line through the origin with unity slope. Detailed examination of the effect plot shows that although the plots are similar, some of the predicted effects are one to two frequency bins off, resulting in some scat-ter in the cross plot. These same plots are shown for the K brace at the front of the car in Figures 7 and 8.
Figures 7 and 8 show good physical representation of the fac-tor effects in the finite element model. Optimization requires that the effects are small. Figures 9 and 10 show the transfer function for the quad box to rail support effect. Here it is im-portant to note that around the cross plot origin there is a re-gion of uncertainty due to the noise in the experiment and the effects could not be resolved.
Trimmed Body DOE Study
The FEA BIP model was trimmed to include closures (doors/ fenders/hood/decklid), instrument panel, steering column/ wheel assembly, seats, bumpers, fueltank, and other body items (mirrors, radio, antenna, fuel-filler door etc.) represented as a lumped mass. Carpeting (in door panels, dash panel, floor panel and package tray area) and mastic material on the floor and dash were simulated as “non structural masses,” while paint, primer, nuts, bolts, washers, etc. were accounted through density adjustments.
The trimmed body was exercised for design effects using the same hardware changes and experimental design as exercised for the BIW experiment. The hardware changes are illustrated in Figures 11-13.
The data were processed with the NVH CAE quality metrics to determine if the hardware changes resulted in statistically significant changes to the vehicle. The results are shown in Table 4. The test and CAE results for each run were compared to the test and CAE baseline runs respectively. The results as shown in Table 4 indicate that the CAE and the test show simi-lar trends. However, unlike the Body-In-Prime (BIP) case, the design modifications do not seem to influence the trimmed body transfer functions significantly.
Directionally, the CAE predictions are as good as the tests. However, the CAE model overpredicts every DOE run com-
pared to the tests. Figures 14-17 illustrate the effects plot for Factors D (inverted V brace) and E (front shock lateral brace).
1.The chosen design factors do not seem to significantly alter the trimmed body performance characteristics, unlike as in BIP. The metric d/s is no more than 0.7 for the body configu-ration with all 5 design factors, well within the statistical sig-nificance (d/s < 1.0) of concluding that all eight body con-figurations belong to the same ensemble.
2.CAE is directionally consistent with the tests but seems to overpredict the effect of the design factors.
3.The metric d/s for trimmed body baseline CAE is 1.82 with Figure 12. Front K brace, trimmed body.
Figure 13. Inverted V factor, trimmed body.
Figure 14. Effects plot for front K brace, trimmed body.
Figure 15. Cross plot for front K brace, trimmed body.
Figure 16. Effects plot for inverted V , trimmed body.
Figure 17. Cross plot for inverted V
, trimmed body.
reference to the test baseline (ideally one would expect a 1.0).This was 1.62 at the BIP level.
4.For the chosen design factors and the responses, either the model is not good enough for design change evaluations,and/or the design changes are not significant enough to in-fluence trimmed body characteristics beyond the noise level.This could very well explain scatter in the “scatter plot.”
Conclusion
This article via two examples demonstrates that it is feasible to objectively assess the capability of a NVH CAE finite element model to span the design space. The models presented here were shown to be capable for Body-in-Prime predictions, while the predictability of the trimmed body was degraded.
It is possible to assess both baseline and model design capa-bility. Any QOS for NVH CAE must include both components in its objective assessment of capability.
Acknowledgments
Many people at Ford working on the NVH CAE Quality project contributed to this effort including Paul Conti, Jim Lewis and Ross Wiley.
References
1. NAFEMS QAWG, “Quality System Supplement to ISO 9001 Relat-ing to Finite Element Analysis in The Design and Validation of En-gineering Products,” Issue 1.3, 2 July 1993.
2. Moeller, M. J., Thomas, R. S., Chen, S. E., Chandra, N. and Lenk, P.,“NVH CAE Quality Metrics,” SAE Noise and Vibration Conference,
SAE Paper 1999-01-1791, Traverse City, MI, May 1999.
3. Thomas, R. S., Pan, J., Moeller, M. J. and Nolan, T., “Improving SEA Models Using Quality Technology,” Noise Control Engineering Jour-nal , January 1997.
4. Pan, J., Thomas, R. S. and Moeller, M. J., “Verifying Vehicle SEA Model Predictions for Airborne Noise Transmission Using Designed Experiments,” Inter-Noise, Liverpool, UK, April 1996.
5. Huang, X., Moeller, M. J., Powell, R. E., and Lee, J., “Application of Statistical Energy Analysis (SEA) to the Development of a Light Truck Sound Package,” IUTAM Symposium on Statistical Energy Analysis,July 1997.
Additional Sources
1. Roache, P. J., Verification and Validation in Computational Science and Engineering , Hermosa Publishers, ISBN 0-913478-08-3, Albu-querque, NM, 1998.
2. The SAFESA Consortium, “SAFESA Technical Manual to Structural Qualification Supported by Finite Element Analysis,” published by NAFEMS, Ref. R0041.
3. Ray, M. H., “Repeatability of Full-Scale Crash Tests and a Criteria for Validating Simulation Results,” In Transportation Research
of Sciences, Washington, D.C., January 1996.The authors can be contacted at: mzebrows@https://www.360docs.net/doc/3a11245431.html, and mmoeller@https://www.360docs.net/doc/3a11245431.html, .