剑桥雅思1-4 Writing_Task_1小作文范文

剑一--Test 3—Task1 (bar chart combined with line graph)
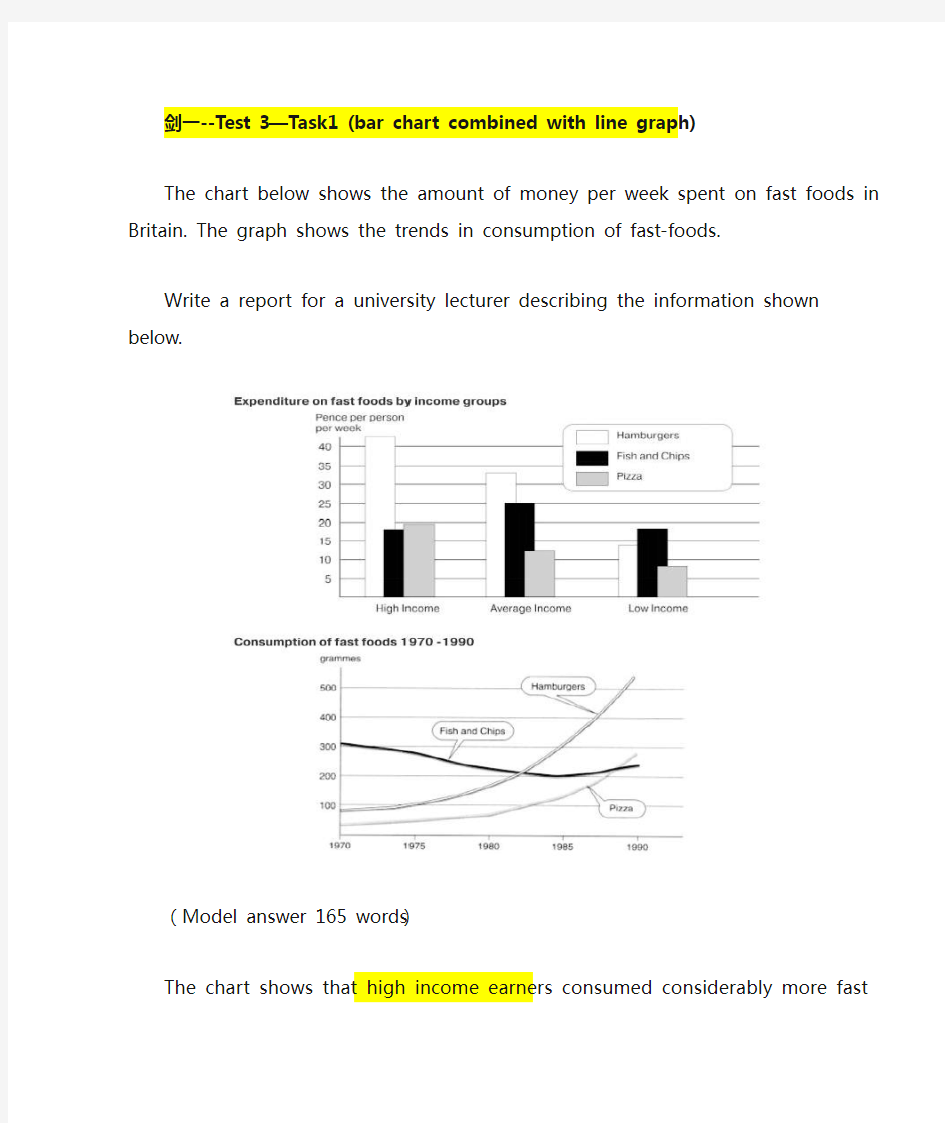
The chart below shows the amount of money per week spent on fast foods in Britain. The graph shows the trends in consumption of fast-foods.
Write a report for a university lecturer describing the information shown below.
(Model answer 165 words)
The chart shows that high income earners consumed considerably more fast foods than the other income groups, spending more than twice as much on hamburgers (43 pence per person per week) than on fish and chips or pizza(both under 20 pence). Average income earners also favoured hamburgers,spending 33 pence per person per week, followed by fish and chips at 24 pence,then pizza at 11 pence. Low income earners appear to spend less than otherincome groups on fast foods, though fish and chips remains their most popularfast food, followed by hamburgers and then pizza.
From the graph we can see that in 1970, fish and chips were twice as popular
asburgers, pizza being at that time the least popular fast food. The consumption ofhamburgers and pizza has risen steadily over the 20 year period to 1990 while theconsumption of fish and chips has been in decline over that same period with aslight increase in popularity since 1985.
剑二-Test1-Task1(Table)
The table below shows the consumer durables (telephone, refrigerator, etc.) owned in Britain from 1972 to 1983.
Write a report for a university lecturer describing the information shown below.
The chart shows that the percentage of British households with a range of consumer durables steadily increased between 1972 and 1983. The greatest increase was in telephone ownership, rising from 42% in 1972 to 77% in 1983. Next camecentral heating ownership, rising from 37% of households in 1972 to 64% in 1983. The percentage of households with a refrigerator rose 21% over the same period and of those with a washing machine by 14%. Households with vacuum-cleaners, televisions and dishwashers increased by 8%, 5% and 2%, respectively. In 1983, the
year of their introduction, 18% of households had a video recorder.
The significant social changes reflected in the statistics are that over the period the proportion of British houses with central heating rose from one to two thirds, and of those with a phone from under a half to over three-quarters. Together with the big increases in the ownership of washing machines and refrigerators, they are evidence of both rising living standards and the trend to lifestyles based on comfort and convenience.(173 words)
剑二-Test2-Task1(Bar chart)
The chart below shows the amount of leisure time enjoyed by men and women of different employment status.
Write a report for a university lecturer describing the information shown below.
The chart shows the number of hours of leisure enjoyed by men and women in a typical week in 1998-9, according to gender and employment status.
Among those employed full-time, men on average had fifty hours to leisure, whereas women had approximately thirty-seven hours. There were no figures given for male part-time workers, but female part-time had forty hours of leisure time, only slightly more than women in full-time employment, perhaps reflecting their work in
the home.
In the unemployed and retired categories, leisure time showed an increase for both sexes, as might have been expected. Here too, men enjoyed more leisure time—over eighty hours, compared with seventy hours for women, perhaps once again reflecting the fact that women spend more time working in the home than men.
Lastly, housewives enjoyed approximately fifty-four hours of leisure, on average. There were no figures given for househusbands! Overall, the chart demonstrates that in the categories for which statistics on male leisure time were available, men enjoyed at least ten hours of extra leisure time. (173 words)
剑二-Test3-Task1(Table)
Band 7
剑二-Test4-Task1(Bar chart)
The table below shows the figures for imprisonment in five countries between 1930 and 1980.
Write a report for a university lecturer describing the information shown below.
The table shows that figures for imprisonment in the five countries mentioned indicate no overall pattern of increase of decrease. In fact there is considerable fluctuation from country to country.
In Great Britain the numbers in prison have increased steadily 30,000 to 80,000 in 1980. On the other hand in Australia, and particularly in New Zealand, the numbers fell markedly from 1930 to 1940. Since then they have increased gradually, apart from in 1980 when the numbers in prison in New Zealand fell by about 30,000 from the 1970 total. Canada is the only country in which the numbers in prison have decreased over the period 1930 and 1980, although there have been fluctuations in this trend. The figures for the United States indicate the greatest number of prisoners compared to the other four countries but population size needs to be taken into account in this analysis. The prison population in the United States increased rapidly from 1970 to 1980 and this must be a worrying trend. (167 words)
剑七-Test3-Task1 ( Bar chart)
Band 6.5
剑四-Test1-Task1
The table gives a breakdown of the different types of family who were living in poverty in Australia in 1999.
On average, 11% of all households,comprising almost two million people, were in this position. However, those consisting of only one parent or a single adult had almost double this proportion of poor people, with 21% and 19% respectively. Couples generally tended to be better off, with lower poverty levels for couples without children(7%) than those with children(12%). It is noticeable that for both types of household with children, a higher than average proportion were living in poverty at this time. Older people were generally less likely to be poor, though once
again the trend favoured elderly couples(only 4%) rather than single elderly people(6%).
Overall the table suggests that households of single adults and those with children were more likely to be living in poverty than those consisting of couples.
剑四-Test3-Task1
The chart gives information about post-school qualifications in terms of the different levels of further education reached by men and women in Australia in 1999.
We can see immediately that there were substantial difference in the proportion of men and women at different levels. The biggest gender difference is at the lowest post-school level, where 90% of those who held a skilled vocational diploma were men, compared with only 10% of women. By contrast, more women held undergraduate diplomas(70%) and marginally more women reached degree level(55%). At the higher levels of education, men with postgraduate diplomas clearly outnumbered their female counterpart (70% and 30%, respectively), and also constituted 60% of Master’s graduates.
Thus we can see that more men than women hold qualifications at the lower and higher levels of education, while more women reach undergraduate diploma level than men. The gender difference is smallest at the level of Bachelor’s degree, however.
(完整版)剑桥英语10雅思考官范文(大作文小作文)
剑10 1-2 It is important for children to learn the difference between right and wrong at an early age. Punishment is necessary to help them learn this distinction. To what extent do you agree or disagree with this opinion? What sort of punishment should parents and teachers be allowed to use to teach good behavior to children? One important stage in a child 'gsr owth is certainly the development of a conscience, which is linked to the ability to tell right from wrong. This skill comes with time and good parenting, and my firm conviction is that punishment does not have much of a role to play in this. Therefore I have to disagree almost entirely with the given statement. To some extent the question depends on the age of the child. To punish a very young child is both wrong and foolish, as an infant will not understand what is happening or why he or she is being punished. Once the age of reason is reached however, a child can be rewarded for good behavior and discouraged from bad. This kind but firm approach will achieve more than harsh punishments, which might entail many negative consequences unintended by the parents. To help a child learn the difference between right and wrong, teachers and parents should firstly provide good role modelling in their own behavior. After that, if sanctions are needed, the punishment should not be of a physical nature, as that merely sends the message that it is acceptable for larger people to hit smaller ones-an outcome which may well result in the child starting to bully others. Nor should the punishment be in any way cruel. Rather, teachers and parents can use a variety of methods to discipline their young
剑桥雅思A类大作文题目集合
Cambridge IELTS 4 TEST 1: Compare the advantages and disadvantages of three of the following as media for communicating information. State which you consider to be is the most effective. Comics, books, radio, television, film, theatre Cambridge IELTS 4 TEST 2: Happiness is considered very important in life. Why is it difficult to define What factors are important in achieving happiness Cambridge IELTS 4 TEST 3: Creative artists should always be given the freedom to express their own ideas (in words, pictures, music or film) in whichever way they wish. There should be government restrictions on what they do. To what extent do you agree or disagree with this opinion Cambridge IELTS 4 TEST 4: In many countries schools have severe problems with student behavior. What do you think are the causes of this What solutions can you suggest Cambridge IELTS 5 TEST 1: Universities should accept equal numbers of male and female students in every subject. To what extent do you agree or disagree Cambridge IELTS 5 TEST 2: In some countries young people are encouraged to work or travel for a year between finishing high school and starting university studies. Discuss the advantages and disadvantages for young people who decide to do this. Cambridge IELTS 5 TEST 3: Some people think that a sense of competition in children should be encouraged. Others believe that children who are taught to co-operate rather than compete become more useful adults. Discuss both these views and give your own opinion. Cambridge IELTS 5 TEST 4: Research indicates that the characteristics we are born with have much more influence on our personality and development than any experiences we may have in our life. Which do you consider to be the major influence Cambridge IELTS 6
剑桥雅思1-4 Writing_Task_1小作文范文
剑一--Test 3—Task1 (bar chart combined with line graph) The chart below shows the amount of money per week spent on fast foods in Britain. The graph shows the trends in consumption of fast-foods. Write a report for a university lecturer describing the information shown below. (Model answer 165 words) The chart shows that high income earners consumed considerably more fast foods than the other income groups, spending more than twice as much on hamburgers (43 pence per person per week) than on fish and chips or pizza(both under 20 pence). Average income earners also favoured hamburgers,spending 33 pence per person per week, followed by fish and chips at 24 pence,then pizza at 11 pence. Low income earners appear to spend less than otherincome groups on fast foods, though fish and chips remains their most popularfast food, followed by hamburgers and then pizza. From the graph we can see that in 1970, fish and chips were twice as popular
2019年雅思小作文范文:剑桥雅思5册29页作文-范文模板 (1页)
2019年雅思小作文范文:剑桥雅思5册29页作文-范文模板 本文部分内容来自网络整理,本司不为其真实性负责,如有异议或侵权请及时联系,本司将立即删除! == 本文为word格式,下载后可方便编辑和修改! == 雅思小作文范文:剑桥雅思5册29页作文 This line chart shows the changes in the proportion of the elderly people in three countries from 1940 till today . Moreover , it offers predictions for a period to 2040. 注意趋势描述的语言,对照对比的点和表达方式 During the three score years , the USA generally outweighed Sweden in terms of the proportion of those aged 65 and over . But the gaps between have never been remarkable . In stark contrast , Sweden strikingly eclipsed Japan in this aspect evidenced by the fact that in 1940 the proportion for the USA was about 9%, clearly higher than 5% for Japan . Whereas Japan experienced declines from 5% to 3% , both Sweden and the USA climbed . Put it in detail , by the year 1983, the figures have peaked at 15% and 13% in the USA and Sweden respectively . Noticeably , in 1997 the proportion in the USA was equal to that in Sweden . According to the forecast , from now on , all of the three countries will skyrocket although exceptions might happen . However , by 2040 the proportion will have peaked at 27%, 25%, and 23% in Japan , Sweden , and the USA respectively . In sum , the three countries are different in the field under study .
李高岩-剑桥9 Test3小作文 A类5分雅思小作文
1.作文题目:剑桥9 Test3小作文 The charts below give information on the ages of the populations of Yemen and Italy in 2000 and projections for 2050. Summarise the information by selecting and reporting the main features, and make comparisons where relevant. 2.考生原文: These pie charts illustrates what proportion are accounted by human in respective age group of Yemen and Italyin 2002, and predicting the future changes to 2050. In Yemen, 0-14 years old young childrenwere the domain group in 2000, at 50.1%. And smaller proportion of 15-19 years old person in the same period, which was 46.3%. While 50 years past, 15-59 years old people willbecome the mostgroup of people, rising to 57.3%. Although there is a increase in old people who are over 60 years old. But theystill the least group of person, which were risingfrom 3.6% in 2000 to 5.7% in 2005.
剑桥雅思大作文A类题目
剑桥雅思作文题目-大作文 目录 IELTS 8 ............................................................. Test 1.......................................................... Test 2.......................................................... Test 3.......................................................... Test 4.......................................................... IELTS 7............................................................. Test 1.......................................................... Test 2 P165..................................................... Test 3 P167..................................................... Test 4.......................................................... IELTS 6............................................................. Test 1.......................................................... Test 2.......................................................... Test 3.......................................................... Test 4 P99 P168................................................. IELTS 5............................................................. Test 1.......................................................... Test 2.......................................................... Test 3.......................................................... Test 4 P99 P169................................................. IELTS 4............................................................. Test 1.......................................................... Test 2.......................................................... Test 3.......................................................... Test 4.......................................................... IELTS 3............................................................. Test 1.......................................................... Test 2.......................................................... Test 3.......................................................... Test 4.......................................................... IELTS 8 Test 1 Task 1 Pie chart Table Task 2 Some people think that parents should teach children how to be good members of society. Others, however, believe that school is the place to learn this. Discuss both these views and give your own opinion. Test 2
剑桥雅思考官写作范文:Major influence on your personality
剑桥雅思考官写作范文:Major influence on your personality 本文剑桥雅思考官写作范文的Topic是Research indicates that the characteristics we are born with have much more influence on your personality and development than any experiences we may have in our life. Which do you consdier to be the major influence? 剑桥雅思考官写作范文对于雅思考生来说具有很好的参考价值,望考生从中学习到其优点,在今后的雅思写作当中合理运用。 Topic: Research indicates that the characteristics we are born with have much moreinfluence on your personality and development than any experiences we may havein our life. Which do you consdier to be the major influence? 题目:研究显示,我们与生俱来的特点对我们的影响比后天的得到的经验大。那你认为什么是最大的影响因素呢? 剑桥雅思考官写作范文: Today the way we consider human psychology and mental development isheavily influenced by the genetic sciences. We now understand the importance ofinhereited characteristics more than ever before. Yet we are still unable todecide whether an individual's
作文范文之雅思小作文真题
作文范文之雅思小作文真题
雅思小作文真题 【篇一:雅思作文题目汇总】 一、教育 1、教育应该包括哪些内容? 母题:it is generally believed that education is of vital importance to the development of individuals and the well-being of societies. what should education consist of to fulfil both these functions? (050312) 提示:本题围绕教育的两大功能来展开(个人与社会),准备好这篇文章,即可应付教育类话题中的最大分支—教育的功能,做到以不变应万变。对于社会角度,可以从促进经济发展、增加社会流动性(social mobility)、维护社会稳定这几个方面来展开,对于个人,可以写改变思维模式、有利于就业和便利生活来写。 子题:大学应当教授理论知识还是实践技能?大学的是应当把学生培养成合格的公民还是让他们自己得益?准备未来职业最好的方法是上大学还是尽快离校积累工作经验?大学要不要扩招?中学阶段应当提供通才教育还是专才教育?要不要延长义务教育年限?要不要让农村地区的学生更容易上学?老师要教学生如何判断是非吗? 2、学校的科目谁来选择?(060916) 母题:some people think that the government should decide which subjects students should study at the university, while others think that students should be allowed to apply for the subject they prefer. discuss the two views and give your opinion. 提示:这类题目采取的策略就是“双批判”,因为题目中提供的两种选择往往都是错误的。
最新剑桥雅思4-9小作文题目分类汇总
题型1——Table(表格) Cambridge IELTS 4 TEST 1: The table below shows the proportion of different categories of families living in poverty in Australia in 1999. Summarise the information by selecting and reporting the main features, and make comparisons where relevant.
TEST 4: The table below gives information about the underground railway systems in six cities. Summarise the information by selecting and reporting the main features, and make comparisons where relevant.
TEST 2: The table below gives information about changes in modes of travel in England between 1985 and 2000. Summarise the information by selecting and reporting the main features, and make comparisons where relevant.
剑桥雅思考官写作范文:The media report crimes in details
剑桥雅思考官写作范文:The media report crimes in details 本文剑桥雅思考官写作范文的Topic是Should the media report crimes in details?。剑桥雅思考官写作范文对于雅思考生来说具有很好的参考价值,望考生从中学习到其优点,在今后的雅思写作当中合理运用。 Topic:Should the media report crimes in details? 题目:媒体报道犯罪活动时是否应该报道细节。 剑桥雅思考官写作范文: Nowadays the media often cover news of crimes such as murder, rape andarmed robbery in great details. While such information may warn the public ofthe potential danger and help reduce crimes, providing too much informationabout crimes might lead to certain negative side effects. In my opinion, theinformation about crimes should be made accessible to the public but the mediashould refrain from reporting crimes in an irresponsible manner. To begin with, there is no doubt that people should have the right toinformation about crimes committed in a community. If someone in theneighbourhood were murdered, the chance of other people being killed would alsoincrease. The people should be notified of the event as
最新剑桥雅思小作文Task题目汇总
Cambridge IELTS 1~12 剑桥雅思作文真题集 小作文 Writing Task 1 Content Cambridge IELTS 1-Test 1 静态- bar+pie ................................................................ Cambridge IELTS 1-Test 2 flow chart ........................................................................ Cambridge IELTS 1-TEST 3 静+动bar+line.............................................................. Cambridge IELTS 1-TEST 4 map................................................................................. Cambridge IELTS 2-TEST 1 动态– table................................................................... Cambridge IELTS 2-TEST 2 静态– bar ..................................................................... Cambridge IELTS 2-TEST 3 动态– table................................................................... Cambridge IELTS 2-TEST 4 动态– bar ..................................................................... Cambridge IELTS 3-TEST 1 动态– bar + line ........................................................... Cambridge IELTS 3-TEST 2 静态– bar ..................................................................... Cambridge IELTS 3-TEST 3 动态– bar ..................................................................... Cambridge IELTS 3-TEST 4 动态– line..................................................................... Cambridge IELTS 4-TEST 1 静态– table................................................................... Cambridge IELTS 4-TEST 2 动态– line + pie ........................................................... Cambridge IELTS 4-TEST 3 静态– bar ..................................................................... Cambridge IELTS 4-TEST 4 动态– line + bar ........................................................... Cambridge IELTS 5-TEST 1 动态– line..................................................................... Cambridge IELTS 5-TEST 2 静态– bar ..................................................................... Cambridge IELTS 5-TEST 3 map................................................................................. Cambridge IELTS 5-TEST 4 静态– table...................................................................
雅思写作高分之路-怎样更好地利用剑桥雅思范文
怎样更好地利用剑桥雅思范文 ---雅思写作7分应该这样炼成 作者前言: 雅思写作高分到底有没有捷径?这是一个很多同学都非常关心的问题。我的答案简单明了:没有!绝对没有。雅思考试之所以被公认为世界上目前为止,最权威的英语应用能力测试系统,就是因为它能够真正地反映出我们实际的英语应用能力,如果像某些“名师”忽悠的那样可以在10天内彻底解决雅思写作问题,甚至获得7分以上高分的话,那雅思考试还谈什么权威性了?! 英语实际运用能力的提高是不可能一蹴而就的,但是我认为,对于大多数中国的高中、大学考生来说,在对雅思作文基本要求了解后,经过一些简单练习,我们都可以写出5分至5.5分的水平,但是如果要在此基础上跨越6分,绝对需要1个月的针对性训练,要考到7分以上,则需要更长时间的努力。虽然说捷径是没有,但是针对性的、能够事半功倍的训练与教学方法是肯定有的。 剑桥系列教材中的范文及考官评语就是值得我们充分利用的最好素材。我将在本文中针对剑桥7中的8篇范文及考官评语进行比较详细地解析,希望能够给广大雅思写作考生提供一些启发、帮助。由于水平有限,肯定有需要提高的、不完全准确的地方,还请谅解。 完美雅思ROCK- 赵岩
第一:怎样利用好剑桥系列教材中的范文。 范文利用好,对我们迅速提高自己的写作水平是非常有帮助的。范文数量不多,尤其是带考官评语、评分的更少,所以大家一定要对其充分利用。如果有时间,建议大家在仔细阅读每篇范文前自己先写一篇,可以稍微多花一点时间,尽量发挥自己最好的水平。然后,再对照范文,进行一下比对,看看自己那方面不足,哪方面做的好一点,最后再看看考官对该范文优缺点的点评和评分。这样我们就可以对自己作文水平有一个比较好的判断,而且对范文中的优缺点、自己文章中的优缺点,特别是需要提高的地方,有一个更清楚地认识,这对迅速提高我们自己的写作水平、争取更好的写作成绩是非常重要的。如果有些同学已经马上就要考试了,感觉自己动手写的时间不够,那么你至少应该花足够时间好好去审题,然后写一个草稿,把自己文章的观点、文章结构、主要的论据列出。然后再对比该范文及考官对范文的评价,这样也有助于我们分析自己的文章对比范文有何不足、有何值得学习的地方,这样利用范文去提高我们自己的写作能力、分数,我认为是最有价值的。 第二:雅思作文评分标准即考官对我们作文评分的依据。 兵法云:知己知彼,百战不殆。我们要想获得雅思高分,就必须先了解什么样的雅思作文可以得到6分、7分甚至8分,也可以说我们要清楚为什么考官只给了我们的作文5分,5.5分,甚至更低的分数。对这个问题清楚了,我们才能对自己目前写作中的弱点、丢分点有一个基本了解,才能够清楚自己下一步努力提高的地方在哪里,事半功倍的针对性训练也才finally Mission Possible. 所以,建议大家仔细研究一下,下面考官写作评分标准的内容,然后对照自己的文章,总结一下自己目前主要的问题在哪些方面。 小作文Task 1评分标准(Band 5 ~ 9) 详细内容请参照33页、34页!
2016雅思小作文真题汇总
2016年1月9日雅思写作真题之雅思小作文TASK1 男女同学在课外参加体育运动的时常比例。 difference in the percentage of sports in outdoor school hours TASK1 日雅思写作真题之雅思小作文1月142016年The number of people taking part in a wildlife survey in Britain between 2001 and 2009. TASK1
日雅思写作真题之雅思小作文月年2016123The three pie charts below show the production, consumption of coffee and where the profit goes around the world. )数据仅供参考( 2016年1月30日雅思写作真题之雅思小作文TASK1 Task 1 The diagram shows how an office building looks at
present and the plan for its future development. TASK1 月年2016218日雅思写作真题之雅思小作文 Changes of average monthly salary and prices of black and white TV in Japanese Yen from 1953 to 1973 TASK1日雅思写作真题之雅思小作文2月20年2016
The chart and graph show the categories of workforce in Australia and the unemployment within 3 groups. 2016年2月27日雅思写作真题之雅思小作文TASK1 Task 1 The graph below shows the unemployment rate in Ireland and the number of people leaving the country between 1998 and 2008. TASK1
雅思小作文9分剑桥雅思11册task1
This line graph shows the discharge of co2from per citizen who live in UK, Sweden, Italy and Portugal from 1967 to 2007. The line graph demonstrates the change of green house gas emmissions per person in four European countries (UK, Sweden, Italy & Portugal) from 1967 to 2007. In 1967, the number of Portugal was the least among these four countries, In Sweden, Average CO2 emmissions experienced a sharp increase from around 9 metric tonnes in 1967 to 10.5 metric tones in 1977, which followed by drastic decline until 1987. After that, the figure dropped steadily from 7 metric tonnes in 1987 to around 5 metric tonnes in 2007. From 1967 to 2007, Average CO2 emmissions per person in Italy and portugal were similar and followed the same trend. In 1967, the figure stood ar 6.2 metric tonnes in Italy and 2.2 metric tonnes in Portugal, and grew to 7.8 and 5.4 metric tonnes respectiveli in 1997, then remained stable from 1997 to 2007. In 1967, which was a bit more that 1 metric tons, at the same time, the figure of UK was the most that was about 11 metric tons. On the following decade, except UK, the number of other three countries continued raising, while the of UK went down a little. However, there was a sudden drop happened to Sweden after 1977, but Italy and Portugal kept going up. The figure of UK still fell, but it was the most, for it took the number of 10 metric tons in 1987, and that of Italy was the same as Sweden, at the number of about 6.5. On the next two decades, Sweden and UK kept down and Italy and Portugal raised. And at last in 2007, the number of Sweden was as much as