ASTM材料与实验标准.A348A348M

Designation:A348/A348M–05
Standard Test Method for
Alternating Current Magnetic Properties of Materials Using the Wattmeter-Ammeter-Voltmeter Method,100to10000Hz and25-cm Epstein Frame1
This standard is issued under the?xed designation A348/A348M;the number immediately following the designation indicates the year of original adoption or,in the case of revision,the year of last revision.A number in parentheses indicates the year of last reapproval.
A superscript epsilon(e)indicates an editorial change since the last revision or reapproval.
1.Scope
1.1This test method covers the determination of the mag-netic properties of?at-rolled magnetic materials using Epstein test specimens with double-lap joints in the25-cm Epstein frame.It covers determination of core loss,rms and peak exciting current,exciting power,magnetic?eld strength,and permeability.This test method is commonly used to test grain-oriented and nonoriented electrical steels but may also be used to test nickel-iron,cobalt-iron,and other?at-rolled magnetic materials.
1.2This test method shall be used in conjunction with Practice A34/A34M and Test Method A343/A343M.
1.3Tests under this test method may be conducted with either normal ac magnetization or with ac magnetization and superimposed dc bias(incremental magnetization).
1.4In general,this test method has the following limita-tions:
1.4.1Frequency—The range of this test method normally covers frequencies from100to10000Hz.With proper equipment,the test method may be extended above10000Hz. When tests are limited to the use of power sources having frequencies below100Hz,they shall use the procedures of Test Method A343/A343M.
1.4.2Magnetic Flux Density(may also be referred to as Flux Density)—The range of magnetic?ux density for this test method is governed by the test specimen properties and by the available instruments and other equipment components.Nor-mally,for many materials,the magnetic?ux density range is from1to15kG[0.1to1.5T].
1.4.3Core Loss and Exciting Power—These measurements are normally limited to test conditions that do not cause a test specimen temperature rise in excess of50°C or exceed100 W/lb[220W/kg].
1.4.4Excitation—Either rms or peak values of exciting current may be measured at any test point that does not exceed the equipment limitations provided that the impedance of the ammeter shunt is low and its insertion into the test circuit does not cause appreciably increased voltage waveform distortion at the test magnetic?ux density.
1.4.5Incremental Properties—Measurement of incremental properties shall be limited to combinations of ac and dc excitations that do not cause secondary voltage waveform distortion,as determined by the form factor method,to exceed
a shift of10%away from sine wave conditions.
1.5The values and equations stated in customary(cgs-emu and inch-pound)or SI units are to be regarded separately as standard.Within this standard,SI units are shown in brackets except for the sections concerning calculations where there are separate sections for the respective unit systems.The values stated in each system may not be exact equivalents;therefore, each system shall be used independently of the https://www.360docs.net/doc/4c15320226.html,bin-ing values from the two systems may result in nonconformance with this standard.
1.6This standard does not purport to address all of the safety concerns,if any,associated with its use.It is the responsibility of the user of this standard to establish appro-priate safety and health practices and determine the applica-bility of regulatory limitations prior to use.
2.Referenced Documents
2.1ASTM Standards:2
A34/A34M Practice for Sampling and ProcurementTesting of Magnetic Materials
A340Terminology of Symbols and De?nitions Relating to Magnetic Testing
A343/A343M Test Method for Alternating-Current Mag-netic Properties of Materials at Power Frequencies Using Wattmeter-Ammeter-V oltmeter Method and25-cm Epstein Test Frame
3.Summary of Test Method
3.1A representative sample of the magnetic material is cut into Epstein strips and then annealed or otherwise treated in
1This test method is under the jurisdiction of ASTM Committee A06on
Magnetic Properties and is the direct responsibility of Subcommittee A06.01on Test Methods.
Current edition approved Nov.1,2005.Published December2005.Originally approved https://www.360docs.net/doc/4c15320226.html,st previous edition approved in2000as A348/A348M–00.
2For referenced ASTM standards,visit the ASTM website,https://www.360docs.net/doc/4c15320226.html,,or contact ASTM Customer Service at service@https://www.360docs.net/doc/4c15320226.html,.For Annual Book of ASTM Standards volume information,refer to the standard’s Document Summary page on the ASTM website.
Copyright?ASTM International,100Barr Harbor Drive,PO Box C700,West Conshohocken,PA19428-2959,United States.
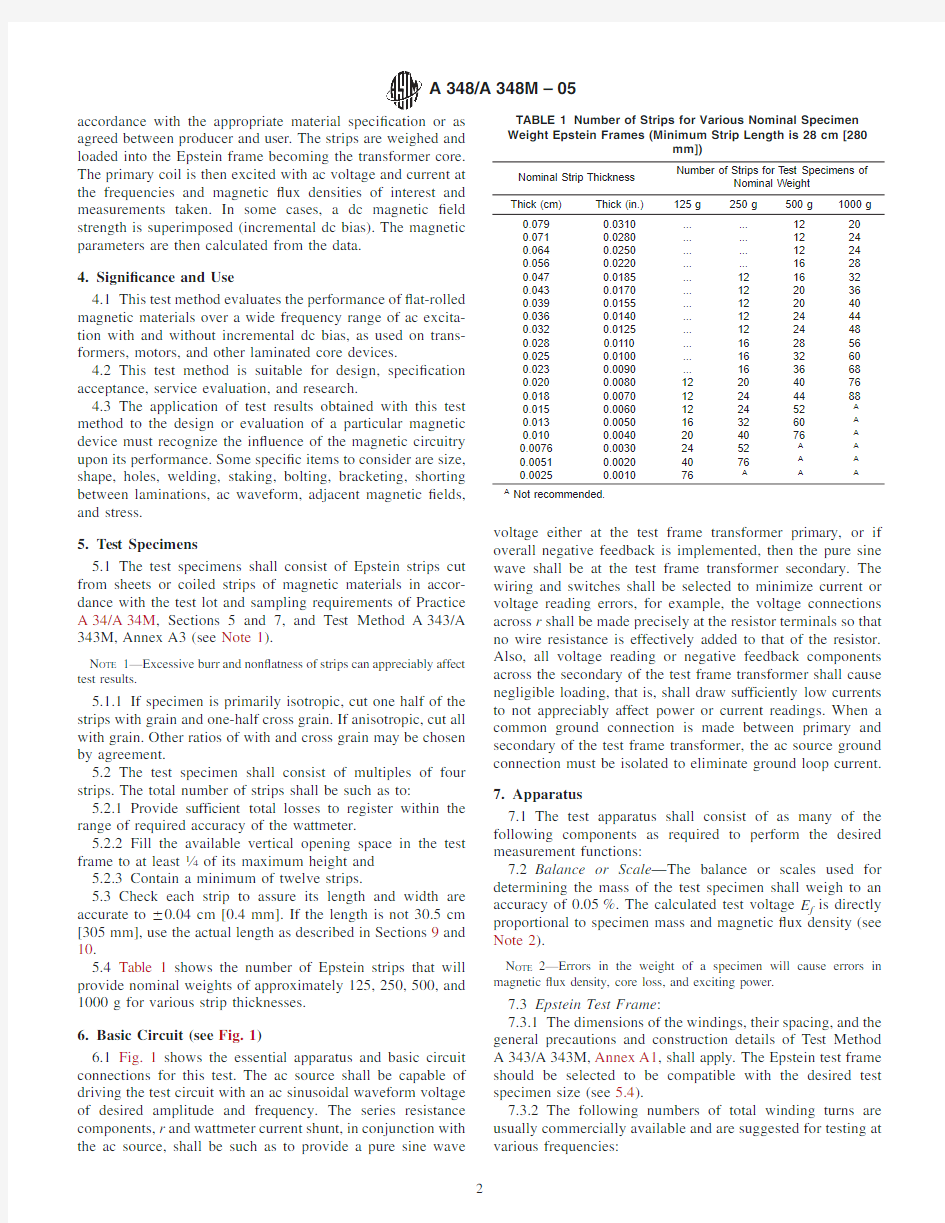
accordance with the appropriate material speci?cation or as agreed between producer and user.The strips are weighed and loaded into the Epstein frame becoming the transformer core. The primary coil is then excited with ac voltage and current at the frequencies and magnetic?ux densities of interest and measurements taken.In some cases,a dc magnetic?eld strength is superimposed(incremental dc bias).The magnetic parameters are then calculated from the data.
4.Signi?cance and Use
4.1This test method evaluates the performance of?at-rolled magnetic materials over a wide frequency range of ac excita-tion with and without incremental dc bias,as used on trans-formers,motors,and other laminated core devices.
4.2This test method is suitable for design,speci?cation acceptance,service evaluation,and research.
4.3The application of test results obtained with this test method to the design or evaluation of a particular magnetic device must recognize the in?uence of the magnetic circuitry upon its performance.Some speci?c items to consider are size, shape,holes,welding,staking,bolting,bracketing,shorting between laminations,ac waveform,adjacent magnetic?elds, and stress.
5.Test Specimens
5.1The test specimens shall consist of Epstein strips cut from sheets or coiled strips of magnetic materials in accor-dance with the test lot and sampling requirements of Practice A34/A34M,Sections5and7,and Test Method A343/A 343M,Annex A3(see Note1).
N OTE1—Excessive burr and non?atness of strips can appreciably affect test results.
5.1.1If specimen is primarily isotropic,cut one half of the strips with grain and one-half cross grain.If anisotropic,cut all with grain.Other ratios of with and cross grain may be chosen by agreement.
5.2The test specimen shall consist of multiples of four strips.The total number of strips shall be such as to:
5.2.1Provide sufficient total losses to register within the range of required accuracy of the wattmeter.
5.2.2Fill the available vertical opening space in the test frame to at least1?4of its maximum height and
5.2.3Contain a minimum of twelve strips.
5.3Check each strip to assure its length and width are accurate to60.04cm[0.4mm].If the length is not30.5cm [305mm],use the actual length as described in Sections9and 10.
5.4Table1shows the number of Epstein strips that will provide nominal weights of approximately125,250,500,and 1000g for various strip thicknesses.
6.Basic Circuit(see Fig.1)
6.1Fig.1shows the essential apparatus and basic circuit connections for this test.The ac source shall be capable of driving the test circuit with an ac sinusoidal waveform voltage of desired amplitude and frequency.The series resistance components,r and wattmeter current shunt,in conjunction with the ac source,shall be such as to provide a pure sine wave voltage either at the test frame transformer primary,or if overall negative feedback is implemented,then the pure sine wave shall be at the test frame transformer secondary.The wiring and switches shall be selected to minimize current or voltage reading errors,for example,the voltage connections across r shall be made precisely at the resistor terminals so that no wire resistance is effectively added to that of the resistor. Also,all voltage reading or negative feedback components across the secondary of the test frame transformer shall cause negligible loading,that is,shall draw sufficiently low currents to not appreciably affect power or current readings.When a common ground connection is made between primary and secondary of the test frame transformer,the ac source ground connection must be isolated to eliminate ground loop current.
7.Apparatus
7.1The test apparatus shall consist of as many of the following components as required to perform the desired measurement functions:
7.2Balance or Scale—The balance or scales used for determining the mass of the test specimen shall weigh to an accuracy of0.05%.The calculated test voltage E f is directly proportional to specimen mass and magnetic?ux density(see Note2).
N OTE2—Errors in the weight of a specimen will cause errors in magnetic?ux density,core loss,and exciting power.
7.3Epstein Test Frame:
7.3.1The dimensions of the windings,their spacing,and the general precautions and construction details of Test Method A343/A343M,Annex A1,shall apply.The Epstein test frame should be selected to be compatible with the desired test specimen size(see5.4).
7.3.2The following numbers of total winding turns are usually commercially available and are suggested for testing at various frequencies:
TABLE1Number of Strips for Various Nominal Specimen Weight Epstein Frames(Minimum Strip Length is28cm[280
mm])
Nominal Strip Thickness
Number of Strips for Test Specimens of
Nominal Weight Thick(cm)Thick(in.)125g250g500g1000g
0.0790.0310 (1220)
0.0710.0280 (1224)
0.0640.0250 (1224)
0.0560.0220 (1628)
0.0470.0185 (121632)
0.0430.0170 (122036)
0.0390.0155 (122040)
0.0360.0140 (122444)
0.0320.0125 (122448)
0.0280.0110 (162856)
0.0250.0100 (163260)
0.0230.0090 (163668)
0.0200.008012204076
0.0180.007012244488
0.0150.0060122452A
0.0130.0050163260A
0.0100.0040204076A
0.00760.00302452A A
0.00510.00204076A A
0.00250.001076A A A
A Not
recommended.
Frequency,Hz No.of Turns (Both Primary and Secondary)
Up to 400700or 352400to 1000352
1000to 5000200(no air-?ux compensator)5000to 10000
100(no air-?ux compensator)
7.3.3The primary winding is uniformly distributed along the magnetic path and may be wound in multiple layers over the secondary winding.The secondary winding shall be the innermost winding on the coil form and shall be a single layer winding.The primary and secondary shall be wound in the same direction and their starting end connections shall be made at the same corner.
7.3.4Air Flux Compensator —If the Epstein test frame has more than 200turns,it shall contain an air ?ux compensator which opposes and balances out the air ?ux voltage induced in the secondary winding.Such compensation is necessary when-ever the permeability of the test specimen is low under high magnetic ?eld strength conditions to avoid serious errors in setting the ?ux voltage.The air ?ux compensator allows the true intrinsic induction B i to be measured.When tests are restricted to moderate magnetic ?ux density and ?eld strength
where test specimen relative permeability remains high,the difference between B and B i is small and air ?ux compensation is unnecessary.
7.4Flux Voltmeter —A full wave true average responsive voltmeter calibrated so that its scale reads true average 3p =2/4,and indicates the same value as an rms voltmeter when measuring pure sine waves,shall be provided for measuring the peak value of the test induction.To meet the precision of this test method,meter error shall not exceed 0.25%(see Note 3).If the meter impedance is not sufficiently high at the frequency of test,it is necessary to compensate for its loading effect.To evaluate how much the meter loads the circuit,read the rms ammeter and rms voltmeter before and after discon-necting the ?ux voltmeter.When dc bias is applied to the test frame transformer,the ?ux voltmeter must be able to respond true average.
N OTE 3—Inaccuracies in setting the test voltage produce errors dispro-portionately larger in core loss and exciting current.Evaluate meter error in accordance with the manufacturer’s information,for example,percent of range,temperature,and
frequency.
N OTE 1—The ac source terminals must “?oat”to prevent ground loop currents.If the wattmeter has a common connection between its V and I terminals,the rest of the circuit must be connected so as to prevent shorting.
N OTE 2—If,during demagnetization,current exceeds the wattmeter maximum rating,Switch S1is required and is closed.N OTE 3—A dc winding is required only if incremental properties are to be tested.
N OTE 4—The voltage and current monitoring oscilloscope may be a dual channel type and is optional equipment.Basic circuit-wattmeter-ammeter-voltmeter method,100to 10000Hz and 25-cm Epstein frame
FIG.1Basic Circuit-Wattmeter-Ammeter-Voltmeter Method,100to 10000Hz and 25–cm Epstein
Frame
7.5RMS Voltmeter—A RMS voltmeter shall be provided for evaluating the exciting power and also the form factor of the voltage induced in the secondary winding of the test frame transformer.The meter error shall not exceed0.25%at the frequency of test.The meter burden shall have no more than 0.05%effect on the test frame transformer voltage or current. To evaluate how much the meter loads the circuit,read the RMS ammeter and?ux voltmeter before and after disconnect-ing the RMS voltmeter.When dc bias is applied to the test frame transformer,the RMS meter must be able to indicate true RMS ac voltage.
7.6Oscilloscope Voltage Monitor(Optional)—An oscillo-scope may be provided to monitor the waveshape of the secondary voltage.Connection of the oscilloscope shall not affect the voltage or current more than0.05%.
7.6.1The oscilloscope dual input common ground connec-tions shall not cause ground loop currents in any part of the circuit.
7.7Wattmeter—The wattmeter error shall not exceed 0.25%at unity power factor at the frequency of test.Error shall not exceed1%of reading at the lowest power factor encountered.If desired,the reactive power may also be measured or calculated.
7.7.1The voltage sensing terminals of the wattmeter shall have an input impedance sufficiently high that the voltage or current is changed no more than0.05%.
7.7.2The current sensing terminals of the wattmeter shall have a low impedance so as to not change the test?xture transformer primary current waveshape appreciably.An input impedance of0.1V is preferred.The wattmeter shall be capable of accepting the maximum peak current encountered without exceeding its crest factor rating.
7.8RMS Ammeter—A RMS ammeter consisting of a RMS voltmeter connected across the terminals of the current sensing resistor(r in Fig.1)shall be provided.The RMS voltmeter shall have an error no greater than0.25%considering the maximum crest factor and all frequencies and amplitudes encountered in the measurement.Connection to the circuit shall not cause appreciable changes in voltage or waveform. The current sensing resistor shall be accurate to0.1%and be essentially noninductive at the frequency of test.It shall have a power rating several times the maximum power to be experienced during the test.V oltmeter connections to the resistor shall be made precisely at the resistor terminals so that wire resistance does not add to the known resistor value and cause error.The resistor value shall be0.1V or,if higher,shall not cause a voltage drop greater than5%of the test frame voltage.
7.9Peak Ammeter—A true peak,or peak-to-peak,ammeter consisting of a true peak or peak-to-peak voltmeter connected across the terminals of the current sensing resistor(r in Fig.1) shall be provided to measure the peak value of the current waveform.Accuracy shall be2%.Alternatively,an oscillo-scope with voltage measurement capability can be used.An oscilloscope,when used,shall not cause shorting of any part of the circuit through its dual input common ground.
7.10Oscilloscope Current Monitor(Optional)—Extreme current wave peaking occurs as the magnetic core material goes into saturation.This is readily observable on an oscillo-scope connected across the current sensing resistor.An oscil-loscope also makes it possible to recognize current waveform nonsymmetry with positive and negative polarity.Such non-symmetry results when a dc component is present along with the ac in the primary winding of the test frame,causing nonsymmetrical B versus H excitation.This condition causes serious peak current reading errors.Temporarily inverting the waveform by?ipping the oscilloscope“invert”switch is an effective way to observe waveform symmetry.Some oscillo-scopes have a provision for automatically and digitally display-ing the peak of a waveform and thus may be used to read the peak current instead of a peak reading voltmeter.An oscillo-scope,when used,shall not cause unwanted shorting of any part in the circuit through its dual input ground.
7.11ac Source(see Fig.2)—A precisely controllable source of sinusoidal test voltage characterized by low internal imped-ance,low harmonic distortion(1%),excellent voltage stability (0.1%),and excellent frequency stability(0.1%)is required.
7.11.1The ac source shall be ac coupled to prevent dc bias in the test?xture transformer.The ac source would typically consist of some or all of the following components:
7.11.1.1Sine Wave Generator.
7.11.1.2Power Ampli?er.
7.11.1.3Isolation Transformer or Coupling Capacitor. 7.11.1.4Impedance Matching Tapped Transformer or Au-totransformer.
7.11.2Sine Wave Generator—A sinusoidal wave generator or synthesizer capable of generating the signal described above shall be provided.This signal is input to the power ampli?er.
7.11.3Power Ampli?er—An ampli?er of voltage and cur-rent to be fed to the test frame transformer shall be provided. It shall be capable of amplifying the signal while maintaining the waveform and meeting speci?cations described above.It may use negative feedback to meet the low source impedance and low waveform distortion requirements.It may consist,for example,of an audio ampli?er with several hundred watts rating.If it is a dc-coupled ampli?er,an ac isolation trans-former or capacitor shown in Fig.2is required.
7.11.4Isolation Transformer—The isolation transformer,if required,shall have sufficient bandwidth,coupling,and power-handling capacity to maintain signal integrity and low source impedance,even with dc offset of a dc coupled ampli?er feeding it.Its output shall be routed to the test frame trans-former primary.
7.11.5Coupling Capacitor—The coupling capacitors, which are an alternate to the isolation transformer,shall be a pair of electrolytic capacitors connected back to back
with FIG.2Circuit Diagram of Typical ac
Source
sufficient effective capacitance to maintain the low source impedance of the power ampli?er.Alternatively,an ac-rated capacitor may be used.
7.11.6Impedance Matching Tapped Transformer or Autotransformer—A transformer or autotransformer with?xed or variable taps shall be provided if necessary to match the power ampli?er source impedance to that of the test frame transformer.It shall have bandwidth and power-handling capacity to maintain signal integrity.If this is a transformer with isolated primary and secondary windings,the isolation transformer or coupling capacitor mentioned above may be omitted.
8.Procedure
8.1Check the specimen strips to assure that no dented, twisted,or distorted strips showing evidence of mechanical abuse have been included.Strips having readily noticeable burr (greater than0.0005in.[0.02mm])may also be unsuitable for testing.Verify that the strips are of uniform length and width and that the appropriate number of strips with the appropriate grain direction are available(see Table1).Weigh strips on a scale or balance capable of determining the mass to within 60.05%.
8.2Calculate Magnetic Flux Density—Calculate and record the?ux voltage values corresponding to all the magnetic?ux density levels to be tested(see Sections9and10).A data sheet form should be prepared with spaces to enter every required meter reading and other data(see Note4).
N OTE4—The calculations may be performed and a data sheet printout obtained by use of a computer appropriately https://www.360docs.net/doc/4c15320226.html,e of data acquisition instrumentation allows automatic setting of the apparatus and automatic measurement as well,if desired.Refer to the Appendix of Test Method A343/A343M,“Computerization of Magnetic Test Data.”
8.3Insert the test specimen strips into the test frame and prepare them for test as described in Test Method A343/A 343M.Connect the apparatus as indicated in the circuit diagram of Fig.1and perform the various tests following the procedures outlined below.It is recommended to check for symmetry of the current waveform when initially setting up the equipment.
8.4Demagnetization—The specimen should be demagne-tized before measurements of any magnetic property are made. Demagnetize by applying a voltage from the power source to the primary circuit that is sufficient to magnetize the specimen to a magnetic?ux density above the knee of its magnetization curve(where the exciting current increases sharply for small increases in?ux density).At this point,decrease the applied voltage slowly and progressively during an elapsed time of5to 10s(or longer)so that the?ux density is reduced smoothly to a point below the lowest?ux density at which tests are to be performed and near zero?ux density.Demagnetization to near zero magnetic?ux density is especially critical when measur-ing properties at very low?ux density(for example,100G). After demagnetization,take care not to jar or move the specimen in any way that will destroy the desired reproducible magnetic state of negligible magnetic?ux density.Tests should be made immediately after demagnetization(within2to3min) for the desired test points using the following sequence of testing:
8.4.1Begin the tests at the lowest test magnetic?ux density and test in order of increasing maximum magnetic?ux density. Do not overshoot the target magnetic?ux density level appreciably,especially at low magnetic?ux densities.
8.4.2When frequency is varied at constant magnetic?ux density,begin the tests at the lowest frequency and test in order of increasing frequency.
8.4.3Repeat the demagnetization before determining a test point at either a lower magnetic?ux density or lower frequency than that of the previous test point.
8.5Meter Readings—Once the magnetic?ux density level is correct and steady,proceed to record the following:
E f=?ux voltage(secondary),
E2=rms voltage(secondary),
W=core wattage,
P q=core volt-amperes reactive(optional),
I=rms exciting current(primary),or
E r=rms voltage across r,
I p=peak exciting current(primary),or
E pr=peak voltage across r,or
I p-p=peak-to-peak exciting current(primary),or
E p-pr=peak-to-peak voltage across r,
f=frequency(if more than one frequency),and
r=shunt resistance.
N OTE5—V oltages E
pr
and E
p-pr
may also be observed or measured or both with an oscilloscope.Gather information on test frame transformer secondary voltmeter and wattmeter burdens and record them so correc-tions can be made if necessary,that is,if they affect accuracy by more than 0.1%.
8.6Incremental Properties—Incremental properties are core loss,exciting power,permeability,and so forth taken under conditions of a superimposed constant dc magnetic?eld. The test frame shall have a separate winding for this purpose (see Fig.3).This winding is to be uniformly distributed over the other windings.The dc supply shall be a constant current source with good current regulation.A constant direct current source feeding the dc bias winding has no shorting effect on the ac?eld because its ac source impedance approaches in?nity. Should the dc come directly from a voltage-regulated source, its low impedance would effectively short the other windings and produce low ac voltages not characteristic of true incre-mental properties.See Fig.4for a typical constant dc source circuit diagram(see Note6).
N OTE6—In Fig.4,if V
dc
=50V,and V
in
=6V,then V
e
>5V.For
R
e
=5V,I
dc
=1.0 A.Adjust R
2
for exact current.Circuit source impedance is extremely
high.
FIG.3Circuit Diagram dc Biasing of Test Frame Transformer for Measurement of Incremental
Properties
8.6.1Alternatively,other methods to raise the dc source impedance may be used.For example,an inductor with sufficient inductance and bandwidth to present a high imped-ance at the ac frequency can be placed in series with the dc power supply.As exciting current may rise sharply under incremental conditions,watch carefully the ammeter and wattmeter readings to avoid damage to the equipment.
8.6.2Use the following incremental testing procedures to obtain good repeatability of test values:?rst,demagnetize at low frequency (see 8.4),then establish in the biasing winding the lowest value of biasing current,without overshooting,which is to be used.Then without any change or variation in the biasing current,slowly raise the ac voltage,without overshoot,to the desired test magnetic ?ux density.Set other magnetic ?ux densities at the same level of dc bias in ascending order of magnetic ?ux density.For each separate biasing level again demagnetize the test specimen.(Warning —Switches in series with the dc bias current should never be opened or closed until the dc bias supply voltage has been reduced to zero.)
8.6.3dc biasing tends to cause waveform distortion.Do not make measurements when the ac ?ux waveform distortion exceeds 10%as determined by the form factor method (see 9.4and 10.4).An oscilloscope monitoring the secondary voltage waveform is recommended.
9.Calculations (Customary Units)
9.1Symbols —Use the symbols listed below in the equations or descriptions of this test method.For the official complete list of symbols and de?nitions,see Terminology A 340.
A =effective cross-sectional area of test specimen in the Epstein frame,cm 2
B =normal induction,G B i =intrinsic induction,G E =rms voltage,V
E 2=rms voltage in an unloaded secondary wind-ing,V
E f =?ux voltage,V
E p =peak value of voltage,V E p-p =peak-to-peak voltage,V e =eddy-current loss,%
F =error in form factor,%f =frequency,Hz
H b =dc biasing magnetic ?eld strength,Oe
H L =inductance magnetic ?eld strength from the reactive component of rms exciting current,Oe
H p =peak magnetic ?eld strength from measured peak value of exciting current,Oe
H z =apparent ac magnetic ?eld strength from mea-sured rms exciting current and assumed value I p ==2I,Oe
H D z =apparent ac magnetic ?eld strength from rms exciting current with dc incremental bias,Oe h =hysteresis loss,%
I =rms exciting current,A
I p =peak value of exciting current (measured),A K =voltage ratio squared (E 2/E f )2l =length of test strips,cm
l 1
=effective magnetic path length,
cm
FIG.4Typical Constant Current dc
Source
m=mass of test specimen,g
m1=active mass of test specimen,g
N1,N2=total number of turns in Epstein frame primary
or secondary windings,respectively
P c(B:f)=speci?c core loss,W/lb at magnetic?ux den-
sity B and frequency f
P z(B:f)=speci?c exciting power,V A/lb at magnetic
?ux density B and frequency f
R=effective resistance of secondary instrument
burden and circuit including wattmeter poten-
tial resistance,voltmeter resistance,and any
other burden,V
r=shunt resistance for the ammeter,V
P q=total reactive power,vars
W=total power measured by the wattmeter,W
μsubscript=permeability from B/H subscript where subscript is
same as that of H
d=density,g/cm3
9.2Magnetic Flux Density:
9.2.1The intrinsic induction B i is related to E f by:
E f5p=2B i AN2f~1028!V(1) To eliminate Epstein strip stacking factor considerations,and since mass,density,and length of the specimens can be accurately determined,the value of cross-sectional area,A,is calculated from these quantities and the sample density.Since the sample is divided into four parts,then each leg of the test frame has a cross-sectional area:
A5m/~4l d!,cm2
(2) Hence E f becomes:
E f5p=2B i N2fm/[4l d~108!#,V(3) If the test frame secondary meter burdens are not negligible, they will cause a voltage drop in the winding resistance.If this voltage drop is0.1%or greater,it lowers the apparent magnetic?ux density and reduces accuracy.Calculate E f for all values of magnetic?ux density to be tested and enter into the data sheet.
9.3Speci?c Core Loss:
9.3.1To obtain the speci?c core loss of the specimen in watts per unit mass,it is necessary to subtract all secondary circuit power included in the wattmeter indication before dividing by the active mass of the specimen.The speci?c core loss at a particular magnetic?ux density and frequency is:
P c~B:f!5453.6~W2E22/R!/m1,W/lb(4) 9.3.2In the25-cm Epstein frame,it is assumed that94cm is the effective magnetic path length with specimens28cm or longer.For the purpose of computing core loss,the active mass is assumed to be:
m15l1m/~4l!594m/~4l!523.5m/l,g(5) 9.4Form Factor Correction—The percent error in form factor is given by the equation(see Note7):
F5100~E22E f!/E f(6) The corrected core loss,that shall be computed when F is greater(see Note8)than61%,is:
corrected P c~B:f!5~observed P c~B:f!!100/~h1eK!(7)
where:
observed P c(B:f)=speci?c core loss calculated by the
equations in9.3,
h=percentage hysteresis loss at magnetic
?ux density B,
e=percentage eddy-current loss at mag-
netic?ux density B,
K=(E2/E f)2,and
h=100?e.
Values of h and e for materials may be obtained using core loss separation methods(see Note9)and are a matter of agreement between the producer and the user.
N OTE7—In determining the form factor error,it is assumed that the hysteresis component of core loss will be independent of the form factor if the maximum value of magnetic?ux density is at the correct value(as it will be if a?ux voltmeter is used to establish the value of the magnetic ?ux density)but that the eddy-current component of core loss,being a function of the rms value of the voltage,will be in error for nonsinusoidal voltages.While it is true that frequency or form factor separations do not yield accurate values for the hysteresis and eddy-current components,yet they do separate the core loss into two components,one which approxi-mately varies as the second power of the form factor and the other which is relatively unaffected by form factor variations.Regardless of the academic difficulties associated with characterizing these components as hysteresis and eddy-current loss,it is observed that this method does accomplish the desired correction under all practical conditions if the distortion is not excessive.
N OTE8—It is recommended that tests made under conditions in which the percent error in form factor,F,is greater than10%be considered as likely to be in error by an excessive amount and that such conditions be avoided.
N OTE9—Core loss separation into separate hysteresis and eddy-current components may be determined by“Two Form Factor Method”for example.See Annex A2.
9.5Speci?c Exciting Power:
9.5.1The speci?c exciting power at a particular magnetic ?ux density and frequency is calculated from the rms current in the primary of the test frame and the rms voltage induced in the secondary as follows:
P Z~B:f!5453.6E2I/m1,V2A/lb(8) 9.5.2In the25-cm Epstein frame,it is assumed that94cm is the effective magnetic path length with specimens28cm or longer.For the purpose of computing exciting power,the active mass is assumed to be:
m15l1m/~4l!594m/~4l!523.5m/l,g(9) 9.6Exciting Current and Magnetic Field Strength:
9.6.1Exciting current is assumed to be the rms value I unless otherwise speci?ed.
The magnetic?eld strength H determined from I is based upon the assumption that the peak value of current is=2I.In fact,this is not true because the current waveform is generally distorted and nonsinusoidal for sine voltage waveforms.This is due to the nonlinear characteristics of ferromagnetic materials. However,this is accepted practice.Hence:
H z~impedance magnetic?eld strength!50.4p=2N1I/l1,Oe
(10) where:N1is number of turns in the test frame primary.
9.6.2Peak Exciting Current—The measured peak current,
I P,is given
by:
I P5I p2p/2,A or
I P5E p/r,A or
I P5E p2p/2r,A.(11) Hence:
H p~peak magnetic?eld strength!50.4p N1I p/l1,Oe(12)
9.6.3Inductance Exciting Current(Optional)—The induc-tive or reactive component of the exciting current,I L,is usually determined from the measured value of reactive power,P q in vars,where:
I L5P q/E2A(13) Hence:
H L~inductance magnetic?eld strength!50.4p=2N1I L/l1,Oe
(14) 9.7Permeability:
9.7.1Several different types of ac permeability may be calculated using data collected from tests described in this test method.These different permeabilities are based upon several different de?nitions of magnetic?eld strength.The general form of the equation for permeability is:
μ5B/H~a dimensionless quantity!(15) where B=B i+H p.For convenience in calculating perme-ability,the intrinsic induction B i,may be used instead of the normal induction,B,for most testing.This entails no loss of accuracy until H p becomes appreciable in magnitude relative to
B i.If greater accuracy is required,B should be used.
9.7.2Impedance Permeability:
μz5B/H z(16) 9.7.3Peak Permeability:
μp5B/H p(17) 9.7.4Inductance Permeability:
μL5B/H L(18)
9.8Incremental dc(Biasing)and Magnetic Field Strength:
H b~dc magnetic?eld strength!50.4p N dc I dc/l1,Oe(19) where:
N dc=dc winding turns of the test frame and
I dc=dc bias current(measured).
When the dc magnetic?eld strength H b is present,the values of core loss,exciting current,var,and so forth measured and their derived properties,speci?c core loss,speci?c exciting power,and permeability are all considered to be incremental values,for example,P D c,I D,P D q,P D c(B:f),P D z(B:f),andμD z. These are measured and calculated as though the dc bias was not present.
10.Calculations(SI Units)
10.1Symbols—In the equations or descriptions of this test method,use the symbols listed below.For the official complete list of symbols and de?nitions,see Terminology A340.
A=effective cross-sectional area of test specimen
in the Epstein frame,m2
B=normal induction,T
B i=intrinsic induction,T
E=rms voltage,V
E2=rms voltage in an unloaded secondary wind-
ing,V
E f=?ux voltage,V
E p=peak value of voltage,V
E p-p=peak-to-peak voltage,V
e=eddy-current loss,%
F=error in form factor,%
f=frequency,Hz
H b=dc biasing magnetic?eld strength,A/m
H L=inductance magnetic?eld strength from the
reactive component of rms exciting current,
A/m
H p=peak magnetic?eld strength from measured
peak value of exciting current,A/m
H z=apparent ac magnetic?eld strength from mea-
sured rms exciting current and assumed value
I p5=2I,A/m
H D z=apparent ac magnetic?eld strength from rms
exciting current with dc incremental bias,A/m h=hysteresis loss,%
I=rms exciting current,A
I p=peak value of exciting current(measured),A K=voltage ratio squared(E2/E f)2
l=length of test strips,m
l1=effective magnetic path length,m
m=mass of test specimen,kg
m1=active mass of test specimen,kg
N1,N2=total number of turns in Epstein frame primary
or secondary windings,respectively
P c(B:f)=speci?c core loss,W/kg,at magnetic?ux
density B and frequency f
P z(B:f)=speci?c exciting power,V A/kg at magnetic
?ux density B and frequency f
R=effective resistance of secondary instrument
burden and circuit including wattmeter poten-
tial resistance,voltmeter resistance,and any
other burden,V
r=shunt resistance for the ammeter,V
P q=total reactive power,vars
W=total power measured by the wattmeter,W
μsubscript=permeability from B/H subscript where subscript is
same as that of H
d=density,kg/m3
G m=magnetic constant4p310?7H/m
10.2Magnetic Flux Density:
10.2.1The intrinsic induction B i is related to E f by:
E f5p=2B i AN2f,V(20) To eliminate Epstein strip stacking factor considerations,and since mass,density,and length of the specimens can be accurately determined,the value of cross-sectional area,A,is calculated from these quantities and the sample density.Since the sample is divided into four parts,then each leg of the test frame has a cross-sectional area:
A5m/~4l d!(21) Hence E f becomes:
E f5p=2B i N2fm/~4l d!,V
(22)
If the test frame secondary meter burdens are not negligible, they will cause a voltage drop in the winding resistance.If this voltage drop is0.1%or greater,it causes the apparent magnetic?ux density to be lower than actual and reduces accuracy.Calculate E f for all values of magnetic?ux density to be tested and enter into the data sheet.
10.3Speci?c Core Loss:
10.3.1To obtain the speci?c core loss of the specimen in watts per unit mass,it is necessary to subtract all secondary circuit power included in the wattmeter indication before dividing by the active mass of the specimen.The speci?c core loss at a particular magnetic?ux density and frequency is:
P c~B:f!5~W2E22/R!/m1,W/kg(23) 10.3.2In the25-cm Epstein frame,it is assumed that0.94m is the effective magnetic path length with specimens0.28m or longer.For the purpose of computing core loss,the active mass is assumed to be:
m15l1m/~4l!50.94m/~4l!50.235m/l,kg(24) 10.4Form Factor Correction—See9.4.
10.5Speci?c Exciting Power:
10.5.1The speci?c exciting power at a particular?ux density and frequency is calculated from the rms current in the primary of the test frame and the rms voltage induced in the secondary as follows:
P z~B:f!5E2I/m1,V2A/kg(25) 10.5.2In the25-cm Epstein frame,it is assumed that0.94m is the effective magnetic path length with specimens0.28m or longer.For the purpose of computing exciting power,the active mass is assumed to be:
m15l1m/~4l!50.94m/~4l!50.235m/l,kg(26) 10.6Exciting Current and Magnetic Field Strength:
10.6.1Exciting current is assumed to be the rms value I unless otherwise speci?ed.
The magnetic?eld strength H determined from I is based upon the assumption that the peak of the current is=2I.In fact,this is not true because the current waveform is generally distorted and nonsinusoidal for sine voltage waveforms.This is due to the nonlinear characteristics of magnetic materials other than air.However,this is accepted practice.Hence:
H z~impedance magnetic?eld strength!5=2N1I/l1,A/m(27) where N1is number of turns in the test frame primary. 10.6.2Peak Exciting Current—The measured peak current is given by:
I P5I p2p/2,A or(28)
I P5E p/r,A or
I P5E p2p/2r,A
Hence:
H p~peak magnetic?eld strength!5N1I p/l1,A/m(29)
10.6.3Inductance Exciting Current(Optional)—The induc-tive or reactive component of the exciting current,I L,is usually determined from the measured value of reactive power,P q in vars,where:
I L5P q/E2,A(30)
Hence:
H L~inductance magnetic?eld strength!5=2N1I L/l1,A/m(31)
10.7Relative Permeability:
10.7.1Several different types of ac permeability may be calculated using data collected from tests described in this test method.These different permeabilities are based upon several different de?nitions of magnetic?eld strength.The general form of the equation for relative permeability is:
μ5B/~H G m!(32) where B=B i+H p G m.For convenience in calculating peak permeability,the intrinsic induction,B i,may be used instead of the normal induction,B,for most testing.This entails no loss of accuracy until H p G m becomes appreciable in magnitude relative to B i.If greater accuracy is required,B should be used.
10.7.2Impedance Relative Permeability:
μz5B/~H z G m!(33) 10.7.3Peak Relative Permeability:
μp5B/~H p G m!(34) 10.7.4Inductance Relative Permeability:
μL5B/~H L G m!(35)
10.8Incremental dc(Biasing)and Magnetic Field Strength:
H b~dc magnetic?eld strength!5N dc I dc/l1,A/m(36) where:
N dc=dc winding turns of the test frame and
I dc=dc bias current(measured).
When the dc magnetic?eld strength H b is present,the values of core loss,exciting current,and so forth measured and their derived properties,speci?c core loss,speci?c exciting power, and relative permeability are all considered to be incremental values,for example,P D c,I D,P D q,P D c(B:f),P D z(B:f),andμD z. These are measured and calculated as though the dc bias were not present.
11.Precision and Bias of Measurement
11.1Estimated Reproducibility Between Laboratories: 11.1.1At low frequencies and moderate magnetic?ux densities:core loss63%,relative permeability65%.
11.1.2At low frequencies and high magnetic?ux densities: core loss64%,relative permeability65%.
11.1.3At5000Hz:core loss64%,relative permeability 65%.
11.1.4At10000Hz:core loss65%,relative permeability 65%.
11.2Note that the above are estimates of the between-laboratory reproducibility for tests according to this test method.The within-laboratory repeatability should be much better than the above values.
11.3Bias—At date of this revision,no accepted reference material and data covering the scope of this test method is available.Therefore,no statement of bias can be made. 12.Keywords
12.1alternating-current;ammeter;core loss;customary units;Epstein;exciting power;?ux voltage;form factor; incremental magnetization;magnetic?ux density;
magnetic;
magnetic material;magnetic test;permeability;voltmeter;wattmeter
ANNEXES
(Mandatory Information)
A1.RECOMMENDED STANDARD TEST MAGNETIC FLUX DENSITIES AND TEST FREQUENCIES
A1.1Recommended Standard Test Points —Unless other-wise speci?ed,the test frequency shall be 400Hz.If test values at higher frequencies are required,preference should be given to test frequencies listed in Table A1.1.Standard test magnetic ?ux densities for the various standard test frequencies are also shown.
A2.EXAMPLE OF LOSS SEPARATION CALCULATION USING THE “TWO FORM FACTOR METHOD”
A2.1In the following equations,“core loss”designates either net core loss as measured or speci?c core loss in either customary or SI units.It is necessary,of course,to be consistent in the quantities.
A2.2The “Two Form Factor”method assumes that the corrected core loss at either form factor will be the same,thus:
P 1~100!/~h 1eK 1!5P 2~100!/~h 1eK 2!
where:
P 1=observed core loss (speci?c core loss)at distortion
Level 1,
P 2=observed core loss (speci?c core loss)at distortion
Level 2,
K 1=(E 1r /E f )2,K 2=(E 2r /E f )2
E 1r and E 2r are the rms values of the secondary voltage at distortion Levels 1and 2,respectively.
E f =?ux voltage at the speci?ed ?ux density,e =percent eddy-current loss,
h =percent hysteresis loss,and also e =100–h.
Substituting in the above equation and solving for e ,yields:e =100(P 2?P 1)/[P 1(K 2?1)?P 2(K 1?1)]
N OTE A2.1—Although there are several methods mentioned in litera-ture,the “Two Form Factor”and “Two Frequency”methods are com-monly used.The“Two Form Factor”method is preferred because the measurements made at each form factor value are those encountered in this test method.It also is easy to achieve two different levels of form factor with most test equipment.
ASTM International takes no position respecting the validity of any patent rights asserted in connection with any item mentioned in this https://www.360docs.net/doc/4c15320226.html,ers of this standard are expressly advised that determination of the validity of any such patent rights,and the risk of infringement of such rights,are entirely their own responsibility.
This standard is subject to revision at any time by the responsible technical committee and must be reviewed every ?ve years and if not revised,either reapproved or withdrawn.Your comments are invited either for revision of this standard or for additional standards and should be addressed to ASTM International Headquarters.Your comments will receive careful consideration at a meeting of the responsible technical committee,which you may attend.If you feel that your comments have not received a fair hearing you should make your views known to the ASTM Committee on Standards,at the address shown below.
This standard is copyrighted by ASTM International,100Barr Harbor Drive,PO Box C700,West Conshohocken,PA 19428-2959,United States.Individual reprints (single or multiple copies)of this standard may be obtained by contacting ASTM at the above address or at 610-832-9585(phone),610-832-9555(fax),or service@https://www.360docs.net/doc/4c15320226.html, (e-mail);or through the ASTM website (https://www.360docs.net/doc/4c15320226.html,).
TABLE A1.1Recommended Test Magnetic Flux Densities for
Standard Test Frequencies
Frequency,Hz
Magnetic Flux Density kG T 40010or 15 1.0or 1.58005or 100.5or 1.010005or 100.5or 1.016002or 50.2or 0.532002or 50.2or 0.550001or 20.1or 0.210000
0.5
or 1
0.05
or
0.1
北京科技大学金属材料学实验报告思考题
回火的过程实际上就是马氏体分解的过程,也是过饱和固溶的碳从α-Fe中脱溶并形成碳化物的过程。回火温度越高,马氏体分解越充分,分解产物的长大越充分。在回火过程中,回火温度——回火组织——钢的性能之间存在着一一对应关系。回火温度越高,钢的硬度越低。 在150-250之间的回火称为低温回火,回火后的组织称为回火马氏体; 在350-500之间进行的回火称为中温回火,回火后的组织称为回火屈氏体 在500-650之间进行的回火称为高温回火,回火后的组织称为回火索氏体 可以看出,回火之后,α-Fe中固溶的碳明显减少,使得碳固溶强化的作用大大减弱,反映到硬度上,就是随着回火温度升高,一般硬度都会下降。 淬火温度对组织和性能的影响: 根据45钢 “晶粒粗大马氏体,1000摄氏度,水淬,59.1”、 “晶粒细小马氏体,860,水淬,57.1”、 “铁素体+马氏体,770,水淬,46.2”; 40CrNi “晶粒粗大马氏体,1000摄氏度,油淬,40.6”、 “晶粒细小马氏体,860,油淬,50.9”、 T8 “晶粒粗大马氏体,1000摄氏度,水淬,66.2”、 “晶粒细小马氏体,860,水淬,57.3”、 可以得到如下结论: 高温淬火得到粗晶马氏体,低温淬火得到细晶马氏体,而温度在铁素体与奥氏体两相区的淬火得到铁素体+马氏体双相组织。在Ac3线以上,在保温时间相同的情况下,温度越高,得到的马氏体的晶粒越粗大。这是因为淬火温度越高,奥氏体晶粒长大的越快,因此在淬火的时候获得的马氏体晶粒也就越粗大。另外,尽管45钢和T8钢均表现出淬火温度越高,钢的硬度越高,但是本人对这一现象持怀疑态度。所谓金属硬度小,也就是硬度测试仪的压头容易压入金属,即金属容易发生塑性变形。塑性变形本质上是金属中的位错运动导致的。而晶界等会阻挡位错的运动。晶粒越小,同样大小的一块材料中,晶界就越多,对位错运动的阻碍就越大,材料形变的阻力就越大,宏观上就是硬度高。因此我对45钢、T8钢实验数据所显示出来的马氏体晶粒越粗大,硬度越高持怀疑态度。 当淬火温度在两相区的时候,由于出现铁素体,因此硬度会低于细晶马氏体组织。
土工试验规程
1 总则 《公路土工试验规程》(JTG E40—2007)(简称本规程)包括87个测定土的基本工程性质的试验项目和一个土的工程分类方法标准。修订本规程的目的是使公路系统的试验室在进行土工试验时有一个统一的试验准则,使所有的试验及试验结果具有一致性和可比性。 共性技术要求系指土的物理、水理、力学和化学性质试验中带共性的要求或标准,内容涉及土性指标的选择、成果整理、指标换算和试验报告等,系参考其他部门经验并结合公路工程特点制定。 1.O.1 为测定土的基本工程性质,统一试验方法,开为公路工程设计和施工提供可靠的计算指标和参数,制定本规程。 《公路土工试验规程》(JTJ 051—93)(简称《93规程》)自1993年实施以来,已有14年的时间。在此期间,公路建设所涉及的岩土工程问题发生了巨大的变化,在低等级公路建设中可以避让的岩土工程问题,在高等级公路建设中山于线形、坡度等技术要求变得无法回避。随着公路建设穿越山区以及黄土、冻土等特殊土地区,要求《公路土工试验规程》提供更多、更可靠的计算参数和判定指标,同时测试技术也有了进一步的发展,因此有必要对原规程进行重新修订,使《公路土工试验规程》能够满足现时和未来一段时期的公路建设发展需要,规范公路土工测试标准,并使土工试验及试验结果具有一致性和可比性。 1.O.2 本规程适用于各类公路I程的地基土、路基土及其他路用土的基本I程性质试验。 我国建筑、水利、铁路、冶金等系统均有相应的土工试验规程或标准,基本内容与本规程基本相同。本规程在修订的过程中,特别注意到与国家标准的统一和合理衔接。但是由于公路建设的特点,有些试验方法的条件和评判指标不同,在某些具体的参数和规定上有一定的特殊要求,因此与其他行业的规定略有不同。在实际使用中应予以注意。 1.0.3 各项工程应编制合理的试验方案,采集代表性的试样,测算准确的数据和进行正确的资料分析整理,为设计和施工提供反映实际情况的各种土性指标。 土的工程分类是土工试验规程对土进行粒组和土的工程性质划分、试验规模和仪器划分的重要依据。本规程中土的工程分类系以国家标准《土的分类标准》 第1页 (GBJ 145—90)最新修订报批稿为基础井依照公路建设特性要求进行编制。各项基本试验遵照《土工试验方法标准》(GB/T50123—1999),对《公路土工试验规程》(JTJ 051 93)进行了修订。 1.0.4 土工试验资料的分析整理按附录A进行,通过对样本(试验测得的数据)的研究,来估计总体(土体单元)的特征及其变化的规律性。 土工试验资料的分析整理,是提供真实有效、准确可靠的土性指标的重要环节。内容涉及数据记录的准确和客观性、成果整理、土性指标的选择、计算统计方法、误差分析、精度评价等。根据误差分析,对不合理的数据进行研究,分析其原因;在有条件的情况下,应进行一定的补充试验,以便决定对有疑问数据的取舍和更正。为便于使用,本 规程仍保留了《93规程》的附录A部分。 1.0.5 土I试验检测报告,对不同类型和级配特征的土,应提供土的基本颗粒级配、液限和塑限指标;对于特殊土,还应提供描述特殊土基本特征的试验测试指标。 土工试验检测报告,均应包含土的最基本特性参数的描述。对于粗粒土和巨粒土必须进行颗粒分析试验,提供土样的颗粒级配粒组数据和级配特征曲线。对于细粒土除应进行颗粒分析试验,提供土样的颗粒级配粒组数据和级配特征曲线外,还应进行界限含水率试验,提供土样的液限、塑限和塑性指数等。这是可重复再现土工试验结果的基本条 件,也是科学实验的基本要求。对于特殊土还应提供描述特殊土基本特征的试验测试指标。 1.0.6 公路土I试验除应符合本规程要求外,尚应符合国家和行业现行相关标准的规定。 在进行土工试验检测前,应对土工试验检测设备进行检查,仪器设备应符合《土工仪器的基本参数及通用技术条件》(GB/T 15406)的规定。根据国家计量法的要求,土工试验所用的仪器、设备应定期检定和校验。对通用仪器设备应按有关检定规程进行检定,对一些专用仪器设备应按相应的校验方法进行校验。 在执行本规程的过程中,对有些内容要求其符合现行国家标准《建筑地基基础设计规范》(GB 50007)、《湿陷性黄土地区建筑规范》(GnJ 25)、《膨胀土地区建筑技术规范》(GBJ 112)、《土的分类标准》(GBj 145)、《岩土工程基本术语标准》(GB/T 50279)等,以及交通行业指南《盐渍土地区公路设计与施工指南》、《公路工程抗冻设计
金属材料工程专业方向
金属材料工程专业方向 一、专业简介及培养目标 金属材料工程是国家经济建设的支柱,在航空航天、能源化工、国防军工、冶金机电等各行业均发挥着至关重要的作用,也是西安交通大学优势学科之一,在国内外享有较高的知名度。金属材料工程主要研究金属材料性能优化的基本理论,探索提高材料使用性能的有效途径,了解金属材料的性能特点及其工程应用。学生通过院级课程的学习已经具备了材料科学与工程方面的基础理论和一定的实验技能,本专业重点向学生介绍金属材料合金理论、常见工程构件的失效分析、材料内部缺陷的检测技术、金属功能材料、复合材料等相关知识,使学生掌握金属材料合金化基础理论知识,熟悉几种重要的金属材料及其力学性能与应用。培养学生选择材料和使用材料的科学思路。使学生能从事工程零构件的失效分析工作,提出预防零件失效的具体措施,使学生掌握金属材料内部缺陷无损检测技术,提出预防零件失效的具体的措施,了解复合材料、生物材料及功能材料的基本理论及要求,培养学生完整的金属材料知识体系。本专业的培养目标是使学生具备现代化建设所要求的系统材料知识、基础理论知识及工程技术知识,具有新材料、新产品、新工艺研究开发能力。金属材料工程专业具有学士、硕士、博士授予权,设有博士后流动站,是"211工程"建设学科的二级学科。金属材料工程专业的科学研究紧密结合国家科技发展的重大需求,瞄准国际前沿,开拓研究思路,不断提高研究水平,保持本学科在国内外的特点和优势。 二、课程设置 根据培养目标,金属材料工程专业方向的课程设置主要以金属材料为核心,课程体系包括合金与强化理论、材料选择与应用、零件失效分析、组织缺陷检测等主要内容。主要课程有:金属材料及热处理,失效分析与防止,金属功能材料,复合材料,材料无损检测技术,生物材料。 表1 金属材料工程专业课程
土工实验报告标准
南华大学 实验报告 实验项目名称:基桩动测 班级学号姓名同组人 实验教师实验日期审批 一、实验介绍 基桩反射波法是一种主要用于检测桩身结构完整性的无损检测技术,一般用于评价桩基混凝土质量、检验工程桩桩身完整性、判断缺陷位置,并协助设计、施工单位对所存在的缺陷提出消除措施。也可以用来对不同地质条件下的桩进行检测评价,指出其对本工程不利的因素以及评价工程桩竖向承载能力。 二、实验目的 1. 熟悉RS-1616K(s)基桩动测仪的操作; 2.检测混凝土灌注桩的桩身缺陷及其位置; 3.判定桩身完整性类别。 三、实验原理 基桩反射波法检测桩身结构完整性的基本原理是:通过在桩顶施加激振信号产生应力波,该应力波沿桩身传播过程中,遇到不连续界面(如蜂窝、夹泥、断裂、孔洞等缺陷)和桩底面时,将产生反射波,检测分析反射波的传播时间、幅值和波形特征,就能判断桩的完整性。 检测设备及现场联接图如下: 三、实验仪器设备 1.混凝土灌注桩:桩径Φ300,桩长6m,混凝土强度等级C25;2.RS-1616K(s)基桩动测仪主机、传感器、力锤; 3.Windows平台分析处理软件; 4.耦合剂; 5.其他附件。 四、实验内容 1.根据提供的实验桩选择传感器和力锤; 2.完成传感器的连接与安装; 3.采集信号并在分析仪上进行数据分析; 4.传输数据至计算机,利用软件进行数据分析和处理。 五、实验步骤 1.连接分析仪主机与传感器,清理桩头,安装传感器; 2.开机,输入工程信息并设置工作参数; 3.用力锤敲击桩头,检查波形的重复性和可鉴别性; 4.进入分析页面,对波形进行处理,判读桩身缺陷类型和位置; 5.关机,插入U盘,重新开机,进行数据传输; 6.将测试数据导入计算机,利用软件对数据进行进一步处理和分析,生成测试 报告。 六、测试结果 经现场测试,由武汉岩海专用软件输出桩基测试曲线如下图: 由图上得出?t=3.42ms,V=2L/?t=2?6/3.42=3510m/s ?t1=1.13ms,L q=V?t/2=3510?1.13/2/1000=2.0 m 七、结论 经测试得出如下结论: 1.所测试桩基桩身砼波速为3510m/s; 2. 所测试桩在约2.0m处有轻微缺陷存在; 3.根据规范《建筑基桩检测技术规范(JGJ106-2003)》和测试结果,所测试桩被判断为Ⅱ类桩。
金属材料工程综合性设计性实验报告
金属热处理综合性、设计性实验报告课题名称:45号钢正常淬火与回火专业:金属材料工程 班级: 3班 姓名:訾春雨 学号:0907024308 指导教师:马臣
实验地点:佳木斯大学金属材料教研室 实验课题名称:45号钢的淬火与回火 实验课题目的:对比在不同温度下对45号钢进行淬火,回火实验。后的组织及其硬度HRC之间的影响 实验组成员: 组长:陈伟强 组员:訾春雨 霍长亮 孙国威 刘继宗 王晓旭 杨建
一、实验目的 通过选材,测试原材料硬度,设计热处理工艺,进行热处理(淬火,回火),测试处理后材料硬度,制备金相组织,在显微镜下进行观察。研究组织构成,分析材料成分、性能、热处理工艺组织结构之间的关系。培养综合分析能力。 二.实验设备 砂轮机,火花图谱,热处理中温炉5台,高温炉1台,金相磨抛光机4台,金相显微镜3台,布氏硬度计1台,洛氏硬度计3台,盐水1桶,机油1桶。金属材料试件(5种) 三.实验步骤 1.材料选择: 拟制造零件:拖拉机传动轴、活塞销、收割机刀片、锉刀、滚动轴承等。 根据零件挑选试样,后用砂轮机磨试样,观看活化形貌,对照火花图谱,鉴别材料。 材料牌号判定结果:45号钢 2.试样力学性能测定: 3.设计热处理工艺: 根据材料牌号,计划用于制造活塞销零件。采用回火工艺,零件硬度要求达到50-65HRC 查表制定热处理工艺。 淬火温度:800℃ 保温时间:t=KD K=1.0min/mm D为零件直径t=1×30=30分钟 淬火介质:水 回火温度:400℃ 回火时间:240分钟 画出热处理工艺
4.热处理试验: 将淬火炉 炉温升到800℃ 回火炉 炉温升到400℃、放入工件,保温60分后,进行淬火和回火。 5.热处理后材料硬度测试: 用HR150洛氏硬度计测量淬火,回火后试样硬度。 测试淬火后硬度值:56.4HRC 回火后硬度值:31.2HRC- 6.制备金相试样: 通过磨平、粗磨、抛光、腐蚀与吹干等制样步骤,制备金相试样。(写明过程) 1.取样 用金相切割机或线切割机床截取,切割时要用水冷却,以免试样受热引起组织变化纵向取样,大小通常一般为φ12×15mm 圆柱体 2.磨光 目的是得到一个平整光滑的表面。磨光分粗磨和细磨。 粗磨:一般材料可用砂轮机将试样磨面磨平;要倒角倒边。 细磨:目的是消除粗磨留下的划痕,为下一步的抛光作准备,细磨又分为手工细磨和机械细磨。 手工细磨:选用不同粒度的金相砂纸(180、240、400、600、800),由粗到细进行磨制。磨时将砂纸放在玻璃板上,手持试样单方向向前推磨,切不可来回磨制,用力均匀,不宜过重。每换一号砂纸时,试样磨面需转90°,与旧划痕垂直,以此类推,直到旧划痕消失为止。试样细磨结束后,用水将试样冲洗干净待抛。 3.抛光 目的是去除试样磨面上经细磨留下的细微划痕,使试样磨面成为光亮无痕的镜面。此次使用的是机械抛光。 机械抛光在金相抛光机上进行。抛光时,试样磨面应均匀的轻压在抛光盘上。并将试样由中心至边缘移动。并做轻微移动。在抛光过程中要以量少次数多和由中心向外扩展的原则不断加入抛光微粉乳液,抛光应保持适当的湿度,因为太湿降低磨削力,使试样中的硬质相呈现浮雕。湿度太小,由于摩擦生热会使试样生温,使试样产生晦暗现象,其合适的抛光湿度是以提起试样后磨面上的水膜在3~5秒钟内蒸发完为准。 抛光压力不宜
土工试验
单元7 土工试验 土工试验的项目较多,每个试验项目都有几个不同的试验方法,本章选择的五项试验均参照国家现行标准《土工试验方法标准》GB/T 50123-1999和《土的工程分类标准》GB/50145-2007(以下简称《标准》)编制。 7.1 土的基本物理指标测定 一、试验目的 在实验室内直接测定土的密度、土粒比重、含水率三个实测指标,这三个指标称为土的三相基本试验指标。土的其它指标可以计算求得,称为换算指标。 二、试验方法 1. 测定土的密度试验方法有环刀法、蜡封法、灌水法、灌砂法等。对于细粒土,采用环刀法;对于易破裂土和形状不规则的坚硬土,可用蜡封法;对于现场粗粒土,一般用灌水法或灌砂法。 2. 根据土粒径的不同,土粒比重试验可分别采用比重瓶法、浮称法和虹吸筒法。对于粒径小于5mm的各类土,采用比重瓶法;对于粒径等于大于5mm的各类土,且其中粒径大于20mm的土质量小于总土质量的10%时,采用浮称法;对于粒径等于大于5mm的各类土,其中粒径大于20mm的土质量等于大于总土质量的10%时,采用虹吸筒法试验。 3. 含水率试验可分别采用烘干法、酒精燃烧法、炒干法、比重法等。 三、密度试验——环刀法 1.仪器设备 环刀;天平,感量0.1g;切土刀;推土器;游标卡尺;凡士林等。 2.试验步骤 (1) 用卡尺测出环刀的高和内径,并计算出环刀的容积V(cm3)。 (2) 称环刀的质量m1,准确至0.1g。
(3) 在环刀内壁涂一层薄薄的凡士林油,刃口向下放在试样上。 (4) 用切土刀沿环刀外缘将土样削成略大于环刀直径的土柱,然后慢慢将环刀垂直下压,边压边削,到土样伸出环刀上部为止,削去环刀两端余土,使与环刀口面齐平。把削下的土样做含水率试验。 (5) 擦净环刀外壁,称量环刀加土的质量m 2,准确至0.1g 。 (6) 用推土器将试样从环刀中推出。 (7) 本试验应进行二次平行测定,两次测定的差值不得大于0.03g/ cm 3,取两次测定的算术平均值。 3.成果整理 (1) 按式(7—1)计算土的湿密度: ()021m m V ρ=- (7—1) 式中:ρ0 —— 土的湿密度(g/ cm 3),准确到0.01 g/ cm 3; m 1 —— 环刀的质量(g ); m 2 —— 环刀加土的质量(g ); V —— 环刀容积V (cm 3)。 (2) 按式(7—2)计算土的干密度: ()0010.01d w ρρ=+ (7—2) 式中:ρd —— 土的干密度(g/ cm 3); w 0 —— 土的含水率(%)。 (3) 填写试验记录。格式见表7-1。 表7-1 密度试验记录(环刀法) 试验日期 试验者 计算者 校核者 4.注意事项 (1) 操作要快,动作细心,以避免土样被扰动、破坏结构及水分蒸发。 (2) 环刀方向要正、要垂直,加力适当。 (3) 边压边削的时候,切土刀要向外倾斜,以免把环刀下面的土样削空。
金属材料工程专业
金属材料工程专业 专业简介 学科:工学 门类:材料类 专业名称:金属材料工程专业 本专业培养能在冶金、材料结构研究与分析、金属材料复合材料制备、金属材料成型等领域从事科学研究、技术开发、工艺和设备设计、生产及经营管理等方面工作的高级工程技术人才。就业方向多在冶金、机械、电子、化工、军工、航空航天、仪表等行业的公司、厂矿、科研设计单位,可以在高校从事同材料有关的科研、设计、开发,对新型材料的生产的管理,以及教学等工作。 专业信息 培养目标:本专业培养具备金属材料科学与工程等方面的知识,冶金、材料结构研究与分析、金属材料及复合材料制备、金属材料成型等领域从事科学研究、技术开发、工艺和设备设计、生产及经营管理等方面工作的高级工程技术人才。 培养要求:本专业学生主要学习材料科学的基础理论,掌握金属材料及其复合材料的成分、组织结构、生产工艺、环境与性能之间关系的基本规律。通过综合合金设计和工艺设计,提高材料的性能、质量和寿命,并开发新的材料及工艺。毕业生应获得以下几方面的知识和能力: ◆掌握材料科学的基础理论; ◆掌握金属材料的专业基础理论知识; ◆掌握金属材料的成型和加工工程的专业知识和技术经济管理知识; ◆掌握金属材料制品的检测、产品质量控制和防护措施的基本知识和技能; ◆具有金属材料的设计、选用及正确选择生产工艺及设备的初步能力; ◆具有本专业必需的机械、电工与电子技术、计算机应用的基本知识和技能; ◆具有研究开发新材料、新工艺和设备的初步能力。 主干学科:材料科学与工程。 主要课程:材料热力学、金属学、材料力学性能、材料分析技术、金属材料学、材料成型加工工艺与设备、计算机在材料工程中的应用。 实践教学:包括金工实习、生产实习、课程设计、专业实验、计算机应用及上机实践、毕业设计。 修业年限:4年。 授予学位:工学学士学位。 原专业名:金属材料与热处理(部分)、金属压力加工、粉末冶金、复合材料(部分)、腐蚀与防护、铸造(部分)、塑性成形工艺及设备(部分)。 就业数据
土工试验方法标准上传
目录 1.总则--------------------------------------------------------- 3 2.术语、符号-------------------------------------------------3 3. 试样制备----------------------------------------------------5 4. 含水率试验-------------------------------------------------7 5. 密度试验----------------------------------------------------8 6. 颗粒分析试验----------------------------------------------8 6.2 粘粒分析移液管法试验----------------------------------10 7. 液塑限含水率试验----------------------------------------12 8 固结/黄土湿陷试验---------------------------------------13 9. 直接剪切试验---------------------------------------------17
土工试验方法 1.总则 1.0.1 为了测定土的基本工程性质,统一试验方法,为本工程设计和施工提供了可靠的参数,特制定本标准。 1.0.2 本标准适用于工业与民用建筑、水利、交通等各类工程的地基与填筑土料的基本工程性质试验。 1.0.3 土工试验资料的整理,应通过对样本(试验测得的数据)的研究来估计土体单元特征及其变化的规律,使土工试验的成果为工程设计和施工提供准确可靠的土性指标,试验结果的分析整理应附录A进行。 1.0.4 土工试验所用的仪器、设备应按现行国家标准《土工仪器的基本参数及通用技术条件》GB/T15406采用,并定期按现行有关规程进行检定和校准。 1.0.5土工试验方法除应遵守本标准外,商应符合有关现行强制性国家标准。 2.术语、符号 2.1 术语 2.1.1 校准 在规定条件下,为确定计量仪器和测量系统的示值或实物量具有所代表的值与相对应的被测量的已知值之间关系的一组操作。 2.1.2 测力计 强度试验时所用的钢环或负荷传感器。 2.1.3 平行测定 在相同条件下,采用两个以上的试样同时进行试验。 2.1.4 抗剪强度参数 表征土体抗剪切性能的指标,包括粘聚力和内摩擦角。 2.1.5 土试样 用于试验的具有代表性的土样。 2.2 符号 2.2.1 尺寸和时间
金属材料的熔炼和浇铸部分实验报告
《材料的制备技术与实践课程-金属材料》 金属材料的熔炼和浇铸部分实验报告 一、实验目的 金属材料的熔炼和铸造作为金属材料使用最为广泛的成型方法之一,在工业零件,尤其是大型零件的制备中具有不可替代的地位。本实验通过对有色合金进行熔炼浇注,了解铸造的整个流程,对金属的铸造有直观的认识。 二、实验方法 实验步骤: 1. 坩埚熔炼炉的使用 本实验使用电阻坩埚熔炼炉,主要包括两个部分:加热部分-电阻丝加热熔炼炉和控温部分-控温 实验名称 金属材料的熔炼和浇铸部分 时间地点 2015年12月 23 日 材料学院325室 指导教师 王军、严彪 专业班级 无机 班 级 无机班 学生姓名 沈 杰 学 号 1531519
继电器。 打开总电源,在控温继电器的显示屏幕上显示有两个数字,红色的数字为当前熔炼炉炉内温度,绿色数字为设定的加热保温温度。待继电器示数稳定后,对加热温度进行设置。 点击按钮,设定数字变为4位数并闪动,点击按钮,选择要改变的位置,按进行调节,直到设定为想要的温度。点击按钮,确定加热保温温度。打开加热电源后,电流表显示有加热电流,说明已经开始加热。到达温度后保温一段时间,直至坩埚内金属熔化为液态。 2.金属浇注的方法 关闭加热电源,打开熔炼炉炉盖,用铁钳将坩埚从熔炼炉中取出,慢慢倾倒坩埚,使得里面的金属溶液慢慢流入模具中,充满整个形腔。将模具静置,待其冷却后卸模取样。 注意事项: 金属浇注是高温操作,必须注意安全,必须穿戴白帆布工作服和工作皮鞋。严格按照操作流程,预防危险。浇注前,必须清理浇注行进通道,防止摔倒。浇注时必须切断加热电源。在浇注前对模具进行预烘,防止模具中残留水分导致金属溶液飞溅。 三、思考题 1、铸造时温度的选择有什么要求? 铸造过程中温度的选择至关重要:过高温度浇注易造成粘砂、铁夹砂、缩孔、缩松、热裂、跑火、局部氧化、尺寸不合格、反应性气孔偏多等缺陷;过低温度浇注易造成:浇不足、冷隔、过渡圆角偏大、夹渣、夹砂、析出性气孔偏多等缺陷。 在铸造过程中,对浇注温度的要求:“薄壁上限,厚大下限”。薄壁上限是指当铸件有薄壁类结构时为了减少浇不足、冷隔等冲型类缺陷要将浇筑注温度提高到上限值来提高钢(铁)水的流动性;厚壁下限要引出一个说法叫低温快浇。在铸件浇注时,适度的降低浇注温度可以减少涂料的耐火压力,降低液态收缩量,在某些条件下可以起到细化晶粒,减少成分偏析,改善围观组织,将宏观的集中缩空转化为微观的晶界疏松等作用。但是充型能力会变差,这也就是壁厚的铸件可以适当的降低浇注温度的原因。 对于不同铸锭的具体要求如下:
土工实验报告
二密度试验 2.1基本原理: 土(体)的密度是指土的单位体积的质量,单位是g/cm3或kg/m3,土的密度可分为天然密度(湿密度)和干密度两种。 2.2试验方法及适用围 ⑴环刀法:一般适用于原状样中的细粒土,未受扰动的砂土,以 及形状规则的土体。 ⑵蜡封法:适用于具有不规则形状的易碎裂的难以切割的土体。 ⑶灌砂法,灌水法:用于对粗粒土密度的测试,主要用于施工现 场的测试。 2.3 仪器设备 ⑴环刀法:环刀,天平,切土刀,钢丝锯,凡士林等 ⑵蜡封法:架盘天平(最大称量500克,感量0.01克),蜡,烧 杯,细线,针,切土刀等 ⑶灌水法:台称(最大称量20千克,感量1克,最大称量50千 克,感量5克),水平尺,铁铲,塑料薄膜,盛水桶, 装土器具等 2.4试验步骤 (环刀法) ⑴称量所使用环刀的质量和体积。 ⑵取待测试的土样,整平其两端,在环刀壁均匀地涂上一薄层 凡士林,然后将环刀刀口向下放在土样上。 ⑶将土样削成略大于环刀直径的土柱,然后将环刀向下压,边
压边削,至土样露出环刀为止,将两端余土削平修平,并取 剩余代表土样测定含水率。 ⑷擦干环刀外壁,称量环刀和土的总质量。 ⑸计算ρ0 = m /v ρd = ρ0/(1+0.01w) ⑹本试验需进行两次平行测定,其平行差值应不大于0.03g/cm3, 否则应重新测定,取两次的平均值作为该土样的密度值。 实验数据的计算过程 环刀号:315 环刀质量:42.92g 环刀+土重:160.98g 环刀体积 60cm3 密度:(160.98g-42.92g)/60cm=1.97g/cm3 环刀号:280 环刀质量:42.91g 环刀+土重:164.19g 环刀体积60cm3密度:(164.19g-42.91g)/60cm=2.02g/cm3 平均密度:(1.97+2.02)/2=1.995g/cm3 指标应用: (1)密度是土的基本物理指标之一,可用来计算土的干密度,孔隙比指标等。 (2) 用来计算土的自重应力。 (3) 用来计算地基稳定性和地基承载力。
金属材料工程简介
二、专业综合介绍 材料科学是21世纪四大支柱学科之一,而金属材料工程则是材料科学中一个重要的专业方向。众所周知,金属工具的制造和使用标志着人类文明的一个重大进步。从青铜到钢铁,再到当今形形色色的合金材料,人类在自身不断进步的同时,从未放松过对金属材料的研究和开发。金属材料工程是国家重点支持的研究方向,每年都有大量的资金投入,成果也很显著。该专业研究范围很广,可以说所有的金属元素都在其研究范围之内。目前国内主要侧重于铁合金、铝合金以及其他一些特种金属材料的 研究开发。 金属材料工程是一门实用性很强的专业,通过对金属材料制备工艺及其原理的探索,研究成果可以直接应用于现实生产,所取得的进展和人民群众的日常生活密切相关。但喜欢理论研究的同学也可以在此发挥自己的才能,这里有广阔的理论研究空间。材料技术人员虽然掌握了许多种金属材料的制备工艺,但至今还没有完全弄清楚其中的道理,而从理论上阐明这一切对材料科学的进一步发展意义非凡。于是从中也演化出计算材料学,也就是利用计算机模拟各种原子、分子的相互作用,从而设计出符合要求的材料,这对现实生产有着极其重要的指导作用。近年来,这一领域还有许多新的发展,比如储氢材料、摩擦材料以及和纳米技术相结合的协同材料等等。
金属材料工程发展历史很长,基础非常雄厚,可以说从事这方面研究的人员一开始就站在了巨人的肩膀上,这对许多同学来说是非常有利的。这里培养的学生大都具有很高的专业素养,技术能力出众;同时他们所学到的知识和经验往往是和其他学科相通的,所以在毕业后能够适应多种工作,正所谓大学生关键在学习“方法”而不是纯粹的知识。但是需要注意的是,借助学科雄厚的基础,初学者虽然很容易入门,但入门后看见的是一片片整整齐齐的田野,仿佛没有值得开垦的地方,要想取得突破性进展得下一番力气。因此学生在学习时需要注重培养自己的观察和判断能力,不盲目迷信书本和权威,敢于放开自己的思维。大家要记住,金属材料工程专业需要严谨、勤奋、踏实的作风,这里所取得的任何成就都是建立在辛勤汗水之上的。同时,还要注重学习“方法”而不只是记忆“知识”,要知道,金属材料研究有很长的历史,其中许多方法是很值得其他领域借鉴的。有志于为国家的长久发展做出贡献的同学不妨考虑这个专业,因为她的成果和国计民生息息相关。举例说,我国是钢铁生产大国,年出口量很大,但是我们送出去的大多是廉价的原料钢种,一些发达国家加工后又以较高的价格返销回来。经济上的损失不说,还使我国在许多方面受制于人。近年来我们在金属材料研究领域取得了很大的进展,但仍需要有志青年投身其中。 经过本科学习,你会获得工学学士学位,这预示着你将成为从事金属材料的制备、生产、开发、应用和管理的高级专业
金属材料专业实验
金属材料工程专业综合实验 实验题目热处理工艺对组织和性能的影响学院机械工程学院 班级08材料 学号A08XXX 姓名XXX 日期2011.12.27—2012.1.8
一、实验目的与要求 专业综合实验是材料类专业的一个重要的实践教学环节。 由于它对前继课程的涵盖性以及生产实际的密切联系,所以在培养学生的综合实验能力和提高综合素质方面具有不可替代的作用。 专业综合实验是学生在校期间第一次较全面的实验能力训练,在学生总体培养目标中占有重要的地位。通过对一般通用材料的化学成分、显微组织分析、建立热处理工艺与性能之间的联系,使学生掌握含碳量、加热温度、冷却速度、回火温度对组织性能的影响,熟悉材料分析的基本方法;对学生进行热处理工程师的基本训练,是学生会使用现代的实验方法。加深学生对也学过的专业基础及专业课的理解,为学生的毕业设计打下坚实的基础。 要求学生查阅一定数量的相关资料,根据自己的题目制定热处理工艺及实验方案,自己动手实施热处理,测定材料的化学成分及强度、塑性、韧性、硬度等。照出的显微组织要清晰、典型,最后整理实验数据、写出实验报告。 二、实验类型 验证型实验 三、实验原理及说明 1.钢的退火与正火
把钢加热到临界温度以上或一下,保温一定的时间,然后随炉冷却的热处理工艺称为退火。退火目的是均匀化学成分、改善机械性能及工艺性能、消除或减少内应力,细化晶粒,改善组织,并为零件最终热处理准备合适的内部组织。退火包括完全退火和不完全退火 把钢加热到临界温度以上,完全奥氏体化,保温一定的时间,然后空冷的热处理工艺成为正火。正火的目的是获得一定的硬度、细化晶粒,消除组织中的缺陷。 2.钢的淬火与回火 把钢加热到临界温度A C1或A C3以上保温并随之以大于临界冷却速度冷却,以得到马氏体或下贝氏体组织的热处理工艺称为淬火。淬火的主要目的是提高材料的硬度和强度。对于45号钢,淬火组织为马氏体+残余奥氏体。 回火是将淬火后的钢件加热到A1一下某温度,经保温后冷却到室温,使其转变成稳定的回火组织。回火的目的是消除淬火后产生的应力,降低脆性,改善机械性能。按回火温度可分为: 低温回火温度为150—250℃ 中温回火温度为350—500℃ 高温回火温度为500—650℃ 其组织依次为回火马氏体、回火屈氏体和回火索氏体。 3.热处理工艺要素 加热温度(T)、保温时间(t)、冷却速度(V)。热处理工艺的制定主要参照这三要素。 (1)加热温度 对于45号钢,加热温度不足,得到铁素体+马氏体,会出现软点,硬度下降。加热温度过高,会引起奥氏体晶粒粗大,机械性能下降。 (2)保温时间的确定 主要考虑钢的化学成分、原始状态、工件的形状及尺寸、装炉量和装炉方式。 (3)冷却速度影响 冷却速度直接影响到钢淬火后的组织和性能。选择淬火介质的第一
金属材料工程实训报告
专业实训报告 专业:金属材料工程 班级:金属材料1104 姓名:周子恒 学号:11495100425 指导教师:范才河 成绩: 冶金工程学院 2014-2015学年第1学期
实训要求与报告撰写说明 1. 实训期间学生须遵守有关的规章制度和实训纪律,树立安全第一的思想,要经常与指导老师交流,按时完成本报告。 2. 指导老师由系安排,负责学生实训期间及报告填写过程中的专业指导,并根据实训报告、实训表现、实训操作等对学生进行综合鉴定和评分。 3. 本报告为学生专业实训总结,请认真如实填写。 4. 本报告作为学生综合实践环节基本材料,必须在指定时间内交系办公室。 5. 实训报告完成所涉及的部分内容要求: (1)实训目的:实验最重要的做法与目标简述。 (2)实训背景:原理文字叙述、公式、实验装置示意图、原理图等。 (3)实训方案:结合实验设备,方案设计合理、新颖。 (4)实训步骤:实训进行的步骤、过程,用自己思考的方式给予整理叙述,画出流程图。 (5)实训数据和数据处理:纪录实训结果,并加以分析,作图并计算出所有可能经计算的数据(可以怀疑实训数据重做实验,千万不可攥改数据)。 (6)实训结论:经过数据处理后得出的实验结果或结论。 (7)意见和建议:改进实训建议、实训成功或失败的经验教训总结,并讨论可能改进实训正确性的方式与实验装置。 6. 特殊情况可附加说明。 7. 实验报告版面按A4纸打印,但内容要求手写,绝不能抄袭!图用坐标纸画出后及表格用尺子画出或打印后粘贴在实训报告内。 冶金工程学院
目录 实训一中厚板轧制过程模拟 (3) 实训二型钢轧制过程模拟 (21)
认识实习报告金属材料工程专业
认识实习报告 专业:金材BG141; 姓名:孙宇航; 学号:6516114123; 指导教师:陈丹; 二零一五年九月
时间过得很快,转眼之间已经大二了,然而大多数同学对本专业的认识还不够,学校为了让我们更多的了解金属工艺学,金属的低压锻造,金属的热处理技术的认识,加深金属在工业各领域应用的感性认识,开阔视野,了解相关设备及技术资料,熟悉典型零件的加工工艺,特意安排我们到沈阳航天三菱汽车发动机制造有限公司,沈阳锻造工业有限公司,沈阳航天誉兴机械制造有限公司进行实习,在引导员和老师的带领下,从总体了解各个企业的生产原料、产品以及生产流程,并熟悉了一些重要的零部件的生产方法。 1.以下就是这次实习参观的三家的简介: 一:沈阳航天三菱汽车发动机制造有限公司 沈阳航天三菱 沈阳航天三菱汽车发动机制造有限公司是由中国、日本、马来西亚三国五家公司出资组建的中外合资企业,成立于1997年8月。中国航天汽车有限责任公司占股比30%,三菱自动车工业株式会社占股
比25%,沈阳建华汽车发动机有限公司占股比21%,马中投资控股有限公司占股比14.7%,三菱商事株式会社占股比9.3%,公司注册资本73,825万元人民币,资产总额304,879万元(2012年4月底),厂址坐落在辽宁省沈阳市浑南新区航天路6号。 它的企业产品有: 公司引进日本三菱自动车4G6系列 (2.0/2.4L )、4G6 MIVEC (可变气门正时 及升程技术)系列(2.0/2.4L )、A9系列 (1.1/1.3/1.5/1.6L)发动机制造技术,产品 具有技术领先,低噪音、低振动、低油耗特点, 排放可达到国四标准。我公司2007年最新引进的A9系列发动机具有高性能、轻量化、高环保等主要特点,是继在德国生产销售后,全球上第二家及亚洲首家生产销售此款发动机的公司。 截止2009年12月,发动机累计产销超过100万台,已为国内20多家整车厂配套。发动机已随整车出口到美国、意大利、埃及、澳大利亚等国际市场。我公司是由日本三菱商标委员会授权在中国境内唯一合法使用三菱标志的发动机生产企业。 4G6系列(2.0/2.4L )
土工标准击实试验实施细则
土工标准击实试验实施细则 3.21.1 试样制备 3.21.1.1 干土法(土重复使用)将具有代表性的风干或在50℃温度下烘干的土样放在橡皮板上,用圆木棍碾散,然后过不同孔径的筛(视粒径大小而定)。对于小试筒,按四分法取筛下的土约3kg;对于大试筒,同样按四分法取样约6.5kg。 估计土样风干或天然含水量,如风干含水量低于开始含水量太多时,可将土样铺于一不吸水的盘上,用喷水设备均匀地喷洒适当用量的水,并充分伴和,闷料一夜备用。 3.21.1.2干土法(土不重复使用)按四分法至少准备5个试样,分别加入不同水分(按2~3%含水量递增),拌匀后闷料一夜备用。 3.21.1.3 湿土法(土不重复使用)对于高含水量土,可省略过筛步骤,用手拣出大于38mm的粗石子即可。保持天然含水量的第一个土样,可立即用于击实试验。其余几个试样,将土分成小土块,分别风干,使含水量按2%~3%递减。 3.21.2 试验程序 根据工程要求选择轻型或重型试验方法。根据土的性质(含易击碎风化石数量多少,含水量高低)选用干.
土法(土重复或不重复使用)或湿土法。 将击实筒放在坚硬的地面上,取制备好的土样分3~5 次倒入筒内。小筒按三层法时,每次约800~900g(其量应 使击实后的试样等于或略高于筒高的1/3);按五层法时,每次约400~500g(其量应使击实后的试样等于或略高于筒高 的1/5)。对于大试筒,先将垫块放入筒内底板上,按五层法时,每层需试样约900g(细粒土)~1100g(粗粒土);按三层法时,每层需试样1700g左右。整平表面,并稍加压紧,然后按规定的击数进行第一层土的击实,击实时击锤应自由垂直落下,锤迹必须均匀分布于土样面,第一层击实完后,将试样层面“拉毛”,然后再装入套筒,重复上述方法进行 其余各层土的击实,试样不应高出筒顶面6mm。 用修土刀沿套筒内壁削刮,使试样与套筒脱离后,扭动并取下套筒,齐筒顶细心削平试样,拆除底板,擦净筒外壁,称量,准确至1g。 用推土器推出筒内试样,从试样中心处取样测其含水量,计算至0.1%。测定含水量用试样的数量按下表规定取样(取出有代表性的土样)。 测定水含量用试样的数量
金属材料工程试验报告
金属材料工程试验报告 一、实验目的 学会综合应用已学的相关课程知识,解决实际问题。达到理论知识的复习、巩固、验证与应用及动手能力的培养和工程经验的积累的目的。本实验旨在培养考察材料专业本科学生对专业知识、专业技能的掌握和运用,通过ZL109的熔炼、热处理工艺,以及热处理之后对材料性能、组织成分的检测等材料制备整个流程的设计实验,要求学生设计实验方案、进行实验过程操作、对实验制备得到的试样进行性能检测和成分分析。 二、实验材料及设备 ZL109铝锭铝块、变质剂、精炼剂、铸模、坩埚、箱式炉、井式炉、烘干器、水浴箱、五金配套工具、拉伸试验机、硬度仪、金相显微镜、吹风机、数码相机、计算机、金相砂纸、氢氟酸等。 三、实验方案设计 1、查得ZL109的合金牌号为 ZAlSi12Cu1Mg1Ni1 铸造铝合金的化学成分以及杂质允许含量数据如下表所示: Si Cu Mg Mn Fe Zn 11.0-13.0% 0.5~1.5% 0.8-1.3% ≤0.2% ≤0.7% ≤0.2% 2、制定金属熔炼及热处理工艺卡片(见第二页) 3、性能测试样加工图: 实验基本流程:金属熔炼→浇注成型→热处理→组织成分、力学性能检测。
四、实验步骤 1、铸造铝合金的铸锭成型方法 (1)铸造铝合金熔炼方法,其技术要点是:纯铝在坩埚内熔化后,铝液温度达到690℃-720℃时加入纯硅,当铝硅液温度达到700℃-730℃(由于熔点相差很大,溶解的很慢,需要较大的过热才能完全溶解)加入10Kg的NaNO、13Kg的BaCl、10Kg的NaF、13Kg的NaAlF、21Kg的KTiF、6Kg的KBF、13Kg的NaCl、10Kg的C粉配制成的精炼变质细化剂,用侵盐勺压入铝液面下,距坩埚底100-150mm。该铸造合金熔炼方法可达到精炼、变质、细化一步完成,操作时间缩短,减少合金熔炼增铁,提高铝合金质量,并能减少对环境的污染。 实际实验操作过程中,考虑到实验经费、金属原料循环利用等因素,采用去年04级学生修习本课程时已经制备好的ZL109铝锭铝块重新回炉熔炼。 (2)铸造铝合金熔炼方法,包括以下步骤: ①将适于熔炼铝硅合金的熔炼炉清理干净,预热至200-300℃,喷刷涂料;准备熔炼操作用各种工具,清理干净,预热至200-300℃,喷刷涂料,并烘烤去除水份; ②将预先配制好的精炼变质细化剂按处理铝硅液量的需要称量好,放入烘干箱,在200-300℃下烘烤数分钟,备用; ③装炉熔化:先将回炉料装入熔炼炉,再按设定铝硅配比加入纯铝和纯硅;熔化后搅拌均匀,再加入所需中间合金,待化清后搅拌均匀; ④精炼、变质、细化综合处理,并按需要调整好铝液的化学成份;
土工试验实训报告
土工测试 实验报告书 1.分级连续加载条件下的粘性土蠕变试验 2.三轴压缩实验测土的抗剪强度参数 3.duncan-chang模型参数的确定 4.通过标准固结试验测固结系数 5.剑桥模型的推导 1分级连续加载条件下的粘性土蠕变试验 实验目的: 通过测定试样在分级连续加载条件下固结引起的变形随时间的变化,分析试样得蠕变特性及相应的模型。 实验器材:(试样采用非饱和的细粒土) 固结容器:由刚性底座、护环、环刀、上环、透水板、加压上盖和密封圈组成。(1)环刀:直径61.8mm,高度20mm,一端有刀刃,应具有一定刚度,内壁应保持较高的光洁度,宜涂一薄层硅脂和聚四氟乙烯。 (2)透水板:由氧化铝或不受腐蚀的金属材料制成。渗透系数应大于试样的渗透系数。试 样上部透水板直径宜小于环刀内径0.2~0.5mm,厚度5mm。(3)变形量测设备:量表,单位为0.1mm。(4)加荷设备:砝码、杠杆加压设备。 实验步骤: 1.制备土样将土块加水饱和,尽量搅拌至各处含水率均匀,备用。用电子秤秤环刀的 重量。 2.取土样用环刀切取已准备好的土样,用工具沿环刀高度切平土面,去掉多余的土、 用水浸湿,将滤纸盖在土样的两边,再次称量重量。 3.安装土样将环刀和土样一起放入固结盒,在土样上下各放置一块透水石,盖上加压 盖,安装到加载装置上。 4.调平将加压杠杆调平,装好量表,调至零点。 5.分级加载分为4个荷载等级加载:60kpa,120kpa,180kpa,240kpa,分别为并在每 级荷载下记录0s,15s,2min15s,4min,6min15s,9min,12min15s,16min2 20min15s时的量表读数。 6.实验结束清理仪器,整理数据。 数据整理及实验分析: 室内分级加载固结蠕变实验结果如表1及图1所示: 表1 各级荷载下土的应变(mm) 图1 各种荷载作用下的蠕变曲线 蠕变是在恒定应力作用下变形随时间增长的现象。图1是土样在各种荷载作用下的蠕变曲线,在各级荷载作用下,土体的蠕变曲线非常相似。经历了加载时的瞬时变形、随时间急剧的变形,如果时间够长,还可以观察到随时间缓慢增加并趋于稳定的阶段,且荷载越大,变形越大,达到稳定的时间越长。从而粘性土的蠕变ε、应力σ与时间t的关系:ε=f(σ,t) 且为非线性蠕变关系。 基本流变元件有虎克弹簧、牛顿粘壶及圣维南刚塑体三种,计算模型都是由以上三种线性基本元件组合而成。由于应变随时间最后达到稳定状态,则可以用麦钦特(merchant)模型来描述,该模型由虎克弹簧和伏埃脱体串联而成,如图2所示。在常应力作用下,有如下关系: ε=σ/e0 +σ(1-exp(-e1t/k1))/e1 图2 merchant模型 2三轴压缩实验测土的抗剪强度参数 试验目的: