JMP10分析软件的学习资料

DRAFT 10.0
Highlights in JMP 10
What’s New in JMP and JMP Pro JMP 10 provides new analysis platforms, major additions to several platforms, and new utilities for
debugging JSL and easily creating JSL applications.
DRAFT 10.0
Contents
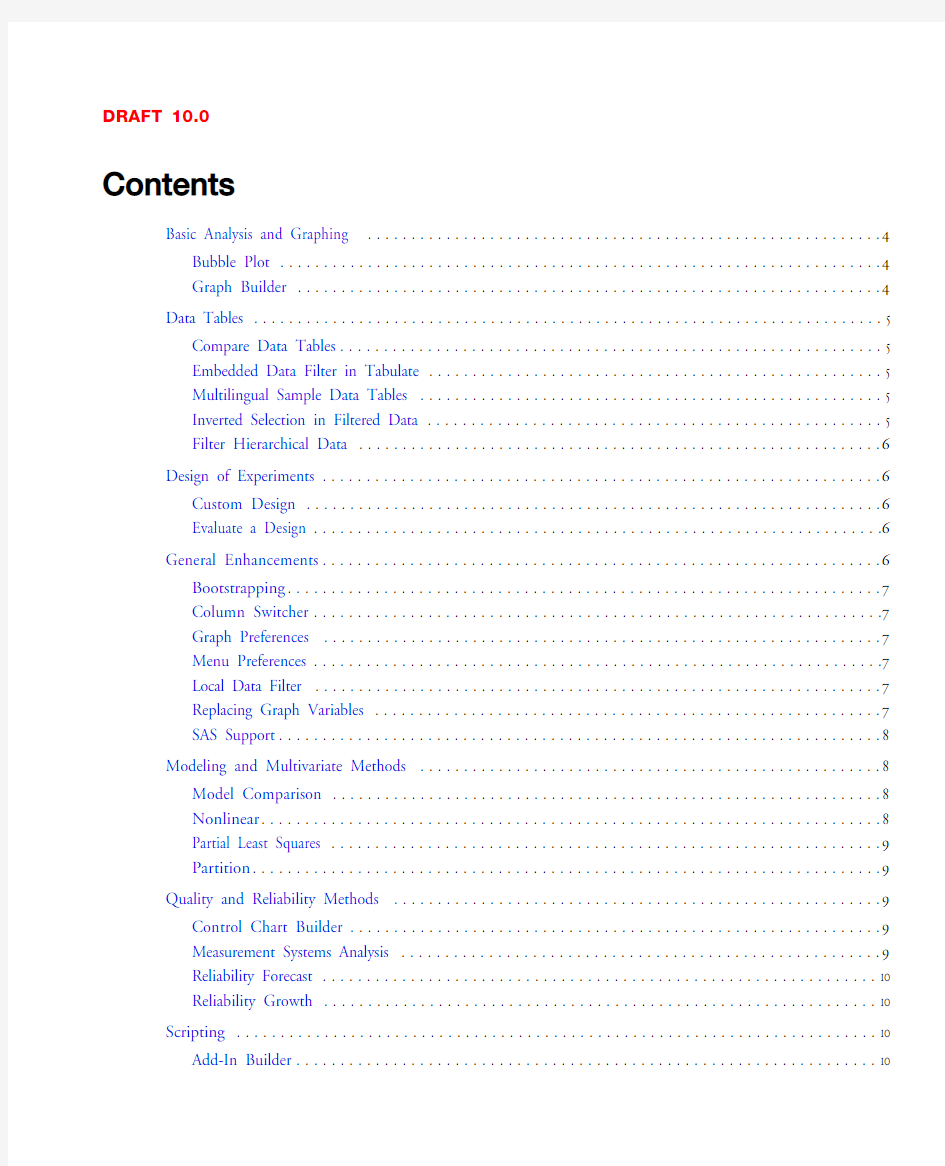
Basic Analysis and Graphing . . . . . . . . . . . . . . . . . . . . . . . . . . . . . . . . . . . . . . . . . . . . . . . . . . . . . . . . . . .4 Bubble Plot . . . . . . . . . . . . . . . . . . . . . . . . . . . . . . . . . . . . . . . . . . . . . . . . . . . . . . . . . . . . . . . . . . . . .4
Graph Builder . . . . . . . . . . . . . . . . . . . . . . . . . . . . . . . . . . . . . . . . . . . . . . . . . . . . . . . . . . . . . . . . . . .4 Data Tables . . . . . . . . . . . . . . . . . . . . . . . . . . . . . . . . . . . . . . . . . . . . . . . . . . . . . . . . . . . . . . . . . . . . . . . . 5 Compare Data Tables. . . . . . . . . . . . . . . . . . . . . . . . . . . . . . . . . . . . . . . . . . . . . . . . . . . . . . . . . . . . . . 5
Embedded Data Filter in Tabulate . . . . . . . . . . . . . . . . . . . . . . . . . . . . . . . . . . . . . . . . . . . . . . . . . . . . 5
Multilingual Sample Data Tables . . . . . . . . . . . . . . . . . . . . . . . . . . . . . . . . . . . . . . . . . . . . . . . . . . . . . 5
Inverted Selection in Filtered Data. . . . . . . . . . . . . . . . . . . . . . . . . . . . . . . . . . . . . . . . . . . . . . . . . . . . 5
Filter Hierarchical Data . . . . . . . . . . . . . . . . . . . . . . . . . . . . . . . . . . . . . . . . . . . . . . . . . . . . . . . . . . . .6 Design of Experiments. . . . . . . . . . . . . . . . . . . . . . . . . . . . . . . . . . . . . . . . . . . . . . . . . . . . . . . . . . . . . . . .6 Custom Design . . . . . . . . . . . . . . . . . . . . . . . . . . . . . . . . . . . . . . . . . . . . . . . . . . . . . . . . . . . . . . . . . .6
Evaluate a Design. . . . . . . . . . . . . . . . . . . . . . . . . . . . . . . . . . . . . . . . . . . . . . . . . . . . . . . . . . . . . . . . .6 General Enhancements. . . . . . . . . . . . . . . . . . . . . . . . . . . . . . . . . . . . . . . . . . . . . . . . . . . . . . . . . . . . . . . .6 Bootstrapping. . . . . . . . . . . . . . . . . . . . . . . . . . . . . . . . . . . . . . . . . . . . . . . . . . . . . . . . . . . . . . . . . . . .7
Column Switcher. . . . . . . . . . . . . . . . . . . . . . . . . . . . . . . . . . . . . . . . . . . . . . . . . . . . . . . . . . . . . . . . .7
Graph Preferences . . . . . . . . . . . . . . . . . . . . . . . . . . . . . . . . . . . . . . . . . . . . . . . . . . . . . . . . . . . . . . . .7
Menu Preferences. . . . . . . . . . . . . . . . . . . . . . . . . . . . . . . . . . . . . . . . . . . . . . . . . . . . . . . . . . . . . . . . .7
Local Data Filter . . . . . . . . . . . . . . . . . . . . . . . . . . . . . . . . . . . . . . . . . . . . . . . . . . . . . . . . . . . . . . . . .7
Replacing Graph Variables. . . . . . . . . . . . . . . . . . . . . . . . . . . . . . . . . . . . . . . . . . . . . . . . . . . . . . . . . .7
SAS Support. . . . . . . . . . . . . . . . . . . . . . . . . . . . . . . . . . . . . . . . . . . . . . . . . . . . . . . . . . . . . . . . . . . . .8 Modeling and Multivariate Methods . . . . . . . . . . . . . . . . . . . . . . . . . . . . . . . . . . . . . . . . . . . . . . . . . . . . .8 Model Comparison . . . . . . . . . . . . . . . . . . . . . . . . . . . . . . . . . . . . . . . . . . . . . . . . . . . . . . . . . . . . . . .8
Nonlinear. . . . . . . . . . . . . . . . . . . . . . . . . . . . . . . . . . . . . . . . . . . . . . . . . . . . . . . . . . . . . . . . . . . . . . .8
Partial Least Squares. . . . . . . . . . . . . . . . . . . . . . . . . . . . . . . . . . . . . . . . . . . . . . . . . . . . . . . . . . . . . . .9
Partition. . . . . . . . . . . . . . . . . . . . . . . . . . . . . . . . . . . . . . . . . . . . . . . . . . . . . . . . . . . . . . . . . . . . . . . .9 Quality and Reliability Methods . . . . . . . . . . . . . . . . . . . . . . . . . . . . . . . . . . . . . . . . . . . . . . . . . . . . . . . .9 Control Chart Builder . . . . . . . . . . . . . . . . . . . . . . . . . . . . . . . . . . . . . . . . . . . . . . . . . . . . . . . . . . . . .9
Measurement Systems Analysis. . . . . . . . . . . . . . . . . . . . . . . . . . . . . . . . . . . . . . . . . . . . . . . . . . . . . . .9
Reliability Forecast. . . . . . . . . . . . . . . . . . . . . . . . . . . . . . . . . . . . . . . . . . . . . . . . . . . . . . . . . . . . . . . 10
Reliability Growth . . . . . . . . . . . . . . . . . . . . . . . . . . . . . . . . . . . . . . . . . . . . . . . . . . . . . . . . . . . . . . . 10 Scripting . . . . . . . . . . . . . . . . . . . . . . . . . . . . . . . . . . . . . . . . . . . . . . . . . . . . . . . . . . . . . . . . . . . . . . . . . 10 Add-In Builder. . . . . . . . . . . . . . . . . . . . . . . . . . . . . . . . . . . . . . . . . . . . . . . . . . . . . . . . . . . . . . . . . . 10
Highlights in JMP 103 DRAFT 10.0
Application Builder . . . . . . . . . . . . . . . . . . . . . . . . . . . . . . . . . . . . . . . . . . . . . . . . . . . . . . . . . . . . . . 10
Enhanced Graphics Scripting. . . . . . . . . . . . . . . . . . . . . . . . . . . . . . . . . . . . . . . . . . . . . . . . . . . . . . . 10
JSL Debugger. . . . . . . . . . . . . . . . . . . . . . . . . . . . . . . . . . . . . . . . . . . . . . . . . . . . . . . . . . . . . . . . . . . .11
Script Editor . . . . . . . . . . . . . . . . . . . . . . . . . . . . . . . . . . . . . . . . . . . . . . . . . . . . . . . . . . . . . . . . . . . .11
Scripting Index. . . . . . . . . . . . . . . . . . . . . . . . . . . . . . . . . . . . . . . . . . . . . . . . . . . . . . . . . . . . . . . . . . .11
4Highlights in JMP 10
Basic Analysis and Graphing DRAFT 10.0 Basic Analysis and Graphing
This section describes new features and enhancements in the basic analysis and graphing areas.
Bubble Plot
The Bubble Plot platform contains the following new options within the red triangle menu:
Set Shape changes the shape of the bubble. Choices include Circle (default), Triangle, Square, Diamond, Arrow, or Custom. Custom shapes are created using JSL. If no custom shape is defined, the
Custom option defaults to the circle shape.
Orient Shapes orients shapes as they move in particular directions over time, following the shape of the data. This option appears only if you have specified a Time variable.
Color Theme changes the colors representing the high, middle, and low values of the color variable. This option appears only if you have specified a Coloring variable.
Draw the Filled option now resides within this menu, and two new options appear: Outlined and Filled and Outlined.
Lock Scales Prevents axis scales and gradient legend scales from automatically adjusting in response to data or filtering changes.
Color as Sum Within Aggregation Options, a new option appears: Color as Sum. This option computes the mean of the data values and maps to a color. This option appears only for continuous
variables.
The Bubble Plot platform also contains the following enhancements:
?If you Split bubbles and then select Script > Redo Analysis, the state of split bubbles is preserved.
?If you have excluded rows in your data table, it will no longer contribute to the computation or to the display of the bubble plot, including axes, bubble sizes, and time states.
?If you have hidden rows in your data table, they will be used in the computation, but will not be shown in the bubble plot. All rows associated with a bubble must be hidden in order for the bubble to
disappear.
When exporting a bubble plot to an Adobe Flash file (.swf), note the following enhancements:
?Background maps are retained.
?You can split or combine bubbles.
Graph Builder
?Instead of right-clicking on a graph and selecting a new element or changing element properties, you can do so directly from the Graph Builder window. The Graph Builder window now contains icons that
change the element. Properties for most element types also appear.
?The following new elements are supported in Graph Builder:
Highlights in JMP 105 DRAFT 10.0Data T ables –Regression line, or line of fit
–Density ellipse
–Violin plot (appears in place of a Contour plot when there is only 1 continuous variable)
–Pie chart
–Shaded area
–T reemap
–Heatmap
–Caption box
–Function
?You can nest categorical X variables, resulting in nested X axes.
Data Tables
This section describes new features and enhancements to data tables.
Compare Data Tables
The Compare Data Tables platform enables you to compare two data tables. You can compare differences in the data, table variables and scripts, and column attributes and properties.
To launch the Compare Data Tables platform, select Tables > Compare Data Tables.
Embedded Data Filter in Tabulate
To open the embedded Data Filter in Tabulate, select Show Data Filter from the red triangle menu next to Tabulate.
Why did we do this? What benefit is this to users?
Multilingual Sample Data Tables
For any translated sample data tables, instead of providing three sets of sample data tables for English,
Japanese, and Chinese, we now have one set of sample data. The data table names are in English. When you open a translated sample data table, your locale settings are detected and the content in the data table
appears in the appropriate language (English, Japanese, or Chinese).
Inverted Selection in Filtered Data
In filtered data, you can select excluded columns using the Invert Selection message. For example, if males between the ages of 12 and 14 are filtered, select males of other ages:
df << (Filter Column (:age) << Invert Selection;
6Highlights in JMP 10
Design of Experiments DRAFT 10.0 Filter Hierarchical Data
Data that consists of subcategories within categories is considered hierarchical data. For example,
geographical regions might contain states. The Data Filter Hierarchical red triangle option lets you filter
data so that the second filtered list shows only subcategories of the first filtered list.
Design of Experiments
This section describes new features and enhancements in the design of experiments area.
Custom Design
The Custom Design platform has the following new features:
?Factors can now be of Discrete Numeric type. This is a numeric variable that can take only a discrete number of values. Discrete Numeric factors have an implied order for their levels.
?The Number of Center Points and Number of Replicates options are now specified before the clicking the Make Design button. This is done so the optimization routine can return a design that
accounts for the center points and replicates. The Number of Replicates option no longer replicates the
entire design, but specifies how many replicate runs to add to the design. The optimization routine
decides which design points to replicate.
?The Custom Designer now supports I-optimal split-plot designs. When creating response surface designs using an optimal design approach, the I-optimality criterion can be more appropriate than the
D-optimality criterion. You can use I-optimal split-plot designs to address response surface experiments
with restricted randomization.
To create an I-optimal split-plot design, select DOE > Custom Design. From the red triangle menu,
select Optimality Criterion > Make I-Optimal Design.
Evaluate a Design
Use the Evaluate Design command to evaluate designs for any table treated as a design. From the results, you can change the model terms and the aliasing terms and the diagnostics update accordingly. To evaluate
a design, select DOE > Evaluate Design.
General Enhancements
General enhancements include changes that affect multiple platforms or areas.
Highlights in JMP 107 DRAFT 10.0General Enhancements Bootstrapping
Bootstrapping approximates the sampling distribution of a statistic. The data is resampled (with
replacement) and the statistic is computed. This process is repeated to produce a distribution for the
statistic. To access the bootstrapping option, right-click on a statistic in a report and select Bootstrap.
Note: Bootstrapping is available in many platforms, but is available only in JMP Pro.
Column Switcher
Within a report, use the Column Switcher to change an existing variable to another variable. To activate the Column Switcher, from a report window, click on the red triangle menu. Select Script > Column Switcher. Graph Preferences
There is a new panel called Graphs in the Preferences window. The Graphs panel includes the following:?preferences for graphs that existed previously in the Reports panel
?new options pertaining to areas such as borders, framing, tick marks, and grid lines
? a preview area where you can see your changes before applying them
To see Graph preferences, select File > Preferences > Graphs.
Menu Preferences
The Menu preferences show and hide menus based on how you use JMP. This gives you fewer menu items to browse through and streamlines the JMP interface. For example, if you never design experiments, deselect Design of Experiments. Other menus are grouped by area of interest, such as quality engineering,
reliability and survival, and SAS options.
Local Data Filter
The Data Filter normally modifies the row states in a data table. If you do not want to modify the row states in your data table, use the Local Data Filter option. This option embeds the Data Filter within a report
window and does not affect or alter the associated data table or other associated reports.
To access this option, from a report window, click on the red triangle menu. Select Script > Local Data
Filter.
Replacing Graph Variables
To replace variables in a graph, you can drag and drop a variable. For example, in the Bivariate report, you can swap variables by dragging and dropping a variable from one axis to the other axis. Or, you can click on
a variable in the Columns panel of the data table and drag it onto an axis.
8Highlights in JMP 10
Modeling and Multivariate Methods DRAFT 10.0 The following platforms support dragging and dropping a variable from an axis or from a data table into a graph:
?Fit Y by X: Bivariate, Contingency
?Graph: Contour Plot, Scatterplot Matrix
?Quality and Process: Measurement Systems Analysis, Variability
The following platforms support dragging and dropping a variable from a data table into a graph:
?Distribution
?Fit Y by X: Logistic, Oneway
In the Distribution platform, when you drag a variable from the data table, drop it into the axis to replace the existing variable. To insert a new variable and create a new histogram, drag and drop the variable outside of an existing histogram. The new variable can be placed before, between, or after the existing histograms.
Note: In the Distribution platform, remove a variable by selecting Remove in the red triangle menu. SAS Support
JMP 10 fully supports SAS 9.3, including the ability to specify the default SAS mid-tier (or environment), metadata server, or workspace server in the JMP preferences.
When browsing data on a SAS server, you can select Get Details to see a data set’s size and the last
modification date for all data sets in the library.
Modeling and Multivariate Methods
This section describes new features and enhancements in the modeling and multivariate methods area. Model Comparison
The Model Comparison platform is used to compare the fit of different models. Measures of fit, diagnostic plots, and profilers are reported for easy comparison of models. You can combine the models through model averaging to achieve better predictive ability. The platform accepts models for both continuous and
categorical responses.
To launch the Model Comparison platform, select Analyze > Modeling > Model Comparison.
Note: The Model Comparison platform is available only in JMP Pro.
Nonlinear
The Fit Curve platform is a new personality of the Nonlinear platform. The Fit Curve platform provides tools for fitting a suite of nonlinear models without having to specify prediction formulas or starting values.
Highlights in JMP 109 DRAFT 10.0Quality and Reliability Methods After fitting one or more models, you can compare parameter estimates, test for parallelism, and compare different fits. The Fit Curve platform features a variety of different built-in models, including several that are popular for bioassay and pharmacokinetic data analysis.
To launch the Fit Curve platform, select Analyze > Modeling > Nonlinear. Provide a column of numeric data (with no predictor formula) in the X, Predictor Formula role.
Partial Least Squares
?The Partial Least Squares platform now uses validation to assess model fit and determine the number of latent factors. Cross validation methods include Holdback and KFold. To access the Partial Least
Squares platform, select Analyze > Multivariate Methods > Partial Least Squares.
?The Fit Model platform contains a new PLS personality. The PLS personality can fit models using categorical input variables and can include transformations on continuous variables. Models can also
include interaction and polynomial terms. To access the PLS personality in Fit Model, select Analyze >
Fit Model then select PLS from the Personality menu.
Note: The PLS personality in Fit Model is available only in JMP Pro.
Partition
The Show Split Count red triangle option shows or hides each frequency level for all nodes in the tree. This is for categorical responses only.
Quality and Reliability Methods
This section describes new features and enhancements in the quality and reliability methods area. Control Chart Builder
The Control Chart Builder is a new platform for interactively creating control charts. The interface features
a drag-and-drop workspace. You can quickly add or remove variables from the chart, use multiple Ys, add
phase variables, or change chart types. This allows for easy exploration of data. The platform creates X-Bar, IR, Range, Standard Deviation charts, and Moving Range charts.
To launch Control Chart Builder, select Analyze > Quality and Process > Control Chart Builder. Measurement Systems Analysis
The Measurement Systems Analysis platform provides methods for assessing the variation in your
measurement system and gauges. You can study parallelism, bias, compute variance components, and study the increment resolution of your system.
10Highlights in JMP 10
Scripting DRAFT 10.0 To launch the Measurement Systems Analysis platform, select Analyze > Quality and Process >
Measurement Systems Analysis.
Reliability Forecast
The Reliability Forecast platform uses historical product failure data to forecast warranty returns and repair costs. You can interactively investigate different combinations of warranty length and production volumes to see the impact on forecasted repairs.
To launch the Reliability Forecast platform, select Analyze > Reliability and Survival > Reliability
Forecast.
Reliability Growth
The Reliability Growth platform performs Crow-AMSAA analysis of a repairable system. This platform is useful for analyzing the mean time between failures (MTBF) and cumulative failure counts for a system
with multiple stages, where a single model is not adequate to describe the entire time line.
To launch the Reliability Growth platform, select Analyze > Reliability and Survival > Reliability Growth. Scripting
This section describes new features and enhancements in the scripting area.
Add-In Builder
The Add-In builder simplifies creating a JMP add-in. Rather than creating add-ins manually, you select File > New > Add-In and begin specifying the add-in name, menu item name, JSL script, and other options. Application Builder
The Application Builder is a drag-and-drop interface that lets you visually design new JMP windows with buttons, lists, graphs, and other objects. This saves you the step of writing scripts to create these objects.
JMP then guides you through writing scripts that provide functionality to the objects.
For example, you often perform the same tasks everyday (such as running Distribution and Fit Model
analyses on a data table and viewing the results). In the Application Builder, you can create an application that shows the results for both analyses in one window rather than in separate platform windows.
Create a new application by selecting File > New > Application.
Enhanced Graphics Scripting
Many features of graphs that are generated by JMP are available in graphs generated by JSL (for example, clickable markers, curves, smooth line styles, and density gradient fills).
Highlights in JMP 1011 DRAFT 10.0Scripting
JSL Debugger
The JSL Debugger helps identify the point at which a script causes an error or fails. Rather than
commenting portions of the script or adding Print() statements, you can use the debugger to find the
problem.
A variety of debugging methods are available: setting breakpoints, creating watches, stepping through
statements, and other typical debugging options.
To open the JSL Debugger within a script, click the Debug Script button, or right-click and select Debug Script.
Script Editor
The Script Editor features drag-and-drop editing, and more syntax coloring for SAS code. And you can now see the script and log in the same window. To access the split window, right-click in the script and select
Show Embedded Log.
Scripting Index
The JSL Functions Index, DisplayBox Scripting Index, and Object Scripting Index are now in one
searchable index. Search for functions, objects, display boxes, or search all categories. You can customize
your query to limit the search to examples, titles, and the like. Regular expressions are also supported in
queries.
Open the Scripting Index by selecting Help > Scripting Index.
?
大学英语四级复习资料·整理版
实用文档 文案大全 大学英语四级 复习资料 Mr.Cp
滴水渐累成沧海,拳石频移成泰山祝大家顺利过级 目录 第一部分.听力部分 (2) 第二部分.最新英语四级高频词汇 (23) 第三部分.四级阅读笔记 (31) 第四部分.完形填空做题技巧 (36) 第五部分.翻译经典练习 (38) . 第六部分.写作七类精彩句型 (40) 第七部分.写作必备模板和句型 (42) 第八部分.综合技能训练 (45) 第九部分.作文训练 (73) 第十部分.英语谚语警句 (85) 资料说明:本复习资料非教材用书。复习资料主要收集了四级听力、阅读、词汇、作文等一些英语四级相关的技巧、方法和内容,主要提供给有需要考四级的同学自己复习所用。 1
滴水渐累成沧海,拳石频移成泰山祝大家顺利过级 第一部分.听力部分 一、听力内容 1.Section A 对话 短对话 (5分02秒) 8个对话: 4分12秒 长对话 (5分58秒) Conversation 1 (4 questions):对话内容(1分45秒)+问题(1分25秒)Conversation 2 (3 questions):对话内容(1分45秒)+问题(1分02秒) 2.Section B 短文(10分05秒) Directions: 35秒 Passage 1 (3 questions):文章内容(1分25秒)+问题(1分10秒) Passage 2 (3 questions):文章内容(2分25秒)+问题(1分10秒) Passage 3 (4 questions):文章内容(1分45秒)+问题(1分55秒) 3.Section C 复合式听写 (11分20秒) Directions: 45秒 第一遍: 2分10秒 第二遍:第一句停顿:1分05秒 第二句停顿:1分35秒 第三句停顿:1分15秒 第三遍:2分10秒 (以上时间根据文章内容会有所变化) 二、听力技巧 四级听力一直困扰着我们每一位考生,听不懂磁带中的内容是什么,不知道该如何选择,而听力在英语四级考试中又占很大一部分比重,掌握好英语四级听力技巧才能快速提高英语成绩,以下总结出几点有关英语四级听力技巧。 听力技巧一:学会取舍,理解内容 听力考试中最忌讳的就是词词计较,力求听懂所有词。其实,听懂所有词首先没必要,其次也不可能。我们在日常生活中听中文时,无论听什么,注意力都不会在每一个字或词上面,而是对文段或对话内容的整体的理解上。何况我们听的是英文,在英文句子中,对不同的词本身就有弱读和重读。 听力技巧二:扫视材料,预测内容 当广播中朗读听力要求时,我们要充分利用这个时间,迅速扫视书面文字中的题干及选项,通过扫视联系上下文,有根据地预测文段发生的时间、场所、人物,并预测出谈话的大致内容。并且,在扫视中我们对提出的问题尤其要注意。这样做的结果是听录音时我们可以有的放矢,做到有备而来,心中有数。 听力技巧三:注重首句,抓住主旨 在听长文段时,由于信息多,而且听力不同于阅读,朗读速度非常快,需要我们快速做出反应,所以在听的时候就更应当注意主旨大意。在阅读中我们知道作者一般会在首句或首 2
平面设计常用尺寸对照
常用尺寸对照 1米=100厘米(公分)=1000毫米 1厘米(公分)=10毫米 名片标准尺寸: 90*55mm IC卡 90/85x54MM 三折页广告标准尺寸: (A4)210 x 285mm 普通宣传册标准尺寸: A1(对开)--840mmX570mm, A2(四开)--570mmX420mm A3(八开)--420mmX285mm, A4(十六开)--285mmX210mm 招贴画标准尺寸:540 x 380mm 挂旗标准尺寸:8开 376 x 265mm 4开 540 x 380mm 手提袋标准尺寸:400 x 285mm x 80mm 信纸便条标准尺寸:185 x 260mm 210 x 285mm 因下面都是大尺寸即用厘米表示 X 展架标准尺寸:180 x80cm 160x60cm 120x200cm(少用) 展板标准尺寸:120x240cm /60x80cm /120x120cm /90x120cm 吊旗标准尺寸:14×21(cm)、20×30(cm)、30×45(cm) 文字排版的要求 1、对齐方式-两端对齐 2、特殊格式也是常用的格式-首行缩进(2字符)即每段开头空两个字的位置。 3、行距自行调节 细节方面的格式修改 1、特殊文字格式(加粗、倾斜、下划线、删除线、上下标、边框底纹等) 2、首字下沉/变大(多用于杂志或是书本排版本) 3、项目符号和编号等
最基本的快捷键组合 RGB颜色模式最佳显示颜色模式。 CMYK模式CMYK颜色模式是一种印刷模式。其中四个字母分别指青(C)、洋红(M)、黄(Y)、黑(B),在印刷中代表四种颜色的油墨。CMYK模式在本质上与RGB模式没有什么区别,只是产生色彩的原理不同,在RGB模式中由光源发出的色光混合生成颜色,而在CMYK模式中由光线照到有不同比例C、M、Y、K油墨的纸上,部分光谱被吸收后,反射到人眼的光产生颜色。
展会常见材料
材料与工程教案 第一章绪论 主要内容: 1、简述什么是会展以及展台设计和搭建的特点。 2、会展展台的剖析。 3、会展工程材料的种类。 绪论章节的讲解重在引出会展工程材料在工程中的应用和材料的特性,课时安排2学时。 4、本课程的学习要求。 目的:
方法: 课堂构成: 作业要求: 一、什么是会展以及展台设计和搭建的特点 1、什么是会展? 市长说:会展是一项提升城市两个文明建设、利国利民的德政工程。学者说:会展是智者的峰会,是传播新思想、新观念的论坛。 模特说:会展梳妆台,企业争先来,靓女靠打扮,产品靠会展。 预言家说:会展是充满活力、前途无量的朝阳产业。 哲学家说:会展是企业经营理念的展示,是步入市场经济后理性成熟的表现。 建筑家说:会展场馆规模宏大、气派,是城市标志性建筑。 数学家说:会展的布展是排列与组合、平面与立体、黄金分割与数模运筹的应用。 美术家说:会展是生活中又一道五彩斑斓、丰富亮丽的色彩。 IT总裁说:会展是各种信息交流、碰撞、传递与嬗变的信息加工器。组展商说:会展是特殊的服务行业,核心本质是服务。“好儿郎最会伺候人”。
搭建商说:会展是“奢华”,一掷千金三、五天,是最短命的装饰工程。参展商说:会展是最经济、最实惠、最有效的立体营销广告。 老百姓说:会展是购买物美价廉、货真价实物品的好去处。 展览公司说:会展“展示别人即展示自己”。 气象学家说:会展是经济发展、产品走势的风向标、晴雨表。 环保专家说:会展是“不冒烟的工厂”,是无污染的绿色产业。 化学专家说:会展过热,市场化合反应后,一部分生成的是“泡沫”。经济学家说:会展是经济发展的又一个新的增长点。 展台设计者说:会展是受参展商资金与观念限制的艺术创作。 软件小摊贩说:会展是视窗,打开之后,不乏也有各类盗版存在。 投机招展商说:展不在好,能办则赢;展不在精,能捞则灵。 武侠小说爱好者说:会展人像“葵花宝典”,有些最终成了碎片,随风而散。 会展业是会议业和展览业的总称。会展业是全球经济一体化的大趋势下发展起来的新兴行业。 2、会展的类型 会议、展览、节事、奖励旅游 (1)会议
大学英语四级基础复习讲义.pdf
plete 指完成一件指派或预定的任务,或完 善、完整未完成的部分 gain 指需要做出比 obtain 更大的努力,往往指通过竞争获得某些有价值的东西obtain 指经过努力或付出代价或经过很长时间儿得到所需要的东西end 指一个动作或一件事情的结束或终止 finish 指把一件事或一个动作做完,强调 事情的了结、终止 7、4 、 accurate , correct , delicate , exact,precise 都含有一定的"正确,精确" 之意 acknowledge,admit,concede,confess,rec ognize 都含有一定的"承认"之意acknowledge 着重”公开承认”,常用来指过去曾隐瞒或否认的事accurate 准确的,精确的,指某人或某事 不仅不出错,而且与事实无出入,强调准 确性 admit 是指在压力下不得不承认已经证实或难以否认的事实,招供(事实,错误等)concede(不情愿地)承认,(在结果确定前)承认失败correct 正确的,指某人或某事合乎事实或 公认的标准或规则,没有错误 delicate 精美、精细的、雅致的 exact 确切的、精确的,语气较 accurate 强, 指某人或某事数量或质量完全符合事实或 标准,而且在细致末节上也丝毫不差 precise 精密的,指具有高度的精确性和准 确性,强调范围界限的鲜明性或细节的精密, 有时略带"吹毛求疵"的贬义 confess 着重承认自己的过错或罪恶recognize 指正式承认主权、权利等8、affirm,assert,allege,claim 都含有一定的"宣称,断言"之意affirm 断言,肯定,指根据事实坚定不移地宣称,有无可争辩之意assert 宣称,坚持,指不管事实如何,主观自信地宣称5、accuse,charge,indict 都含有一定的 "指控,控告"之意 allege 宣称,断定,指在无真实根据情况下宣称,硬说accuseaccusesb.ofdoingsth. 为 … 指 责 某 人,控告某人 claim 声称,主张,往往表示说话者反对或不同意某一观点chargechargesb.withdoingsth. 指 控 某 人… 英语四级温习资料 2(2006-12-1116:02:10)分类:大学英语四六级温习资料征服大学英语四级考试(阅读篇)(一)存在问题6、achieve,acquire,attain,gain,obtain 都含有一定的"获得,达到"之意 achieve 强调由于极大的努力,克服困难后 达到目标 第一,读不懂acquire 指经过不懈努力才获得的技术,知 识等抽象的东西,也指养成习惯等 attain 正式用语,指经过艰苦努力才使人达 到完美境地所谓读不懂,就是考生拿过文章,满头雾水,即使硬着头皮读文章,也是一知半解。然后匆忙做体,仅凭感觉去蒙,因此做体准确率必然不高。
产品结构设计概述
产品结构设计概述 第1版 目录 1. 设计流程 (2) 2. 设计方案 (3) 2.1. 建模 (3) 2.1.1. 建立文件夹 (3) 2.1.2. 选择基础文件路径 (4) 2.1.3. 选择新建模型路径 (5) 2.1.4. 编辑 (6) 2.1.5. 建立模型 (7) 2.2. 调整外形及尺寸 (7) 2.3. 分析计算 (7) 2.4. 写设计方案 (7) 3. 详细设计 (8) 3.1. 调整模型 (8) 3.2. 更新模型属性 (8) 3.2.1. 导入模型 (9) 3.2.2. 删除模型 (9) 3.2.3. 导入模型属性&导入属性列表 (9) 3.2.4. 更新模型属性 (10) 4. 工程图 (11) 4.1. 调整工程图 (11) 4.2. 工程图转换 (11) 4.2.1. 导入DXF格式图纸 (11) 4.2.2. 转为dwg格式图纸 (12) 5. 明细表 (13) 5.1. 选择整件图纸 (13) 5.2. 导入整件明细 (13) 5.3. 导入部件明细 (14) 5.4. 保存明细表 (14) 6. 批量打印 (16) 7. 发图 (17) 7.1. 设置发图单位 (17) 7.2. 导入图纸名称 (17) 7.3. 生成发图登记表 (18) 7.4. 发放表排序 (18) 根据公司实际应用情况开发设计, 不适用于外部环境
产品设计流程及方法 东方科技·结构室 2014-7-9 产品是一个企业的核心之一,产品质量关系到企业的持久发展。“低成本、周期短、高质量”是企业对产品的要求。三者之间存在相互的关联,在出厂前,成本主要包括设计成本、采购成本、制造成本及装配成本。其中,采购成本在短周期内是比较固定的,随着量的增加会呈逐步减少的趋势。制造、装配成本与设计相关,设计不同会产生成本的差异。周期也主要包括设计周期、采购周期、制造及装配周期,随着ERP系统的上线,对采购周期的缩短提供了有利条件,制造、装配周期也与设计相关。质量包括产品的可靠性、准确性,可靠性由设计者决定,准确性由制造装配者决定。对于新产品或者白图,设计与成本、周期、质量都相关,设计周期短会降低设计成本,会有更多时间关注产品质量。所以,设计是产品的核心。 我们做任何事情都有一定的方法及次序,把这种方法总结出来便成为流程。不同的流程对事情的处理速度千差万别,因此需要有一种统一的流程,大家都按这种流程工作,会产生最大的效益。 在实际工作中,技术含量较高的工作包括:系统结构布局,性能分析(散热分析、结构强度分析、模态分析、电磁分析等),模型设计优化,工程图及要求。重复性较多的工作包括:建立模型(修改名称、模型替换等),修改模型属性,工程图转换,生成明细表,图纸打印,图纸发放表。两者合起来,就组成了产品的设计流程。 重复性的工作占整个设计流程的一半以上,并且给设计者带来沉重的负担,增加了设计周期及成本。很多软件都考虑到了这一点,所以都设置了跟VB的接口程序,来满足企业对软件二次开发的要求,称为VBA(Visual Basic for Applications)。通过VBA开发的程序,设计者可以实现上述工作的自动化。因此,实现了工作 中使用软件的自动化后,工作效率将得到大幅提高,工作强度将得到很大降低。 下面在设计流程的基础上,讲解VBA程序的使用方法,设计者需要在学习VBA程序的同时,了解设计流程。
大学英语四级考试资料很详细
英语四级复习大全 第一章听力理解 第一节听力题型改革概述 听力比例由原来的20%提升到35%:短对话部分由原来的10题减至8题;增加两篇长对话,题量在3至4题每篇,一共7题;短文(俗称“段子题”)仍为3篇,题量在3至4题每篇,一共10题;复合式听写保持不变。以上4个听力部分中,短对话和长对话的分值一共占15%,而短文和复合式听写的分值一共占20%。听力题材涉及的范围更加广泛,形式灵活多样,包括对话、讲座、广播电视节目等等。 第二节听力题型概述及应试策略 一、关于对话题 (一) 长短对话听力题改革与分析 1. 听力短对话部分虽然由原先的10题改为8题,但就其题目特点与解题思路而言与以往的老题型没有太大的差异。这些题目一如既往地贯彻了以往的几大常见考点: ·转折引起的作者态度及谈论重点的变化; ·对现象原因的阐述与补充; ·反问句式、反意疑问句式的考察:反问和反意疑问在四级考试中永远以一种无疑而问的形式出现,这次依然用了这样的一个形式。因此,只要能很好把握其“无疑而问”的特点,就能方便解题。当然也应该注意到,反问句往往作为加强语气的建议句型出现的这一考点。 ·建议句型的考察:建议句型往往是比较复杂的考点之一,因为句型相对比较多,而且隐蔽性比较强。 ·场景、人物关系的推测; ·语音语调的考察。 综上所述,试点考试将依然遵循以往的考试规律和特点,一脉相承。但所谓的短对话却也越来越长,这也体现了现在考试在句型句式、言外之意和内容复杂化三个方面的发展趋势。 2. 听力长对话并不可怕,它结合了短对话对问答句式,建议请求,和关键场景赐予的考察和长段子对文章层次和理解能力的要求。所以做这样的题目往往需要具备综合的素质,既要注意其中的细节,又要注意整体的把握,还要能够应付7道题目的题量,这比以往的四级题目对综合能力的要求显著提高了。 (二) 长短对话听力技巧 应注意以下几点: 1. 提前阅读选项,判断问题所属,从而集中精力于有关信息。 2. 注意根据信息词汇判断地点和说话人的身份职业等。 当同学们看到四个地点和职业名词时,大脑中就应该马上出现与这些地点或职业相关的一系列词语,在听的过程中注意提到了什么信息词语,这样就可轻松地判断谈话发生的地点,说话人的职业或身份,以及谈话双方的关系。 为此,同学们有必要了解与各种职业和地点行业有关的信息词汇,如: 饭店:menu, order, waitress, waiter, take order, go Dutch, It's my treat等;
平面设计常用的尺寸总结
平面设计常用设计尺寸及三折页 ●宣传彩页(三折页) 成品尺寸:210×95mm 展开尺寸:210×285mm 工艺:157g铜版纸,4C+4C印刷,切成品、折页。 ●宣传彩页、单页(16开小海报) 成品尺寸:210×285mm 工艺:多采用157克铜版纸4C+4C印刷,(可印专色、专金、专银)切成品。 ●四开、对开宣传大海报 成品尺寸: 大四开:580×430mm 大对开:860×580mm 工艺:157克铜版纸,4C+0印刷,过光胶或哑胶,切成品,背贴双面胶。 ●宣传画册:画册是最直接有效展现企业和产品的综合性宣传资料。 成品尺寸:210×285mm 工艺:封面多为230克铜版或哑粉纸过哑胶或光胶。内页157或128克铜版纸或哑粉纸,4C+4C印刷,骑马钉。页数较多时可用锁线胶装。 ●封套:封套属画册的一种,好处是可针对不同客户灵活应用,避免浪费。 常规尺寸:220×300mm 工艺:多采用230-350克铜版纸或哑粉纸,也可以用特种工艺纸。4C+4C印刷,可以印专色、击凹凸、局部UV、过光胶或哑胶、烫铂、啤、粘等工艺。插页则为正规尺寸210×285mm ,其它工艺与彩页相同。 ●标书:封面多采用皮纹纸或特种工艺纸,或四色彩印后裱双灰板,内页157g或128g铜版或哑粉纸,也可用书写纸、数码彩印,锁线胶装。也可打孔装订。 ●电梯广告宣传画
成品尺寸:550×400mm 工艺制作:多采用高精度喷绘,以水晶玻璃8+5mm斜边、打孔,支架式装饰钉安装●广告喷绘——户内展板型:因较近距离观看,喷绘要求精度较高,材料多采用PP胶、或背胶等较细腻的材质,过雅胶,其成品可卷起携带方便,也可直接裱KT 板,镶边框。 ●广告喷绘——展架型:称为易拉宝,是一种小巧玲珑的艺术精品。收 缩自如,携带方便,移动灵活,很受欢迎。 ●广告喷绘——户外型:户外喷绘的规格大小不等,一般的广告招牌有 十几米,浑厚大气的户外喷绘多达几十米。多以灯箱布为主,分内打灯光(透明)和外打灯光(不透明)两种。其具有较强的抗老化耐高温、拉力、风吹雨淋等特点。 ●手提袋:手提袋是经济实用、美观大方的广告宣传礼品。可有效的宣传 企业和产品形象,属流动性广告,设计上应体现行业特征并具有时代潮流。 规格:可按内容物大小而定,材料一般采用230-300g白卡(单粉卡纸)或灰卡。 工艺:多采用4C+0印刷(或专色)、过光胶或哑胶,可烫铂、击凹凸、UV 等工艺。手提绳有多种色彩可供选择,通常选用以手提袋主色调相和谐的色彩。 产品名称: ●服饰吊卡、标签:多采用250-350g铜版或单粉卡纸,4C+4C或4C+0印 刷,可印专色和烫铂(金、银、宝石蓝等)、过光胶或哑胶、局部UV、凹凸、切或啤、打孔等工艺。 ●各式CD盒、CD袋:常用于应用软件、宣传性媒体光盘:书本式、盒式 CD套多采用250-300g铜版或哑粉纸,四色彩印、过胶或其它工艺;普通式CD 袋多采用书写纸,开窗、加PVC胶片和啤、粘等工艺。 ●多联单、票据:多采用无碳复写纸,有二联、三联、四联,纸的颜色有: 白、淡兰、淡绿、淡红、淡黄。纸张厚度一般为40g~60g。 规格:尺寸可根据实际需要自行设定。 印刷:多为单色,或双色。可打流水号。(从起始号至结尾号,可由客户自定)胶头或胶左。 ●不干胶、镭射防伪标: 常作为产品的标签,有纸类、金属膜类,镭射激光防伪标,刮奖卡,此系列品种较多,工艺亦不同,在设计时可根据需要选择不同材质和工艺。 印刷:分单色、四色,过光胶或哑胶。 ●刮刮卡: 刮刮卡则采用200-350g材质,印刷多为4+4C彩印、丝印、切、啤等工艺。
野外编录秘笈与比较全面的描述
第一章总则 1.野外描述岩土的目的是划分层次,确定名称,鉴别状态、成因类型、地质年代及工程地质特征,为评价岩土的工程性质取得原始资料。 2.描述人员必须本着实事求是认真负责的精神,及时、全面、准确地做好描述记录工作,如实地反映客观情况(记录完成后,不准随便更改)。 3.本描述标准包括下列各类岩土: (1)岩石(2)碎石土(3)砂土(4)粘性土(5)人工填土 对于湿陷性黄土,多年冻土、膨胀土及盐渍土等以及特殊要求地工程(如地下洞、边坡等)应遵照有关规定描述或按专业研究确定地描述内容进行。 4.为了消除对同一土层认识上的差异,各工区应由工程(技术)负责人召集有关人员根据本标准确定代表性样本。 5.在钻探中,土的描述工作应在土样取出钻孔后立即进行(风干土的描述除外)。 6.土的成因及时代在现场很难确定时,可根据区域已有资料和调查结果综合研究确定。 7.对土的描述应有明确的目的性,特别应注意那些能说明土的工程性质的特征。 8.对各类岩土描述颜色时,应将副色放在前,主色放在后。 第二章岩石 9.岩石:颗粒间牢固联结呈整体或具有节理裂隙的岩体是由多种矿物或一种矿物组成的(如石英岩即由石英组成),它的部分块体称岩石。 岩石按照成因可分为:岩浆岩(火成岩),沉积岩(水成或风成等)和变质岩三大类。 按照坚固性分为:硬质岩石和软质岩石,其代表性的岩石则见表1。 程度(或裂隙发育程度)及产状要素。 11.描述岩石成份时,一般情况下只描述主要矿物成份,如:“砂岩,主要成份为石英、长石”。 12.岩石的颜色,要分别描述其新鲜面和风化面的颜色。 13.岩浆岩:有岩浆冷却凝结而成的岩石; (1)其结构按照结晶程度可分为:全晶质、半晶质、玻璃质; 其结构按照组成岩石结晶颗粒的相对大小分为:等粒、斑状; 其结构按照组成岩石结晶颗粒的绝对大小分为:粗粒(粒径大于5mm)、中粒(粒径2~5mm)、细粒(粒径0.2~2mm)、微粒(粒径小于0.2mm)。 (2)主要构造有:块状、带状、流纹状、气孔状、杏仁状及流面线等
展览空间的设计方法及材料价格大全
专卖店空间设计与展示的运用与分析 服装专卖店空间的设计与展示的成功与否,不仅影响到品牌的现实利益,而且也关系到品牌的发展和延伸。另一方面,在设计与装璜上,不仅体现了品牌经营的特色,还不同程度上表达了品牌的风格、理念和人文概念。 服装空间设计与展示对品牌的影响: 1、服装空间设计中服装品牌定位、设计品位、以及延伸出来的流行特征都直接影响到空间形象,成功的空间设计应该做到能营造出品牌定位、设计品位和品牌背后演绎给消费者的生活概念和文化理念。 2、店堂的环境设计要完善并能体现品牌的风格,衬托出品牌主题,并能很好地进行融合,这直接影响到品牌经营的成败。 3、在空间设计中功能性的作用直接对空间的服务带来影响,合理的空间布局和结构设计将会对销售活动起来促进作用。 4、合理地选择装饰材料,运用施工工艺,不仅为设计构思的实现提供可行性,而且也将成为整个品牌形象的一个重要组成部分。装饰材料与工艺决定了空间形成的成败。 5、服装空间设计中经营理念和设计理念的结合直接影响到空间定位,准确的市场定位将会使品牌的投入实现市场的最大效益。 在具体展示操作方面,应体现以下几点原则: 1、货品展示整体统一。为达到展示效果,充分体现品牌设计理念,从整体的LOGO设计到店内模特、人台的手势摆放等细节,都要体现设计与展示主旨和意图。 2、货品摆放联系搭配。产品以系列相维系,货区展示中产品以系列形式安排展示,将会突出产品在设计结构安排上的优点。 3、货品结构设置实用与有效。为营造服饰展示效果气氛,对设计的装置结构应在实际操作中充分体现服装产品展示的辅助作用。 4、展示空间的营造合理、顺畅、引导性强。现在的营销观念更强调的是消费者的心理感受,他们购物需要充足的自由空间,自主选择,而增强引导性因素参与店内销售行为,更能隐性加强销售力度。 5、货品展示风格独特别致,特点突出。这不仅使品牌形象变得个性鲜明,还将丰富产品的外在形象,渲染品牌的感染力。
大学英语四六级复习资料总汇
[url=https://www.360docs.net/doc/6714534088.html,/readtopic.php?forumid=40&topicid=458010]最新四六级历年真题在线听力[并非幻觉][/url] [url=https://www.360docs.net/doc/6714534088.html,/readtopic.php?forumid=40&topicid=458000]======四级重要词汇分类记忆======[yinio][/url] [url=https://www.360docs.net/doc/6714534088.html,/readtopic.php?forumid=40&topicid=458005]===========四级阅读超精读===========[yinio][/url] [url=https://www.360docs.net/doc/6714534088.html,/readtopic.php?forumid=40&topicid=458008]======新东方四、六级写作背诵范文选======[yinio][/url] [url=https://www.360docs.net/doc/6714534088.html,/readtopic.php?forumid=40&topicid=453585]大学英语四、六级考试[应试篇]----请不要回帖!!![紫莜][/url] [url=[url=https://www.360docs.net/doc/6714534088.html,/readtopic.php?forumid=40&topicid=458017]************六级常考词频(新东方老师总结)**********[紫莜][/url] [url=https://www.360docs.net/doc/6714534088.html,/readtopic.php?forumid=40&topicid=458029]***********大学英语CET六级词汇总结***********[[紫莜][/url] [url= https://www.360docs.net/doc/6714534088.html,/readtopic.php?forumid=40&topicid=457061]上海交大预测作文卷[cxx8108][/url] [url=https://www.360docs.net/doc/6714534088.html,/readtopic.php?forumid=40&topicid=456044]大学英语140页[xjjxyjy] [/url] [url=https://www.360docs.net/doc/6714534088.html,/readtopic.php?forumid=40&topicid=430147]六级综合改错题应对策略[忘海悦人][/url] [url=https://www.360docs.net/doc/6714534088.html,/readtopic.php?forumid=40&topicid=438738] **************短期突破:王长喜六级资料[标准阅读60篇]***********[紫莜] [/url] [url=https://www.360docs.net/doc/6714534088.html,/readtopic.php?forumid=40&topicid=422000]CET-4常考、常用短语![短期突破][/url](紫莜) [url=https://www.360docs.net/doc/6714534088.html,/readtopic.php?forumid=40&topicid=421937]六级单词不用愁,尽在此帖中 [url=https://www.360docs.net/doc/6714534088.html,/readtopic.php?forumid=40&topicid=423163]【推荐】四级技巧集合[/url](叶随风) [url=https://www.360docs.net/doc/6714534088.html,/readtopic.php?forumid=40&topicid=421992]HOT~《大学英语四级语法精要》附:EBOOK下载
平面设计常用尺寸-纸张材质和印刷工艺
平面设计常用尺寸,纸张材质和印刷工艺 ●宣传彩页(三折页) 成品尺寸:210×95mm 展开尺寸:210×285mm 工艺:157g铜版纸,4C+4C印刷,切成品、折页。 ●宣传彩页、单页(16开小海报) 成品尺寸:210×285mm 工艺:多采用157克铜版纸4C+4C印刷,(可印专色、专金、专银)切成品。 ●四开、对开宣传大海报 成品尺寸: 大四开:580×430mm 大对开:860×580mm 工艺:157克铜版纸,4C+0印刷,过光胶或哑胶,切成品,背贴双面胶。 ●宣传画册:画册是最直接有效展现企业和产品的综合性宣传资料。 成品尺寸:210×285mm 工艺:封面多为230克铜版或哑粉纸过哑胶或光胶。内页157或128克铜版纸或哑粉纸,4C+4C印刷,骑马钉。页数较多时可用锁线胶装。 ●封套:封套属画册的一种,好处是可针对不同客户灵活应用,避免浪费。 常规尺寸:220×300mm 工艺:多采用230-350克铜版纸或哑粉纸,也可以用特种工艺纸。4C+4C印刷,可以印专色、击凹凸、局部UV、过光胶或哑胶、烫铂、啤、粘等工艺。插页则为正规尺寸210×285mm,其它工艺与彩页相同。 ●标书:封面多采用皮纹纸或特种工艺纸,或四色彩印后裱双灰板,内页157g或128g铜版或哑粉纸,也可用书写纸、数码彩印,锁线胶装。也可打孔装订。 ●电梯广告宣传画 成品尺寸:550×400mm 工艺制作:多采用高精度喷绘,以水晶玻璃8+5mm斜边、打孔,支架式装饰钉安装●广告喷绘——户内展板型:因较近距离观看,喷绘要求精度较高,材料多采用PP胶、或背胶等较细腻的材质,过雅胶,其成品可卷起携带方便,也可直接裱KT 板,镶边框。 ●广告喷绘——展架型:称为易拉宝,是一种小巧玲珑的艺术精品。收缩自如,携带方便,移动灵活,很受欢迎。 ●广告喷绘——户外型:户外喷绘的规格大小不等,一般的广告招牌有十几米,浑厚大气的户外喷绘多达几十米。多以灯箱布为主,分内打灯光(透明)和外打灯光(不透明)两种。其具有较强的抗老化耐高温、拉力、风吹雨淋等特点。 ●手提袋:手提袋是经济实用、美观大方的广告宣传礼品。可有效的宣传企业和产品形象,属流动性广告,设计上应体现行业特征并具有时代潮流。 规格:可按内容物大小而定,材料一般采用230-300g白卡(单粉卡纸)或灰卡。 工艺:多采用4C+0印刷(或专色)、过光胶或哑胶,可烫铂、击凹凸、UV等工艺。手提绳有多种色彩可供选择,通常选用以手提袋主色调相和谐的色彩。 产品名称: ●服饰吊卡、标签:多采用250-350g铜版或单粉卡纸,4C+4C或4C+0印刷,可印专色和烫铂(金、银、宝石蓝等)、过光胶或哑胶、局部UV、凹凸、切或啤、打孔等工艺。
野外编录
野外编录 一、杂填土:杂色,松散,大孔隙,上部为砼地坪,含较多的碎石。 二、淤泥质粉质粘土:灰色~灰黑色,流塑,部分夹有机质;无摇振反应,稍有光滑,干强度低,韧性低,有腐味 三、粘土:灰黄色,可塑,无摇振反应、光滑,干强度高,韧性高,局部分布。 四、粘土:灰黄~褐黄色,硬塑,含少量的铁,锰质结核,可塑,无摇振反应,光滑,干强度高,韧性高。 五、粉质粘土:青灰色,软~可塑状,为后期沉积,摇振反应无,稍有光滑,干强度中等,韧性中等。 六、粉质粘土:灰黄~褐黄色,硬塑,含青灰色粘土团块无摇振反应,稍有光滑,干强度中等,韧性中等。 七、粉质粘土:灰黄~褐黄色,可塑,无摇振反应,稍有光滑,干强度中等,韧性中等。 八、粉质粘土:灰黄色,可塑,稍有光滑,干强度中等,韧性中等。局部含团块状密实粉土。 九、粉质粘土:灰黄~褐黄色,钙质结核,硬塑,无摇振反应,稍有光滑,干强度中等,韧性中等。 十、粉质粘土:灰黄~灰色,软~可塑,粉粒含量高,无摇振反应,稍有光滑,干强中等,韧性中等。 十一、粉质粘土:上部浅灰色,中下部褐黄色,硬塑,含少量铁锰质结核,无摇振反应,切面光滑,干强度高,韧性高。 十二、粉质粘土夹粉土:灰黄~青灰色,可塑,含少量云母片,无摇振反应,稍有光滑,干强度中等,韧性中等。 十三、粉砂:黄色,含云母片,中密。主要由石英等矿物组成,饱和状态。 十四、粉砂:上部灰黄色,底部浅灰色,含云母片,饱和状态,密实。 十五、粉质粘土夹粉土:灰黄色,软~可塑,无摇振反应,稍有光滑,干强度中等,韧性中等。局部夹薄层粉土。 十六、粉土:灰黄,含云母片,很湿,稍密。摇振反应中等,无光泽反应,干强度低,韧性低。十七、粉砂:灰黄,含云母片,饱和,密实,主要成分由长石、石英、云母等组成,磨园度好、分、选性好。 十八、粉土:浅灰色,含云母片,摇振反应中等,无泽反应,干强度低,韧性低。 十九、粘土夹粉砂:灰黄色,褐黄色,可塑,含少量钙质结核核径为3cm。夹薄层壮中密粉砂,具水平层理,无摇振反应,切面稍光滑,干强度高,韧性高。 二十、粘土:灰黄,褐黄色,含少量铁,锰质结核,无摇振反应,切面光滑,干强度高,韧性高。二十一、粉质粘土:褐黄色,硬塑,含白色高龄土条带用钙质结核,(核径为0.3~2cm),无摇振反应,切面光滑,干强度高,韧性高。 二十二、粉质粘土夹粉土:浅灰色,可塑,粉粒含量高,无摇振反应,稍有光滑,干强度中等,韧性中等。局部夹30cm厚薄层粉土,湿,中密~密实。 二十三、碎石土:浅黄色,灰黄色,中密~密实,碎石含量50%~70%棱角形,次棱角形,一般直径20~40mm最大粒径120mm 成份以灰岩为主,少量为砂岩,由老黄土、新黄土,中粗砂,砾石充填。 二十四、 中风化灰岩:灰~深灰色,隐晶质结构中厚层状构造,岩石结构致密坚硬,裂隙发育大部分闭合,由方解石充填,岩芯多呈短柱状,长柱,少量呈碎石块状,碎粒状,土状,长度20~40cm局部溶蚀现像严重,岩芯表面呈峰窝状,溶径5~20mm,最大50mm. 二十五、全风化粘土岩:褐灰色,黄褐色,棕红色。结构构造完全破坏岩芯呈土状,含风化碎屑,
(四级填空)大学英语四级选词填空技巧汇总
选词填空技巧汇总 大学英语四级考试的阅读部分,除了传统的两篇仔细阅读和一篇快速阅读,还有一种让考生普遍头痛的考法:选词填空。 选词填空的考察形式是:一篇280词左右的文章,文章中挖出10个空,并统一给出A-O15个备选答案。 选词填空区别于完形填空,有更大的解题难度,原因在于: 1. 完形填空每题都是四选一,选词填空第一题要十五选一,就算用到排除法,最后一题也要六选一,而且在十五个选项中还有五个根本不会用到,难度加大; 2. 完形填空每题的四个选项都是统一的词性,只需要辨析词义、搭配就基本可以作答,而选词填空的十五个选项有多个词性,解题时需要同时判断词性和词义,难度加大; 3. 完形填空每题的四个选项往往都是统一时态,统一形式,而在选词填空中会涉及选项的动词时态、第三人称单数形式、被动主动语态,名词的单复数等的辨析,难度加大。 因此,针对选词填空的解题方法分为三步: 1. 预览选项,了解词义并把选项分为四大类词性:名词n,动词v,形容词a,副词ad,在每个选项后作词性的简要标记; 2. 精读全文开头,把握文章主题,并以三个空或一个段落为一个单位,利用前后文判断每空的词性; 3. 把对应词性的选项逐一带回原文,含义通顺,时态、主谓搭配一致的为正确选项。 四级考试的常用后缀在判断选项词性时可以有一定帮助作用: 常见名词后缀: -ability usability, capability -ibility visibility, responsibility, stability -age package, shortage, marriage -ance importance, allowance, reliance -ence presence, absence, confidence -ant assistant, accountant, inhabitant -ent president, resident, dependent
平面设计方案常用尺寸标准一览表
常用印刷品尺寸(单位:mm) 名片横版:90*55mm 85*54mm 竖版:50*90mm 54*85mm 方版:90*90mm 90*95mm IC卡85x54MM 三折页广告标尺: (A4)210mm x 285mm 普通宣传册标尺: (A4)210mm x 285mm 文件封套标尺:220mm x 305mm 招贴画标尺:540mm x 380mm 挂旗标尺:8开376mm x 265mm 4开540mm x 380mm 手提袋标尺:400mm x 285mm x 80mm 信纸标尺:185mm x 260mm 210mm x 285mm信封尺寸(国内信封标准) B6号176 X 125 与现行3号信封一致 DL号220 X 110 与现行5号信封一致 ZL号230 X 120 与现行6号信封一致 C5号229 X 162 与现行7号信封一致 C4号324 X 229 与现行9号信封一致 CD一般设计尺寸↓ 1、内页:123*126 2、底封:157*124 3、碟面:外圈_118、内圈_36或是25 常见纸张尺寸(单位:mm) 正度纸张:787×1092mm 大度纸张:850*1168mm 开数(正度) 尺寸单位(mm) 全开781×1086 全开844×1162 2开530×760 2开581×844 3开362×781 3开387×844 4开390×543 4开422×581 6开362×390 6开387×422 8开271×390 8开290×422 16开195×271 16开210×297 注:成品尺寸=纸张尺寸-修边尺寸 常见证件照对应尺寸 1英寸25mm×35mm 2英寸35mm×49mm 3英寸35mm×52mm 港澳通行证33mm×48mm 赴美签证50mm×50mm 日本签证45mm×45mm 大二寸35mm×45mm 护照33mm×48mm 毕业生照33mm×48mm 身份证22mm×32mm 驾照21mm×26mm 车照60mm×91mm 黑白小一寸(22mm*32mm) 彩色小一寸(27mm*38mm) 彩色大一寸(40mm*55mm) 普通证件照(33mm*48mm)照片规格 (英寸) (厘M)(像素) 数码相机类型 1寸 2.5*3.5cm 413*295 身份证大头照 3.3*2.2 390*260 2寸 3.5*5.3cm 626*413 小2寸(护照)4.8*3.3cm 567*390 5寸5x3.5 12.7*8.9 1200x840以上100万像素6寸6x4 15.2*10.2 1440x960以上130万像素7寸 7x5 17.8*12.7 1680x1200以上200万像素 8寸8x6 20.3*15.2 1920x1440以上300万像素10寸 10x8 25.4*20.3 2400x1920以上400万像素12寸 12x10 30.5*20.3 2500x2000以上 500万像素15寸 15x10 38.1*25.4 3000x2000 600万像素 1寸(是指英寸)=2.54cm常见开本尺寸(单位:mm) 开本尺寸:787 x 1092 开本尺寸(大度):850 x 1168 对开:736 x 520 对开:570 x 840 4开:520 x 368 4开:420 x 570 8开:368 x 260 8开:285 x 420 16开:260 x 184 16开:210 x 285 32开:184 x 130 32开:203 x 1401.纸的单位: A.克:一平方M的重量(长×宽÷2)=g为重量 B.令:500张纸单位称:令(出厂规格) C.吨:与平常单位一样1吨=1000公斤用于算纸价2.纸的规格及名称: A.纸最常见有四种规格: (1).正度纸:长109.2厘M.宽78.7厘M (2).大度纸:长119.4厘M.宽88.9厘M (3).不干胶:长765厘M.宽535厘M (4).无碳纸:有正度和大度的规格,但有上纸.中纸.下纸之分,纸价不同 B.纸张最常见的名称: (1).拷贝纸:17g正度规格:用于增值税票,礼品内包装,一般是纯白色。 (2).打字纸:28g正度规格:用于联单表格,有七种色分:白.红.黄.兰.绿.淡绿.紫色。 (3).有光纸:35-40g正度规格:一面有光,用于联单.表格.便笺,为低档印刷纸张。
产品结构设计等方面的checklist
模具的checklist表: 产品名称模具编号材料收缩率 序号内容自检确认 1与客户交流清楚外观面位置及外观要求如镜面,皮纹,亚光等。 2清楚产品的安装方向,产品的出模方向及它们之间的关系。 3产品在出模方向无不合理结构。 4壁厚合理,壁厚均匀,没有过薄,过厚及壁厚突变。 5圆角齐全,所有外观面倒圆角(特殊要求除外),所有非外观面倒圆角,非外观面圆角足够大。且圆角处壁厚均匀,无漏掉的圆角。 6脱模斜度齐全,正确,无放反的情况,脱模斜度足够大,已用DRAFTCHECK命令进行检查。7透明件,皮纹处理的外观面,插穿面脱模斜度足够大,满足标准。 8透明件已考虑外观效果,可见结构,并与客户进行交流。 9需贴膜的件已经考虑到膜在实际安装方向的定位, 10电镀件装配考虑到镀层厚度和装配间隙, 11一面用插接,一面用卡爪的结构已考虑到装配过程中是否有与外观干涉,是否有造成外观面破坏的情况,卡爪是否易断 12加强筋高度,宽度,脱模斜度结构及工艺均合理。 13外观件检查产品结构如壁厚,加强筋(尤其是横在制品侧壁的筋考虑与侧壁的防缩)、螺钉柱等不会引起缩水,已采取防缩措施。 14产品变形,收缩等注塑缺陷轻微,且已与客户协商,得到客户的书面认可。 15需出斜顶,滑块,抽芯的结构活动距离及空间足够,结构能否简化。 16产品无引起模具壁薄,尖角等不合理结构。 17带嵌件的产品考虑嵌件在模具中的牢固固定,内桶底的嵌件要求将嵌件和包嵌件的胶位合并到一起作为模具嵌件。 18与客户交流清楚分型面的位置,外观面滑块,抽芯允许的夹线位置。 19备份产品已检查所有修模报告及更改记录并进行了更改,重要装配尺寸进行了样件的实际测绘验证。 笔记本的CHECKLIST DesignCheckListBySub-Assy. 1.U-Case 1-1上下盖嵌合部份 1-1-1上下盖PL是否Match 1-1-2Lip是否完成,是否符合外观要求(修饰沟) 1-1-3侧壁之TAPER/与下盖是否配合/考虑到开模 1-1-4上下盖之配合卡勾共几处,是否位置match 1-1-5卡勾嵌合深度多少 1-1-6卡勾两侧有无夹持Rib,拆拔时是否易断裂 1-1-7卡勾是否造成侧壁缩水(如果太厚) 1-1-8公模内面形状(如各处高度). 1-1-10PL切口处是否有刀口产生(全周Check) 1-2BOSS 1-2-1上下盖BOSS孔位是否相合 1-2-2BOSS尺寸是否标准化,内缘有没有倒角
野外编录土的鉴别方法与描述
野外编录常用 一、杂填土: 杂色,松散,上部为砼地坪,含较多的碎石。 二、粉土: (1)灰黄,很湿,稍密,含云母片,摇振反应迅速,无光泽,干强度低,韧性低。 (2 )浅灰色,含云母片,摇振反应中等,无泽反应,干强度低,韧性低。三、粉砂: (1)黄色,饱和状态,中密,含云母片,主要由石英等矿物组成。 (2)上部灰黄色,底部浅灰色,含云母片,饱和状态,密实。 (3)灰黄,含云母片,饱和,密实,主要成分由长石、石英、云母等组成,磨园度好、分选性好。 四、淤泥质粉质粘土: 灰色~灰黑色,流塑,含有机质;无摇振反应,稍有光泽,干强度中,韧性中,有腐味 五、粉质粘土:青灰色,软塑状,无摇振反应,切面稍有光泽,干强度中等,韧性中等。 六、粉质粘土: 灰黄~褐黄色,可塑,无摇振反应,切面有光泽,干强度中等,韧性中等。 七、粉质粘土 (1):灰黄~褐黄色,硬塑,含青灰色粘土团块无摇振反应,切面有光泽,干强度高,韧性高。 (2)褐黄色,硬塑,含白色高龄土条带用钙质结核,(核径为 0.3~2cm),无摇振反应,切面光滑,干强度高,韧性高。 八、粘土:灰黄色,可塑,无摇振反应、光滑,干强度高,韧性高,局部分布。 九、粘土:灰黄~褐黄色,硬塑,含少量的铁,锰质结核,可塑,无摇振反应,光滑,干强度高,韧性高。 十、强风化泥质粉砂岩:棕红色,风化强烈,取芯呈砂土状,手捏易碎,遇水易软化,节理裂隙较发育。
十一、中风化泥质粉砂岩:棕红色,取芯呈长柱状,锤击声哑、易碎,采取率92%,RQD81%。无裂隙,具水平节理,岩石等级Ⅴ类。 十二、中风化灰岩:灰~深灰色,隐晶质结构中厚层状构造,岩石结构致密坚硬,裂隙发育大部分闭合,由方解石充填,岩芯多呈短柱状,长柱,少量呈碎石块状,碎粒状,土状,长度20~40cm 局部溶蚀现像严重,岩芯表面呈峰窝状,溶径5~20mm,最大 50mm.采取率 92% RQD81%. 十三、粉质粘土夹粉土:灰黄~青灰色,可塑,含少量云母片,无摇振反应,稍有光泽,干强度中等,韧性中等。(一般情况下要分开描述)灰黄色,软~可塑,无摇振反应,稍有光滑,干强度中等,韧性中等。局部夹薄层粉土。浅灰色,可塑,粉粒含量高,无摇振反应,稍有光滑,干强度中等,韧性中等。局部夹30cm 厚薄层粉土,湿,中密~密实。 十四、粘土夹粉砂:灰黄色,褐黄色,可塑,含少量钙质结核核径为 3cm。夹薄层壮中密粉砂,具水平层理,无摇振反应,切面稍光滑,干强度高,韧性高。十五、碎石土:浅黄色,灰黄色,中密~密实,碎石含量 50%~70%棱角形,次棱角形,一般直径 20~40mm 最大粒径 120mm 成份以灰岩为主,少量为砂岩,由老黄土、新黄土,中粗砂,砾石充填。 十六、全风化粘土岩:褐灰色,黄褐色,棕红色。结构构造完全破坏岩芯呈土状,含风化碎屑,碎块,手捏易碎,遇水易分解。十七、强风化粘土岩:褐灰色,黄褐色。棕红色,结构构造大部分破坏,岩芯呈碎块状,节理裂隙较发育。八、页岩:灰黄色,薄层状,手捏易散,遇水易崩解。 野外记录要点: 1) 粉质粘土:一般描述颜色,状态,夹含物。土质结构特征(均质程度或夹层,互层夹薄层)。状态:流塑、软塑、可塑、硬塑、坚硬。夹含物:铁锰质斑状黑色结核及浅绿色高岭土成份局部地区夹碎石,砂石颗粒(粒径较小,并夹腐植物)2) 粉土:描述颜色,状态(稠度公路)湿度,夹含物,土层结构。切面光泽,韧性。摇振反应。状态同粉质粘土不可搓条,湿度同粉质粘土。夹含物:腐蚀物。摇振反应:取少量粉土搓成小球在手掌中摇晃,如有水溢出表示摇振反应较高,无水则低。 3) 残积土:颜色,状态,夹含物。状态:软塑、可塑、硬塑夹含物一般为夹铁