【谷速软件网】matlab有偿编程 -3D彩色线图
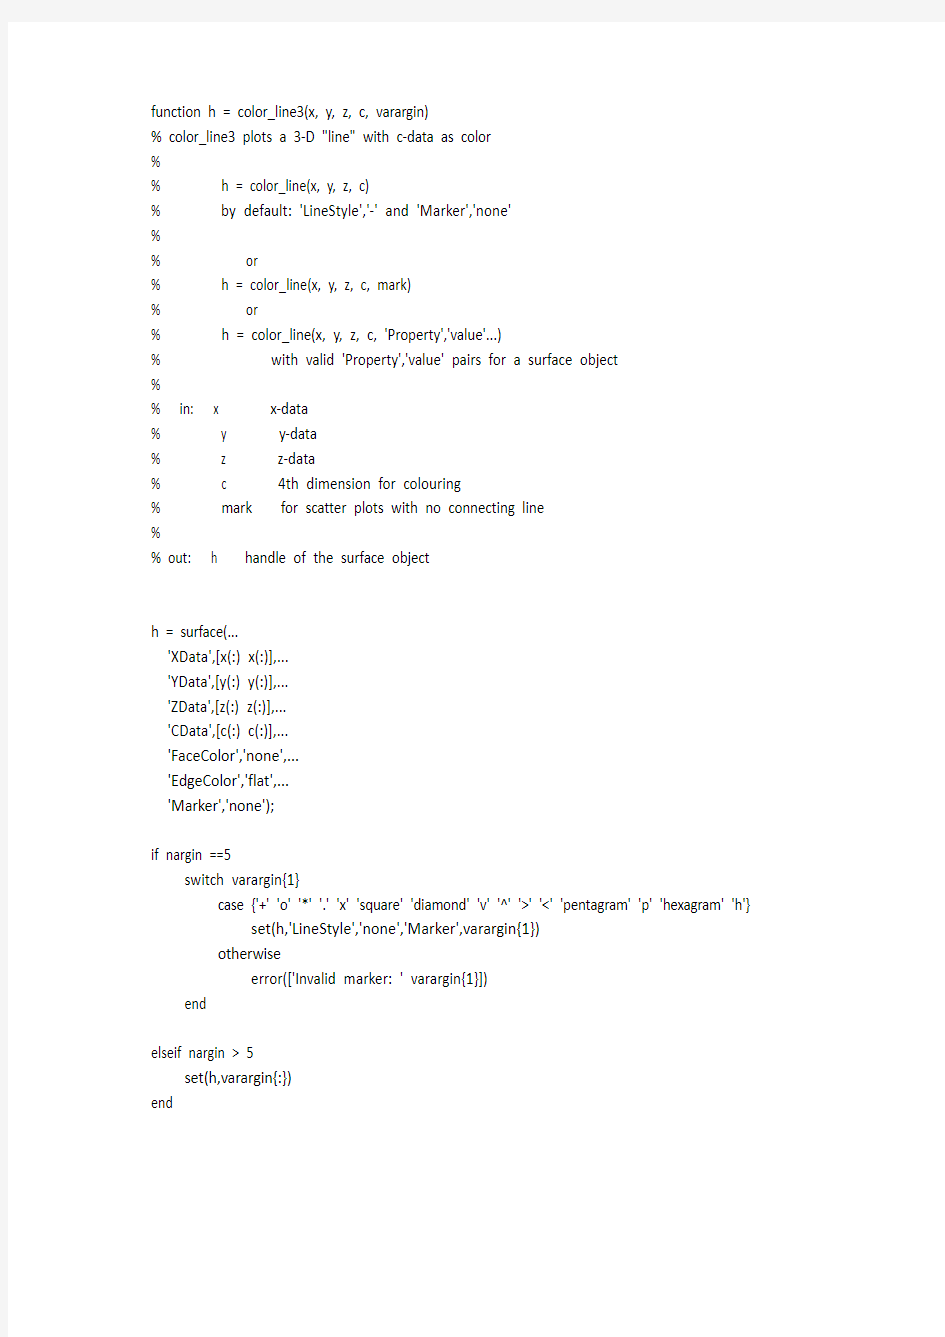
function h = color_line3(x, y, z, c, varargin)
% color_line3 plots a 3-D "line" with c-data as color
%
% h = color_line(x, y, z, c)
% by default: 'LineStyle','-' and 'Marker','none'
%
% or
% h = color_line(x, y, z, c, mark)
% or
% h = color_line(x, y, z, c, 'Property','value'...)
% with valid 'Property','value' pairs for a surface object
%
% in: x x-data
% y y-data
% z z-data
% c 4th dimension for colouring
% mark for scatter plots with no connecting line
%
% out: h handle of the surface object
h = surface(...
'XData',[x(:) x(:)],...
'YData',[y(:) y(:)],...
'ZData',[z(:) z(:)],...
'CData',[c(:) c(:)],...
'FaceColor','none',...
'EdgeColor','flat',...
'Marker','none');
if nargin ==5
switch varargin{1}
case {'+' 'o' '*' '.' 'x' 'square' 'diamond' 'v' '^' '>' '<' 'pentagram' 'p' 'hexagram' 'h'} set(h,'LineStyle','none','Marker',varargin{1})
otherwise
error(['Invalid marker: ' varargin{1}])
end
elseif nargin > 5
set(h,varargin{:})
end