BIOINFORMATICS ORIGINAL PAPER
Vol.22no.232006,pages2890–2897
doi:10.1093/bioinformatics/btl492 BIOINFORMATICS ORIGINAL PAPER
Gene expression
A scalable method for integration and functional analysis of multiple microarray datasets
Curtis Huttenhower,Matt Hibbs,Chad Myers and Olga G.Troyanskaya?
Department of Computer Science,Lewis-Sigler Institute for Integrative Genomics,Princeton University, Princeton,NJ,USA
Received on July31,2006;revised on September5,2006;accepted on September19,2006
Advance Access publication September27,2006
Associate Editor:John Quackenbush
ABSTRACT
Motivation:The diverse microarray datasets that have become available over the past several years represent a rich opportunity and challenge for biological data mining.Many supervised and unsupervised methods have been developed for the analysis of individual microarray datasets.However,integrated analysis of multiple datasets can provide a broader insight into genetic regulation of specific biological pathways under a variety of conditions.
Results:To aid in the analysis of such large compendia of microarray experiments,we present Microarray Experiment Functional Integration Technology(MEFIT),a scalable Bayesian framework for predicting functional relationships from integrated microarray datasets. Furthermore,MEFIT predicts these functional relationships within the context of specific biological processes.All results are provided in the context of one or more specific biological functions,which can be pro-vided by a biologist or drawn automatically from catalogs such as the Gene Ontology(GO).Using MEFIT,we integrated40Saccharomyces cerevisiae microarray datasets spanning712unique conditions.In tests based on110biological functions drawn from the GO biological process ontology,MEFIT provided a5%or greater performance increase for54 functions,with a5%or more decrease in performance in only two functions.
Contact:ogt@https://www.360docs.net/doc/9f17940680.html,
Supplementary information:Supplementary data,a collection of predictions made by MEFIT and software implementing MEFIT are available online at https://www.360docs.net/doc/9f17940680.html,/mefit/.
1INTRODUCTION
Within the past decade,biological datasets have become available spanning not just whole genomes but multiple genomes,both within and across species.In particular,microarray coexpression studies routinely pro?le whole genomes simultaneously;and with shrinking costs,thousands of whole-genome experiments have become publicly accessible for many model organisms.Many methods have been proposed for extracting biological meaning from microarray data,including normalization and meta-analysis (Choi et al.,2003;Grif?th et al.,2005;Hu et al.,2005;Moreau et al.,2003),clustering(Allison et al.,2006;Butte et al.,2000; Cheng and Church2000;Eisen et al.,1998;Heyer et al.,1999), signature algorithms(Bergmann et al.,2003;Ihmels et al.,2005;Ihmels et al.,2002;Kloster et al.,2005),detection of differential expression(Baggerly et al.,2001;Cui and Churchill,2003;Ideker et al.,2000),and many others.Although complete analysis of individual microarray datasets is by no means a solved problem, it is of interest to begin examining the additional conclusions derivable from analysis of many microarray datasets.Integration such as this can enable broader understanding of gene regulation in the context of speci?c pathways and can allow the discovery of coexpression relationships too weak to be detected in individual experiments.
Such integrated analysis of microarray datasets is challenging because of differences in technology,protocols and experimental conditions across datasets.Thus,any microarray integration system must be robust to such differences and should easily adjust to new datasets,perhaps from technologies yet to be developed.Further-more,in examining any diverse biological datasets(such as microarray results drawn from differing experimental conditions), it is critical to consider functional speci?city,i.e.which biological processes are active in which experiments(Huttenhower and Troyanskaya,2006).For example,in a set of a thousand microarray experiments over Saccharomyces cerevisiae,only10experiments might have been performed under conditions inducing sporulation. These few microarrays might show strong coexpression of meiotic genes not expressed or not coregulated under other circumstances. This is a bene?t in that it provides more speci?c information regarding meiosis-related genes,but such a relatively small signal can easily be lost during data processing.The problem of integrating many high-throughput data sources thus includes a problem of determining functional relevance;not only can such data reveal genes that are functionally related,it can also reveal the biological circumstances under which they relate.
To this end,we propose a Microarray Experiment Functional Integration Technology,MEFIT;this is a Bayesian framework facilitating the integration of multiple microarray datasets for predicting coexpression-based functional networks of proteins. Furthermore,each of MEFITs predicted functional relationships is provided within the context of a speci?c biological process. These biological functions of interest can be provided directly by a biologist,or they can be derived automatically from functional catalogs such as the Gene Ontology(GO)(Ashburner et al.,2000) or MIPS(Ruepp et al.,2004).In addition to its predicted functional relationships,MEFIT’s analysis process also provides a functional association score indicating how predictive each input microarray dataset is of each biological function.
?To whom correspondence should be addressed.
2890óThe Author2006.Published by Oxford University Press.All rights reserved.For Permissions,please email:journals.permissions@https://www.360docs.net/doc/9f17940680.html,
Most prior work in large-scale microarray integration has been performed in one of two contexts:statistical meta-analysis or the introduction of multiple microarray experiments into heterogeneous data integration systems.Choi et al.,2003;Rhodes et al.,2004; Hu et al.,2005and Mulligan et al.,2006are representative examples of the former,all of which use meta-analysis to integrate microarray experiments for the detection of differential gene expression.In MEFIT,we take advantage of similar meta-analytic techniques in order to make disparate microarray experiments comparable,but we build upon the results to make predictions of global coexpression relationships and biological function and to determine the functional speci?city of input microarray datasets. Pavlidis et al.,2002;Clare and King,2003;Troyanskaya et al., 2003;Lee et al.,2004and Butte and Kohane,2006describe methods for the use of heterogeneous data integration to predict gene function or functional relationships,but none of these(or similar)systems focus speci?cally on the way in which microarray experiments are integrated.Most often,correlation over individual datasets or all datasets simultaneously is used with minimal inter-study normalization.This can result in a surprising amount of lost information,particularly since microarrays often represent by far the most extensive body of data available for integration(Karaoz et al.,2004;Lee et al.,2004;Pavlidis et al.,2002;Troyanskaya et al.,2003).MEFIT improves on these prior systems by providing a scalable integration system speci?cally for microarrays that takes advantage of the functional diversity of coexpression data to
improve prediction accuracy,to provide additional biological context for predicted functional relationships,and to identify bio-logical functions in which individual datasets are particularly infor-mative.To our knowledge,none of these prior systems has provided a means of predicting both gene pair functional relationships and the speci?c biological processes in which those interactions are expected to occur.
The MEFIT system predicts functional relationships between genes within individual biological processes,consuming microarray datasets and known functional annotations as input.These predic-tions are generated as probabilities using a Bayesian framework trained in a function-speci?c manner.This training process allows one to derive relevance scores from the learned network parameters indicating how reliable the system?nds each dataset to be within each biological process.Thus,MEFIT determines which microarray conditions are informative for a particular biological function in addition to predicting process-speci?c functional relationships.
2METHODS
The primary outputs of the MEFIT system are predicted probabilities of gene pair functional relationships within individual biological functions. These coexpression networks are derived from naive Bayesian networks trained on a per-function basis using microarray data and known functional annotations.The learned parameters of these networks also contain informa-tion regarding how predictive each microarray dataset is of each biological function.Biological functions of interest are provided to the system as simple gene sets(i.e.lists of genes annotated to processes,such as mitotic cell cycle,or pathways,such as fatty acid biosynthesis),which are used to generate known positive pairwise relationships.Known unrelated gene pairs (negatives)are provided as a separate input to the system.For these experi-ments,we use functional annotations from the GO(Ashburner et al.,2000)to generate both positive and negative gene pairs.
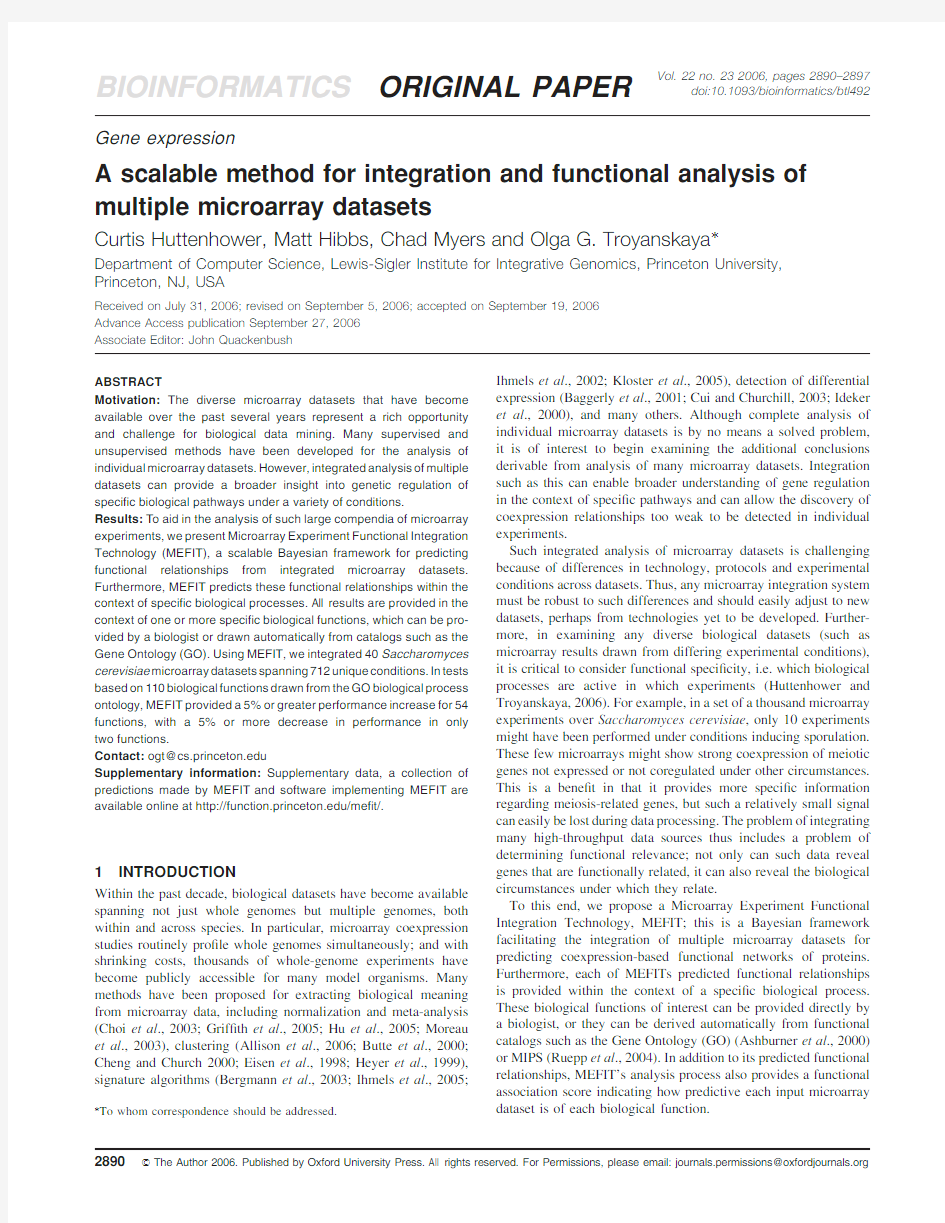
As Figure1summarizes,microarray data are preprocessed in order to serve as observations during training and evaluation of MEFIT’s collection of naive Bayesian networks.The input functional annotations are used to derive known functional relationships(for training and evaluation)as well as to provide functional speci?city by dictating the biological contexts for which separate Bayesian networks should be constructed.Finally,naive Bayesian inference on these per-function networks serves to produce pre-dicted functional relationships for gene pairs within each biological function.
2.1Microarray data preparation
We assembled S.cerevisiae microarray data available from the Stanford Microarray Database(Ball et al.,2005),the NCBI Gene Expression Omnibus(Barrett et al.,2005),and several independent sources(see Sup-plementary Table1for a complete list).These data comprised40unique datasets(time courses or other cohesive collections of experiments)drawn from34publications for a total of712individual experiments,some single and some dual channel.For each individual dataset,genes missing in>50% of the experimental conditions were removed,and the remaining missing values were imputed using KNNImpute(Troyanskaya et al.,2001)with k?10.Finally,replicated genes were averaged to ensure that each dataset contained at most one expression vector per open reading frame.
For single channel data,expression values<2were considered to be missing,and all single channel values were logarithmically transformed as a?nal preprocessing step.Since mismatch hybridization values were not available in many datasets,they were not used in this analysis. Within each dataset,we calculated Pearson correlations between every pair of genes.These correlations were then normalized using Fisher’s Z-transform(David,1949):
Z?
1
2
log
1tr
1àr
This maps a correlation r into a Z-score,where the collection of pairwise Z-scores within a dataset is guaranteed to be normally distributed.After dividing by the dataset standard deviation and subtracting the mean,this distribution will be N(0,1),making cross-dataset analyses more robust. Thus,from each microarray dataset,we produce a collection of gene pair Z-scores representing the number of standard deviations their correlation lies away from the
mean.
Fig.1.An overview of MEFIT.A schematic of MEFITs data processing and control methodology.Microarray datasets are provided as input;these are preprocessed and quantized to serve as inputs for naive Bayesian networks.
A single network structure is used for all biological functions,but the parameters of these networks are trained individually for each function of interest.Biological functions of interest and known FNs for training are derived from input sets of functional annotations.Finally,Bayesian inference produces a probability of functional relationship for each gene pair within each biological function.
Method for integration and functional analysis
2891
2.2Bayesian data integration
MEFIT integrates multiple microarray datasets in speci?c biological contexts to allow for greater accuracy when predicting functional relation-ships.For each biological function of interest,MEFIT uses a naive Bayesian model to combine many microarray datasets and produce a single,integrated functional relationship score for every pair of genes,creating a function-speci?c,probabilistic coexpression network.Thus,a separate Bayesian net-work is trained for each process or function of interest.Each of these net-works generates predicted functional relationships within its particular biological function,and the parameters of the network encode how infor-mative a dataset is within that function;an individual dataset is likely to provide varying degrees of predictive accuracy across disparate biological functions.
In each network,the probability of each dataset’s observed correlation (represented as Z-scores)is conditioned on the probability of functional relationship;each dataset’s Z-scores are discretized into?ve bins(below à1,à1to0,0to1,1to2and above2)and assigned to a single node in the model.Finer binning was found to lead to over?tting and data sparsity issues(data not shown).This results in a Bayesian network with one node(FR)predicting functional relationships and n nodes conditioned on FR,each representing the value of some dataset D i.For some gene pair (g i,g j)and supporting data{d1(g i,g j),d2(g i,g j),...,d n(g i,g j)}with d k(g i,g j)2{0,1,2,3,4},the probability of functional relationship is thus:
P i?jeFR?yesT/
Y n
k?1
P?D k?d keg i?g jT
The University of Pittsburgh Decision System Laboratory’s SMILE library and GENIE modeling environment(Druzdzel,1999)employing the Lauritzen inference algorithm(Lauritzen and Spiegelhalter,1988) were used for Bayesian network manipulation,in addition to our own C++implementations of basic naive Bayesian learning and inference (Neapolitan,2004).After training(discussed below),this method produces one probability of functional relationship per gene pair,referred to in this paper as the BAYESIAN integration process.
2.3Testing and validation
MEFIT requires one or more sets of functionally related genes as input(posi-tives),as well as a collection of unrelated gene pairs(negatives).For these experiments,we used200functions drawn from GO as positive sets(Supple-mentary Table2);genes coannotated below these terms were considered to be functionally related.These terms were hand selected by a panel of six yeast genetics experts who were asked to evaluate whether each GO term would be informative enough to direct laboratory experiments.We constructed a set of all GO terms receivingfouror more votes and added their descendants;we then trimmed this set by discarding any term for which all paths to the ontology root were blocked by another term in the set.Any pair of genes sharing an annotation beneath some term in this set was considered to be related (positive).To generate negative examples,any gene pairs not coannotated below some GO term including at least10%of the S.cerevisiae genome (roughly645genes)were considered to be unrelated(Supplementary Table3).This resulted in a set of619278related and8853875unrelated pairs. Of the genes included in this set of pairs,20%(951genes)were randomly selected as test genes and held out of all training.Our test set consisted of any pair including at least one of these genes(241408positive and 3320786negative pairs),and the remaining pairs were used for training. Performance was evaluated using areas under the ROC curves(AUC).All AUCs were calculated analytically using the Wilcoxon Rank Sum formula (Lehmann,1975).We generally observed only small differences between training and test performance(Supplementary Table4).These training and test sets were used for the construction and validation of the global integration methods discussed below,and they were further subdivided for per-function analyses.2.4Global microarray integration
As discussed above,we implemented a version of our system that trains only one global network,referred to as BAYESIAN integration.For comparison purposes,we also implemented three non-Bayesian integration methods. Most naively,after preprocessing up to the gene averaging stage(excluding Fisher’s Z-transform),each microarray dataset was individually normalized per gene to have mean zero and standard deviation one.After this,all experiments were concatenated to create one large expression vector per gene,and pairwise Pearson correlations were calculated using these vectors. For each gene pair,conditions in which at least one missing value remained (due to genes not present in particular datasets)were removed from the correlation calculation.This resulted in the CONCATENATION integration technique.
One can also integrate microarray datasets using statistical meta-analysis similar to that discussed in(Choi et al.,2003).To accomplish this,we proceeded through preprocessing as described above to the point where each dataset was represented by a collection of pairwise Z-scores drawn from N(0,1).For each gene pair,these Z-scores were averaged over the datasets including that pair,producing the Z-SCORE integration data. Finally,we implemented a version of the microarray integration method discussed in(Lee et al.,2004)in the context of general data integration. In brief,pairwise Pearson correlations were calculated per dataset.The pairs in the training set were used to produce a modi?ed precision/recall plot(a log-likelihood(LLS)/correlation plot)to which a sigmoid curve could be?t.This curve allowed transformation of correlations from the test set into a LLS space from which datasets are integrated by taking the average LLS for a gene pair across all available data.This will be referred to as the LLS integration.
2.5Functional analysis
For microarray integration on a per-function basis,it was necessary to further decompose the training and test sets into collections of gene pairs relevant to each biological process of interest.In all cases,a gene pair was considered relevant to some function if(i)it represented a positive rela-tionship and both genes were included in the function or(ii)it represented a negative relationship and one gene was included in the function.This provides a de?nition of training and test sets for each function provided as input(e.g.the GO terms discussed above).When evaluating the perfor-mance of the four global integration techniques on individual functions, training(for the BAYESIAN and LLS methods)was performed using the entire training set.Evaluation was performed using each function’s test set. Functions containing fewer than ten genes(45gene pairs)were not consid-ered during testing.
Using the same naive Bayesian framework,we also learned one network per-function using the individual training sets—the MEFIT integration technique.In addition to the predictive bene?ts discussed below,this provided additional information relating each microarray dataset to each func-tion of interest.Speci?cally,we calculated the average difference between the prior and posterior probabilities of a functional relationship for each dataset and function.For each biological function,dataset and discretized value,we provided only that datum as input to the function’s Bayesian network.We then averaged(over the?ve discretized inputs for a particular dataset)the absolute values of the differences between the networks’s prior and the pos-terior probabilities of functional relationship generated in this manner.This provides a measure of how‘trustworthy’or in?uential each dataset is when predicting gene pairs in each function(Fig.4).
3RESULTS
3.1Characteristics of functional relationships vary
by biological process
The performance of the?ve integration techniques on selected GO functions can be seen in Figure2,and Supplementary
C.Huttenhower et al. 2892
Table4contains a complete listing.The MEFIT integration method yields an AUC increase of5%or more(over the maximum of the other four methods)in54of the110functions for which evaluation of all?ve methods was possible.Performance increased by a smal-ler amount in31of the remaining functions and decreased by>5% in only two functions.
Interestingly,the functions in which the simpler CONCATENATION and Z-SCORE techniques perform well relative to the other three integration methods are also among those with the highest overall AUCs:ribosome biogenesis,rRNA metabolism,RNA methylation, electron transport and cellular respiration.This may indicate that for such high-performing functions,little room for improvement exists given the currently available data.Indeed,these functions fall into two categories,ribosomal processing and basic cellular metabolism,both of which are known to have clear‘global’signals in microarray data(Eisen et al.,1998;Jansen et al.,2002).That is, given a collection of microarray experiments performed under almost any conditions,it is likely that genes related to ribosomes and cellular respiration will be coexpressed at detectable levels. This ubiquitousness makes these functions easy to detect by techniques such as concatenation;even a modest signal present in most microarrays will be detectable in a correlation calculated across all experiments simultaneously.This accounts for the ease with which ribosomal function can be predicted from coexpression data(Gasch et al.,2000;Karaoz et al.,2004;Lanckriet et al.,2004). Other functions in which MEFIT shows little improvement,(such as protein kinase cascade or fermentation)are small or poorly studied functions in which data sparsity makes it impossible for any prediction technique to perform well.
Conversely,the functions in which MEFIT provides the most improvement tend to be speci?c functions that are reasonably well represented in the data but are poorly predicted by more global methods.For example,genes involved in the meiotic cell cycle/response to pheromone/sporulation group of functions should be coexpressed only under very speci?c circumstances;such a signal would be undetectable by correlation across all datasets simultaneously.Relative to CONCATENATION and Z-SCORE integra-tion,the LLS method also provides some improvement for several such speci?c functions.Since MEFIT is designed to upweight data-sets within functions where they demonstrate predictive power,this method is able to extract more localized signals originating in a few microarrays performed under appropriate conditions.
3.2Bayesian integration of microarray datasets
It is of interest to compare the performance of the four global microarray integration methods—BAYESIAN,CONCATENA-TION,Z-SCORE and LLS—on the entire answer set,without decom-posing the results into speci?c biological functions.Additionally,
Fig.2.Per-function performance of each integration technique.Areas under sensitivity/specificity curves(AUCs)for a selection of biological functions extracted from GO,ordered from most to least improvement and evenly spanning MEFIT’s performance range.MEFIT showed an AUC increase of5%or more over all other integration techniques in54of the110functions evaluated;AUC decreased by5%or more in only two functions.AUC values range from random at 0.5to optimal at1.0.We measured performance for the concatenation,Z-score,LLS,Bayesian and MEFIT integration techniques;results for all GO terms in our answer set appear in Supplementary Table4.
Method for integration and functional analysis
2893
one can reintegrate the individual components of the MEFIT output in a variety of ways to produce a global prediction set;relative to the BAYESIAN integration method,this has the bene?t of preserving dataset/function associations by weighing each dataset by its relevance to each function.Ideally,each gene pair should be globally related if it is related in at least one function.In practice,noise in the predictions can make this assumption error-prone (a single overcon?dent prediction can dominate the overall proba-bility),so we reintegrate each gene pair by taking the average probability of functional relationship over all functions in which that pair is predicted.This reintegration of the MEFIT output will be referred to as the AVERAGED MEFIT method.
Perhaps the most striking feature of a comparison of these global integration techniques (Fig.3)is the sharp decline in precision of the CONCATENATION method at low recall (i.e.high correlation).In other words,gene pairs strongly correlated across an extremely large vector of disparate microarray conditions tend to be func-tionally unrelated.This is caused by factors such as transposable elements and similar sources of homology (telomeric sequences,etc.)that can lead to non-functionally related coexpression under essentially any experimental conditions.These sequences are known to be problematic due to cross-hybridization in coexpression experiments (Bozdech et al .,2003),and they are excluded from most microarrays;the CONCATENATION method interprets this absence as missing data and sees these genes only as very strongly correlated across the few datasets in which they are present,result-ing in its poor performance at low recall.
Both the BAYESIAN and AVERAGED MEFIT results retain high pre-cision at low recall cutoffs,with the AVERAGED MEFIT method also showing a substantial improvement in high recall areas.These integration techniques both explicitly encode the necessity to ignore or downweight inputs that tend to be overcon?dent (e.g.datasets in which a high correlation is not necessarily indica-tive of functional relationship),leading to their improved low recall behavior.AVERAGED MEFIT integration is able to perform the same downweighting on a per-function basis,which likely contributes to its greater precision at high recall.
3.3
Functional analysis reveals both expected and novel data content
In addition to per-function and global predictions of gene pair functional relationships,MEFIT also provides information on the relationships between microarray datasets and biological processes.Speci?cally,each per-function network learns during training how reliable it expects each dataset to be within its function.These reliabilities can be extracted as posterior probabilities after Baye-sian inference,leading to a single con?dence score for each dataset in each biological function.
Several aspects of these con?dence scores (Fig.4)demonstrate clear agreement with the per-function results shown earlier and with existing biological knowledge.Nearly every dataset for example is highly informative regarding ribosome biogenesis and rRNA metabolism (Fig.4,light gray cluster),for the reasons dis-cussed above;this is accompanied by a similar,weaker signal from the general translation function.Of the datasets in which ribosomal functions are not well predicted,(Angus-Hill et al .,2001)and (Rudra et al .,2005)are knockouts in which ribosomal genes are speci?cally disrupted.
Many datasets have moderately strong responses in amine ,amino acid and organic acid metabolism (Fig.4,black cluster),but the (Brem and Kruglyak,2005)and (Yvert et al .,2003)results particularly stand out.These are both recombination studies between lab (BY4716)and wine (RM11-1a)strains with a focus on regulatory relationships.Other strong signals arise from the (Hardwick et al .,1999)study investigating rapamycin treatment and nutrient response and from the two (Saldanha et al .,2004)datasets for leucine and uracil limitation.All of these experiments have clear ties to amine and amino acid metabolism.
Three datasets are found to be particularly informative for DNA recombination ,M phase ,meiotic cell cycle ,and sporulation (Fig.4,dark gray cluster);these are (Primig et al .,2000)(a sporu-lation time course),(Williams et al .,2002)(UME6deletion,a known meiotic regulator)and (Jin et al .,2004).While the ?rst two ?ndings seem logical,(Jin et al .,2004)studies xylose meta-bolism and fermentation,which has no obvious connection to meio-sis.Our functional relevance results in this case alert a biologist to the possibility of a sporulation response to an inhospitable medium,a pre-sporulation response (Pringle et al .,1997)or a disruption of the nutrient response pathways due to introduction of the XYL1,XYL2and XYL3genes (Jin et al .,2004),information that might not have been evident without such a per-function analysis.
A biologist could use such information in at least two ways.Given a set of existing microarrays and a pathway or process of interest,this functional decomposition reveals datasets with an increased likelihood of containing information regarding that pathway or process.Conversely,given a new microarray (possibly generated under experimental conditions spanning many functions),functional decomposition produces a summary of pathways poten-tially disrupted or activated under its conditions.These analysis methods would be lost in an integration technique not taking advantage of the functional speci?city of microarray datasets and of functional relationships.
-1
Recall
L L S
Fig.3.Global integration performance.A comparison of the five global integration methods.A log scale inset is shown to emphasize the high precision area of biological interest;the minimum recall is limited to a minimum of 100positive predictions to avoid noise.Performance is shown using the LLS score LLS ?log 2(TP·N/FP/P )for P total positive pairs,N total negative pairs and TP and FP the number of true and false positives at a particular sensitivity threshold.
C.Huttenhower et al.
2894
Method for integration and functional analysis
Fig.4.Predictive power of datasets within individual biological functions A portion of the per-function dataset confidence scores learned by MEFIT.Brighter cells indicate a higher average posterior probability of functional relationship given input from a particular microarray dataset in a particular biological function. These are calculated from networks averaged over a5-fold cross validation and are small due to the volume of microarray data employed(the maximum average difference for permuted data are~0.005).Datasets and ontology terms have been clustered to visually show similarities in predictive power.The three colored clusters(amine metabolism in black,meiosis in dark gray,and ribosomal in light gray)represent interesting predictions discussed in the text.The heat map was generating using TIGR MeV(Saeed et al.,2003).
2895
3.4Novel functional predictions
Based on the integrated per-function coexpression networks predicted by MEFIT,we can make functional predictions for genes previously unannotated in GO.Speci?cally,we examined several functions in which MEFIT showed marked improvement over previous integration techniques and extracted the most con?dent predictions.Searching these predictions for highly connected subgraphs involving both known and unknown genes produced several candidates,of which we chose to examine two: YML037C and YHR159W clustered around MMS4in the meiotic cell cycle function,and YKR016W,YNL100W and YNL274C clustered around INH1and TIM11in hydrogen transport.
All six of these genes are uncharacterized open reading frames annotated to biological process unknown,save for YNL274C’s overly general metabolism annotation(which was unused in our analysis).In hydrogen transport,the GO term representing mitochondrial proton processing,INH1and TIM11are both proteins associated with the F1F0-ATP synthase(Brunner et al., 2002).Of our predictions,YNL100W and YKR016W are known to localize to the mitochondrion(Huh et al.,2003),and all three appear in the mitochondrial proteome(Sickmann et al.,2003). Deletion of YKR016W also shows growth defects on non-fermentable carbon sources(Steinmetz et al.,2002),which we have con?rmed in our lab(data not shown).YNL274C shows no strong localization,but its sequence contains a hydroxyacid dehydrogenase domain targeting NAD(Mulder et al.,2005), supporting our predicted role in cellular respiration.
Our predicted meiotic cell cycle group is centered on MMS4, which is a meiotic and mitotic gene involved in recombination and DNA repair(Xiao et al.,1998).YML037C shows a strong colocalization with clathrin coated vesicles(Huh et al.,2003), appears to behave as a transcriptional activator(Titz et al., 2006),and may be a substrate of the DBF2-MOB1mitotic exit regulation complex(Mah et al.,2005).These characteristics point towards a potential mitotic or meiotic regulatory role for YML037C,in agreement with our prediction.YHR159W is thought to be a phosphorylation target of CDK1/CDC28,showing cell cycle regulation peaking in G1(Ubersax et al.,2003);tests in our lab have shown that a heterozygous deletion mutant appears to be defective in tetrad formation during sporulation,a phenotype that we are currently investigating in more detail.
4DISCUSSION
Here,we present MEFIT,a methodology for the simultaneous analysis of multiple microarray datasets using Bayesian integration augmented by per-function analysis.MEFIT’s integration improves upon the general predictive power of existing methods for discovery of pairwise functional relationships from diverse microarray data. Additionally,it produces a per-function analysis for biologists, providing predictions in the context of individual pathways or bio-logical processes(which may also be speci?ed initially by the biologist).
Two strengths of MEFIT lie in its scalability and interpretability. Naive Bayesian learning and inference are both computationally inexpensive,and analysis can be performed simultaneously for hundreds of datasets spanning thousands of conditions.Addition-ally,given a single new dataset to integrate,no retraining need be performed—the conditional probabilities relevant to the new data can be learned independently of existing data.The statistics required for dataset normalization are fairly standard,and learned network parameters are readily interpretable and visualizable as probability distributions over each dataset and function.
As de?ned above,‘functions’in this framework are simply gene lists de?ned by some prior method to be functionally related.These might consist of pathways or transcription factor modules speci?ed by a biologist or of larger collections of genes;we have used groups of genes sharing annotations in GO(as well as performing initial validations with the MIPS hierarchy).This could easily be extended into other organisms,for example by using tissue types or cancer pathways in mammalian systems.MEFIT learns to predict novel functional relationships similar to those speci?ed in its input sets. The output of MEFIT is one naive Bayesian network per-function;dataset to function con?dence values and per-function probabilities of gene pair functional relationships can be immedi-ately derived from these learned networks.In other words,MEFIT produces one genetic interaction network per function in addition to a global interaction network;if desired,by interpreting pairwise probabilities as similarity scores,these predictions can be further visualized(e.g.as per-function clusters).Since functional relation-ships are frequently speci?c to individual biological processes[such as STE7/FUS3interaction during pheromone response versus STE7/KSS1interaction during nutrient limitation(Madhani and Fink,1997;Ptashne and Gann,2003)],this provides a biological perspective that is both more realistic and,by compartmentalizing interactions,more manageable.
We have made our test predictions available at the MEFIT web site(https://www.360docs.net/doc/9f17940680.html,/me?t/)along with a collection of predictions for the entire S.cerevisiae genome constructed by training on all known data and evaluating all gene pairs(including unknowns).This site includes an interface for browsing these predictions and the large collection of microarray datasets used to generate them.We expect that this microarray integration methodology will be useful in the context of heterogeneous data integration tools,where it can provide more informative pre-processing of coexpression data.We have already established substantial biological evidence for several of MEFIT’s predictions, and we hope that it will provide a useful tool for guiding future laboratory and high-throughput experiments.
Con?ict of Interest:none declared.
REFERENCES
Allison,D.B.(2006)Microarray data analysis:from disarray to consolidation and consensus.Nat.Rev.Genet.,7,55–65.
Angus-Hill,M.L.et al.(2001)A Rsc3/Rsc30zinc cluster dimer reveals novel roles for the chromatin remodeler RSC in gene expression and cell cycle control.Mol.Cell, 7,741–751.
Ashburner,M.et al.(2000)Gene Ontology:tool for the uni?cation of biology.
The Gene Ontology Consortium.Nat.Genet.,25,25–29.
Baggerly,K.A.et al.(2001)Identifying differentially expressed genes in cDNA microarray https://www.360docs.net/doc/9f17940680.html,put.Biol.,8,639–659.
Ball,C.A.et al.(2005)The stanford microarray database accommodates additional microarray platforms and data formats.Nucleic Acids Res.,33,D580–D582. Barrett,T.et al.(2005)NCBI GEO:mining millions of expression pro?les—database and tools.Nucleic Acids Res.,33,D562–D566.
Bergmann,S.et al.(2003)Iterative signature algorithm for the analysis of large-scale gene expression data.Phys.Rev.E.Stat.Nonlin.Soft.Matter Phys.,67,031902.
C.Huttenhower et al. 2896
Bozdech,Z.et al.(2003)Expression pro?ling of the schizont and trophozoite stages of Plasmodium falciparum with a long-oligonucleotide microarray.Genome Biol., 4,R9.
Brem,R.B.and Kruglyak,L.(2005)The landscape of genetic complexity across5700 gene expression traits in yeast.Proc.Natl https://www.360docs.net/doc/9f17940680.html,A,102,1572–1577. Brunner,S.et al.(2002)Su e of the yeast F1Fo-ATP synthase forms homodimers.
J.Biol.Chem.,277,48484–48489.
Butte,A.J.and Kohane,I.S.(2006)Creation and implications of a phenome-genome network.Nat.Biotechnol.,24,55–62.
Butte,A.J.et al.(2000)Discovering functional relationships between RNA expression and chemotherapeutic susceptibility using relevance networks.Proc.Natl Acad.
https://www.360docs.net/doc/9f17940680.html,A,97,12182–12186.
Cheng,Y.and Church,G.M.(2000)Biclustering of expression data.Proc.Int.Conf.
Intell.Syst.Mol.Biol.,8,93–103.
Choi,J.K.et al.(2003)Combining multiple microarray studies and modeling interstudy variation.Bioinformatics,19,i84–i90.
Clare,A.and King,R.D.(2003)Predicting gene function in Saccharomyces cerevisiae.
Bioinformatics,19,II42–II49.
Cui,X.and Churchill,G.A.(2003)Statistical tests for differential expression in cDNA microarray experiments.Genome Biol.,4,210.
David,F.N.(1949)The moments of the Z and F distributions.Biometrika,36,394–403. Druzdzel,M.SMILE:structural modeling,inference,and learning engine and genie:
a development environment for graphical decision-theoretic models.Proceedings
of the Sixteenth National Conference on Arti?cial Intelligence pp.902–903. Eisen,M.B.et al.(1998)Cluster analysis and display of genome-wide expression patterns.Proc.Natl https://www.360docs.net/doc/9f17940680.html,A,95,14863–14868.
Gasch,A.P.et al.(2000)Genomic expression programs in the response of yeast cells to environmental changes.Mol.Biol.Cell,11,4241–4257.
Grif?th,O.L.et al.(2005)Assessment and integration of publicly available SAGE, cDNA microarray,and oligonucleotide microarray expression data for global coexpression analyses.Genomics,86,476–488.
Grif?th,J.S.et al.(1999)Rapamycin-modulated transcription de?nes the subset of nutrient-sensitive signaling pathways directly controlled by the Tor proteins.
Proc.Natl https://www.360docs.net/doc/9f17940680.html,A,96,14866–14870.
Heyer,L.J.et al.(1999)Exploring expression data:identi?cation and analysis of coexpressed genes.Genome Res.,9,1106–1115.
Hu,P.et al.(2005)Integrative analysis of multiple gene expression pro?les with quality-adjusted effect size models.BMC Bioinformatics,6,128.
Huh,W.K.et al.(2003)Global analysis of protein localization in budding yeast.Nature, 425,686–691.
Huttenhower,C.and Troyanskaya,O.(2006)Bayesian data integration:a functional https://www.360docs.net/doc/9f17940680.html,put.Syst.Bioinformatics,in press.
Ideker,T.E.et al.(2000)Discovery of regulatory interactions through perturbation: inference and experimental design.Pac.Symp.Biocomput.,305–316. Ihmels,J.et al.(2005)Comparative gene expression analysis by differential clustering approach:application to the Candida albicans transcription program.PLoS Genet., 1,e39.
Ihmels,J.et al.(2002)Revealing modular organization in the yeast transcriptional network.Nat.Genet.,31,370–377.
Jansen,R.et al.(2002)Relating whole-genome expression data with protein–protein interactions.Genome Res.,12,37–46.
Jin,Y.S.et al.(2004)Saccharomyces cerevisiae engineered for xylose metabolism exhibits a respiratory response.Appl.Environ.Microbiol.,70,6816–6825. Karaoz,U.et al.(2004)Whole-genome annotation by using evidence integration in functional-linkage https://www.360docs.net/doc/9f17940680.html,A,101,2888–2893. Kloster,M.et al.(2005)Finding regulatory modules through large-scale gene-expression data analysis.Bioinformatics,21,1172–https://www.360docs.net/doc/9f17940680.html,nckriet,G.R.et al.(2004)Kernel-based data fusion and its application to protein function prediction in yeast.Pac.Symp.Biocomput.,300–311.
Lauritzen,S.and Spiegelhalter,D.(1988)Local computations with probabilities on graphical structures and their application to expert systems.J.R.Stat.Soc.,50. Lee,I.et al.(2004)A probabilistic functional network of yeast genes.Science,306, 1555–1558.
Madhani,H.D.and Fink,G.R.(1997)Combinatorial control required for the speci?city of yeast MAPK signaling.Science,275,1314–1317.
Mah,A.S.et al.(2005)Substrate speci?city analysis of protein kinase complex Dbf2-Mob1by peptide library and proteome array screening.BMC Biochem.,6,22. Moreau,Y.et al.(2003)Comparison and meta-analysis of microarray data:from the bench to the computer desk.Trends Genet.,19,570–577.
Mulder,N.J.et al.(2005)InterPro,progress and status in2005.Nucleic Acids Res.,33, D201–D205.
Mulligan,M.K.et al.(2006)Toward understanding the genetics of alcohol drinking through transcriptome meta-analysis.Proc.Natl https://www.360docs.net/doc/9f17940680.html,A,103, 6368–6373.
Neapolitan,R.(2004)Learning Bayesian Networks.Prentice Hall,Chicago,IL. Pavlidis,P.et al.(2002)Learning gene functional classi?cations from multiple data https://www.360docs.net/doc/9f17940680.html,put.Biol.,9,401–411.
Primig,M.et al.(2000)The core meiotic transcriptome in budding yeasts.Nat.Genet., 26,415–423.
Pringle,J.et al.(1997)Saccharomyces:cell cycle and cell biology.Mol.Cell.Biol.
Yeast,in press.
Ptashne,M.and Gann,A.(2003)Signal transduction.Imposing speci?city on kinases, Science,299,1025–1027.
Rhodes,D.R.et al.(2004)Large-scale meta-analysis of cancer microarray data iden-ti?es common transcriptional pro?les of neoplastic transformation and progression.
Proc.Natl https://www.360docs.net/doc/9f17940680.html,A,101,9309–9314.
Rudra,D.et al.(2005)Central role of Ifh1p-Fhl1p interaction in the synthesis of yeast ribosomal proteins.EMBO J.,24,533–542.
Ruepp,A.et al.(2004)The FunCat,a functional annotation scheme for systematic classi?cation of proteins from whole genomes.Nucleic Acids Res.,32,5539–5545. Saeed,A.I.et al.(2003)TM4:a free,open-source system for microarray data management and analysis.Biotechniques,34,374–378.
Saldanha,A.J.et al.(2004)Nutritional homeostasis in batch and steady-state culture of yeast.Mol.Biol.Cell,15,4089–4104.
Sickmann,A.et al.(2003)The proteome of Saccharomyces cerevisiae mitochondria.
Proc.Natl https://www.360docs.net/doc/9f17940680.html,A,100,13207–13212.
Steinmetz,L.M.et al.(2002)Systematic screen for human disease genes in yeast.
Nat.Genet.,31,400–404.
Titz,B.et al.(2006)Transcriptional activators in yeast.Nucleic Acids Res.,34, 955–967.
Troyanskaya,O.et al.(2001)Missing value estimation methods for DNA microarrays.
Bioinformatics,17,520–525.
Troyanskaya,O.G.et al.(2003)A Bayesian framework for combining heterogeneous data sources for gene function prediction(in Saccharomyces cerevisiae).
https://www.360docs.net/doc/9f17940680.html,A,100,8348–8353.
Ubersax,J.A.et al.(2003)Targets of the cyclin-dependent kinase Cdk1.Nature,425, 859–864.
Williams,R.M.et al.(2002)The Ume6regulon coordinates metabolic and meiotic gene expression in yeast.Proc.Natl https://www.360docs.net/doc/9f17940680.html,A,99,13431–13436.
Xiao,W.et al.(1998)Mms4,a putative transcriptional(co)activator,protects Saccharomyces cerevisiae cells from endogenous and environmental DNA damage.Mol.Gen.Genet.,257,614–623.
Yvert,G.et al.(2003)Trans-acting regulatory variation in Saccharomyces cerevisiae and the role of transcription factors.Nat.Genet.,35,57–64.
Method for integration and functional analysis
2897
管理运筹学期末试卷B
一、 二、 三、 填空题(每小题 分,共 ?分) 、设原??问题为?????? ?≥-=++-≥--≤++++-= ,0,5232 4 7 532min 3213213213213 21无约束x x x x x x x x x x x x x x x Z 则它的标准形和对偶规划问题分别为:________________________ 和 ________________________。 、用分枝定界法求整数规划12 12121121min 5 2 56 30 4,0Z x x x x x x x x x x =---≥-??+≤?? ≤??≥?且为整数 的解时,求得放松问题的解为? = ? ? ? ? ? ?,则可将原问题分成如下两个子问题 与 求解。 、右图的最小支撑图是。 、右边的网络图是标号算法中的图,其中每条弧上的数 表示其容量和流量。该图中得到的可行流的增广链 (-3,1) (2,1) ②5(4) ④ ① 6(6) 6(4) ⑥ (0, ∞) 8(8) 3(2 ) 9(9)(5,1)
为: ,在其上可增的最大流量 为 。 、已知某线性规划问题,最优单纯形表如下 则其最优解为: ,最优值 max Z 。 二、单项选择题(每小题 分,共 分) 、下列表格是对偶单纯形表的是( ? )
、关于线性规划模型的可行域,叙述正确的为( ) ?、可行域必有界; 、可行域必然包括原点; 、可行域必是凸的; 、可行域内必有无穷多个点。 、在运输问题中如果总需求量大于总供应量,则求解时应( ) ?、虚设一些供应量; ?、虚设一个供应点; 、根据需求短缺量,虚设多个需求点; ?、虚设一个需求点。 、下列规划问题不可用动态规划方法求解的是( ) ?、背包问题; ?、最短路径问题 、线性规化: ???≥≥=++++=0 ,010 34..max 321 3 32211y x x x x t s x c x c x c Z ?、22 min (,)(2)3(1).. 460,0f x y x y s t xy y x y ?=++-?+
精读课文和略读课文的异同
精读课文和略读课文的异同 双柏妥甸小学:鲁先丽 摘要:新课标指出:各个学段的阅读教学都要重视朗读和默读。加强对阅读的指导,让学生逐步学会精读,略读和浏览,可见略读只是一种与精读和浏览并列的阅读方法。而略读课文作为课文的一种形式呈现在师生面前时,它只是个例子,一个提供教师教与学生学习略读的载体。略读课文中并不排斥精读,因此我认为略读课文中可以略中显精,培养学生掌握一些学习课文的方法。 略读课文的教学,最关键的是教师自身对文本的认真解读和准确把握,要使课堂在思路清晰、条理简约的基础上不失丰赡,应是“教”略而“学”丰。这个“略”度应该介于精读与独立阅读之间,不是囫囵吞枣,更不是越俎代庖牵着学生走,同时在学生自读感悟的基础上又不失教师有效的引导,让学生沉浸在文本之中,和文本一起呼吸、一起慨叹、一起喜怒哀乐,在实践中掌握读书方法,逐步提高独立阅读的能力,促进学生语文素养的形成和发展,这其实是快乐的心灵之旅,“精略相辅”的幸福之旅!长久以来,略读课文在语文教学中处于比较尴尬的境地:一方面,它是课文中的组成部分,不教不行;另一方面,正因为它是“略读”课文,因此,在教学中往往被大多教师所忽视,在实际教学中,教师往往轻描淡写,一读而过,学生对课文也没留下多大印象。长此以往,限制了学生的阅读能力发展。对此,我们必须重新审视略读课文教学,采取有效的教学策略,使略读课文教学达到它应有的目标。以下是我在略读课文教学过程中的一些想法和采取的策略。 策略一:紧抓提示,凸显重点 我们知道略读课文一般只有一课时,在这短短的一课时中,教师快速有效地抓准略读课文的教学重点,使略读课文和精读课文形成一个系统,形成教学合力,更好地发挥训练阅读,迁移能力和陶冶情操的功能。如何抓?从哪里抓?每篇略读课文前的导语为我们提供了很好的借鉴。人教版实验教材在每一课略读课文前都有一段承上启下的提示语从中体会到了什么。有条件的还可以搜集有关丝绸之路的故事和同学交流。提示语优美生动,既激发了学生的阅读兴趣,延续了本组课文的主题,又明确提出了这篇课文的阅读要求。我们可以把这段提示语概括为两个方面: 一、读课文,了解课文讲了哪些内容,从中体会到了什么。 这是要求我们在教学初始引导学生整体把握课文内容,了解文中介绍的主要内容和历史意义,激发学生热爱祖国西部的情感。 二、搜集有关丝绸这路的故事和同学交流。 这点则是要求我们在学完课文的同时,能够引导学生课后去搜集资料,培养学生搜集信息的能力,同时也丰富学生的课外知识,增进与同学间的合作。 像这样,对提示语进行二次解读,既有助于我们教师找准重点,又能及时有效地展开略读课文的教学。 策略二:注重预习,培养自主 苏霍姆林斯基曾经说过这样一段精辟的论语:“在人的心灵深处,都有一种根深蒂固的需要,这就是希望自己是一个发现者、研究者、探索者。在儿童的精神世界里,这种需要特别强烈。”在教学中,教师应根据学生的这一心理特点,激
英语全课文中文翻译
Unit1 Section A 公交司机和乘客一起救护老人 昨天上午9点钟,当26路公交车在中华路行驶的途中,司机看到一位老人正躺在路中,一位妇女正在老人身边大声呼救。 这位24岁的公交司机王平,没有丝毫的犹豫就停下了车。他从车上下来,询问那位妇女发生了什么事。她说这位老人有心脏病,需要送往医院。王先生知道他必须马上行动起来。他告诉(车上的)乘客他必须送老人去医院。他希望大多数或者全部乘客下车等下一班车。但令他惊讶的是,所有的乘客都同意和他一起去(医院)。部分乘客帮助王先生把老人搬到车上。 多亏了王先生和乘客们,医生们及时挽救了那位老人。一位乘客说:“许多人不想帮助别人是令人痛心的,因为他们不想惹上麻烦。但是这位公交车司机没有考虑自己,他只考虑去救人。” SectionB 他失去了胳膊但是仍然登山 阿伦罗尔斯顿是一位对登山感兴趣的美国人。作为一名登山者,阿伦习惯于冒险。这是他做的刺激的危险运动之一。有好多次因为事故,阿伦险些丢掉性命。在2003年的4月26日,当他在尤他州登山的时候,他发现自己陷入了非常危险的境地。 在那一天,当阿伦独自在山里登山时,他的胳膊被一块2000千克的石头压在了下面。因为他的胳膊拿不出来,所以他在那里困了五天,希望有人能够发现他。但是当他的水喝光以后,他知道他将不得不做点事情来挽救自己的生命。那时他还不准备死。所以他用刀子切除了自己一半的右臂。然后,用左胳膊对自己进行了包扎,以至于不会失血过多。完成这些以后,他爬下山,寻求帮助。 失去胳膊以后,他写了一本书《在顽石与绝境之间》。这就意味着你在一个艰难的似乎无法走出的境地中。在这本书中,阿伦讲述了做正确决定的重要性,以及掌握命运的重要性。他对登山的挚爱如此的强烈以至于经过这次经历后,他仍然继续登山。 我们有和阿伦一样的勇气吗?让我们在发现自己处在一个“顽石与绝地间”的境地前考虑一下,在我们不得不做出生与死的选择前考虑一下。 Unit2 SectionA 学生志愿者 来自河畔高中的马里奥格林和玛丽布朗每周拿出几小时去帮忙朋友。 马里奥喜欢动物,想成为一名兽医。每周六的上午,他在一家动物医院做义工。马里奥相信通过做义工能够帮助他得到将来梦想的工作。他说:“做义工是一项艰苦的工作,但是我想了解更多关于如何照顾动物的知识。当我看到动物们变得健康以及它们的主人脸上的快乐表情时,我就有一种强烈的满足感。” 玛丽是一位读书爱好者。在她四岁的时候,就能够自己读书。去年,她决定尝试做一个课后读书活动的志愿者。她仍然在那里一周一次帮助儿童们学习读书。“儿童们坐在图书馆里,但是你能在他们眼睛里看到,通过每一本新书,他们正在踏上不同的旅途。在这里做义工,对我来说实现了梦想。我能做我喜欢做的事情并且同时可以帮助比尔呢。”
管理运筹学期中复习题答案
《管理运筹学》期中测试题 第一部分 线性规划 一、填空题 1.线性规划问题是求一个 目标函数 在一组 约束条件 下的最值问题。 2.图解法适用于含有 两个 _ 变量的线性规划问题。 3.线性规划问题的可行解是指满足 所有约束条件_ 的解。 4.在线性规划问题的基本解中,所有的非基变量等于 零 。 5.在线性规划问题中,基本可行解的非零分量所对应的列向量线性 无 关 6.若线性规划问题有最优解,则最优解一定可以在可行域的 顶点_ 达到。 7.若线性规划问题有可行解,则 一定 _ 有基本可行解。 8.如果线性规划问题存在目标函数为有限值的最优解,求解时只需在其 可行解 的集合中进行搜索即可得到最优解。 9.满足 非负 _ 条件的基本解称为基本可行解。 10.在将线性规划问题的一般形式转化为标准形式时,引入的松驰变量在目标函数中的系数为 正 。 11.将线性规划模型化成标准形式时,“≤”的约束条件要在不等式左_端加入 松弛 _ 变量。 12.线性规划模型包括 决策变量 、目标函数 、约束条件 三个要素。 13.线性规划问题可分为目标函数求 最大 _ 值和 最小 _值两类。 14.线性规划问题的标准形式中,约束条件取 等 _ 式,目标函数求 最大 _值,而所有决策变量必须 非负 。 15.线性规划问题的基本可行解与基本解的关系是 基本可行解一定是基本解,反之不然 16.在用图解法求解线性规划问题时,如果取得最值的等值线与可行域的一段边界重合,则 _ 最优解不唯一 。 17.求解线性规划问题可能的结果有 唯一最优解,无穷多最优解,无界解,无可行解 。 18.如果某个约束条件是“ ”情形,若化为标准形式,需要引入一个 剩余 _ 变量。 19.如果某个变量X j 为自由变量,则应引进两个非负变量X j ′ , X j 〞, 同时令X j = X j ′ - X j 〞 j 。 20.表达线性规划的简式中目标函数为 线性函数 _ 。 21.线性规划一般表达式中,a ij 表示该元素位置在约束条件的 第i 个不等式的第j 个决策变量的系数 。 22.线性规划的代数解法主要利用了代数消去法的原理,实现_ 基变量 的转换,寻找最优解。 23.对于目标函数最大值型的线性规划问题,用单纯型法代数形式求解时,当非基变量检验数_ 非正 时,当前解为最优解。 24.在单纯形迭代中,选出基变量时应遵循_ 最小比值 法则。 二、单选题 1. 如果一个线性规划问题有n 个变量,m 个约束方程(m 关于精读课文和略读课文的区别 在小学语文教材中,精读课文的编排占据主体地位。就其涵盖的内容而言,包含了字词、句、段、篇等语文基本功训练项目,范围十分广泛,知识含量极高,是进行语文基本功训练的主要凭借。由此可见,精读课文的教学在小学语文教学中处于重中之重的地位,它是完成小学语文教学任务的重要途径。但是,就篇幅而言,略读课文在小学中段所占比例较小,但到了高段则是二分之一。因此略读课文的教学同样不可忽视。下面我就精读课文和略读课文教学谈谈区别。 精读。特级教师林润生是这样说的:"精读课文的教学,应让学生拥有完整的阅读过程,经历精读与略读,朗读与默读,自悟与交流,思考与想象,课文阅读与资料收集利用,感知内容与领悟感情,理解与积累运用语言的过程。以此让学生经历了完整的阅读过程,从而激发学生对大自然的热爱。.通过品词、析句,感情朗读,想象画面,让学生感悟语言生动形象和描写的优美。 略读课更需整体把握,不宜肢解课文,应采取读几遍的方法。如,采用自己喜欢的读书方式一读,读对读通,口诵新惟;二读,画画批批,粗知大意;三读,交流收获(可以是受到教育启发的,可以是好词佳句的,可以是文章写法的,可以是读书方法的),积累语言。 略读教学不等于略学。略读课文就是让孩子在精读课文中学到的方法运用到自己的学习中,并在读中掌握读书方法,提高阅读能力,我们要敢于放手,不要将课文"嚼"得过烂再"喂"给学生,教师的作用就在于适当点拨和引导。这就对教师提出了更严的要求,我们要注意讲读与自读的知识迁移与能力训练的衔接,完成"教"向"学"的过渡转化,还要加以充分恰当的引导和适度的调控,促进学生阅读水平的提高。 粗知大意并不是浅知。略读课文不像精读课文那么严格细致,只要求粗知文章大意。但这里所说的"粗知"是相对精读课文而言的,略读课文少了识字、学词学句等许多头绪,教总之,精读课文的教学,要紧扣教材的特点,精心设计教学方案,要注意发挥学生学习的积极性和主动性,引导学生进行探究、合作学习,要充分发挥教师的主导作用,要协调好个体学习与合作学习的关系,整体感悟和重点探究的关系,从而提高教学效率。而略读课文首先是在阅读内容上应"不求甚解",在阅读技能培养上更强调运用。如叶老所说:"就教学而言,精读是主体,略读只是补充;但是就效果而言,精读是准备,略读才是应用。"略的是教师的教,不能略的是学生的学。我们应该把"略读"提升到一个应有的高度,以求最大限度地扩张课堂,拓展课文,促进"学生语文素养的形成和发展"。 M1U2Home alone Act One Mom and Dad arrive back from vacation a day earlier than expected. The curtains are closed and the living room is dark when Mom and Dad enter. Dad: It’s so nice to be home! Mom: Yes, I can’t wait to surprise the boys! Suddenly the door opens and a soccer ball flies through the room. Eric runs in after it, followed by a big dog, walking very slowly. Eric: Mom! Dad! You’re back early! (looking around room, sounding frightened) But, but … you weren’t supposed to come home until tomorrow! The dog slowly walks to Mom and Dad. Mom: (bending to touch dog) Eric, he’s so tired and hungry! (looking at table) The money for dog food is gone, but Spot looks like he is starving! What did you do with the cash we left? Dad: And look at this room—garbage all over the place! Where is your brother? (shouting angrily) Daniel! Daniel: (running into room) Mom, Dad, I can explain … Dad opens the curtains and light comes into the room. The room is in a mess, with pizza boxes on the floor and dirty dishes in the sink. In the corner, there is a garbage can around which are pieces of garbage and waste paper. Mom and Dad both turn towards Daniel. Dad: (sounding very angry) Listen to me, young man—we left you in charge! We thought you could act like an adult, but look at the mess! I don’t know why the house is so dirty ... Mom: Daniel, we thought you were an adult, a person who would make good decisions ... Dad: How can we trust you any mo re? We won’t tolerate such behavior in our house! Daniel: (shouting) Stop shouting at me. I’m still a teenager! Why is everything always my fault? Daniel runs into his bedroom and shuts the door angrily. Mom and Dad look at each other as lights go out. End of Act One Act Two, Scene One Daniel and Eric’s bedroom. Eric sits on his bed. Daniel has his arms crossed and looks upset. Daniel: They never even gave me a chance to defend myself. I hate them! Eric: You don’t h ate them. I can tell them we had an emergency. Then they won’t be mad any more. Daniel: No, don’t tell them anything. Anyhow, they didn’t trust me. They don’t deserve an explanation. Let them think what they want. Eric: But Daniel, if they knew that Spot was sick and we used the money to take him to the clinic ... Daniel: And that we spent all of yesterday waiting there for him, and that is why we had no time to clean the house ... but no, Eric, why didn’t they ask me what happened instead of shouting at me? Act Two, Scene Two 谈略读课文的教学方法 人教版教材中从三年级开始就有略读课文,三上的32篇课文中有8篇是略读,占总数的25%;四上的32篇课文中有14篇是略读课文,约占总数的44%;五六年级则占到了50%左右。从中,我们可以看出编辑的用心。但是,很多老师把略读课文上成精读课,也存在着略读课文怎么上的问题,什么可以略,什么不可以略?略读课文可以上成精读课文吗?还有,学生的阅读能力不高,一个重要的原因是:教学中,略读课文把握的不好。这些问题都困扰着我们,所以,略读课文的专项研讨变得非常重要。 叶圣陶先生曾经指出:“就教学而言,精读是主体,略读只是补充;但是就效果而言,精读是准备,略读才是应用。”“如果只注意于精读,而忽略了略读,功夫便只做得一半。”这些话十分精辟地阐述了精读与略读的关系,道出了略读课文教学的重要功能。《语文课程标准》也指出:“学会运用多种阅读方法。”“加强对阅读方法的指导,让学生逐步学会精读、略读和浏览。”一、明确目标 人教版课标实验教材对略读课的教学要求是:内容上,理解内容的要求要低于精读课文,一般是“粗知文章大意”,只要抓住重点、难点,帮助学生大体理解课文内容即可,词句的理解不作为重点;方法上,教师要更加放手,要让学生运用在精读课文学习中获得的知识与方法,自己把课文读懂,在实践中掌握读书方法,提高阅读能力。二、因“材”施教 教材虽然不是唯一的教学资源,但它是重要的教学资源。 1.根据课文结构因“材”施教。每一篇略读课文前都有阅读提示。阅读提示从激发阅读兴趣入手,一般提出一两个问题,侧重引导学生理解主要内容、揣摩教学思路,或引导学生从所阅读的文章扩展开去。对大多数略读课文来讲,教师根据阅读提示组织教学活动,皆可做到“提纲挈领”;学生根据阅读提示自主阅读学习。 2.根据课文特点因“材”施教每一篇略读课文,皆有它自己的特点。我们应根据课文自身的特点展开教学,既遵循文本正确的价值取向,又注意提高学生的学习兴趣。三、把握好教学的尺度 在略读课文的教学中,要把握好尺度,既不搞过细剖析,也不作随意教学,要确立略读课文教学的明确地位,发挥其应有的作用。教学中尤其要注意以下几点: 1.让学生自主学习。 略读课文要突出“略”字,略的是教师的精讲细说,强调“以学生自读为主”,让学生唱“主角”。教师不要包办代替,不要强行“灌输”,充分信任学生。教师甚至可以组织学生围绕某个重点、难点问题展开讨论、辩论,充分展示学生的独特思维和阅读体验,从而使学生既获得了知识,又锻炼了能力。 2.重“导”轻“教” 自读课文的教学强调“以学生的自读为主”,并不意味着忽视教师的“主导”作用。相反,略读课要真正达到“略”,教师就必须更加注重引导和调控。为了使教学中充分体现出“导”,教师应策划好课堂教学方法,及时、准确地评价学生的表现,激发学生的兴趣和自信心。 同时,略读课强调的是让学生学会阅读,教师要教学生如何去快速阅读,如何把握文章内容,而不是教学生具体的字、词、句等实实在在的考试知识。重“导”轻“教”,不是让教师退居幕后,而是要求教师发挥主导作用,引领学生深入、有效地开展有层次的阅读。 3.略读教学不等于略读,粗知大意并不是浅知。 略读教学是一种教学活动,它承担着更为广泛的任务,不仅是让学生在略读实践中获取信息,更重要的是要让学生在不断的实践中学习、学会略读方法,从而培养学生的阅读能力。教学中要授之以法,“教是为了不教。” 四年级下学期英语课文中文翻译 Lesson 1: Sara:你喜欢音乐吗,阳阳? 阳阳:是的,我喜欢。我非常喜欢音乐。我听各种各样的音乐。但我最喜欢流行歌曲。 Sara:我也喜欢流行歌曲。但我最喜欢高雅音乐。我会钢琴。 阳阳:我会小提琴。有时间我们一起玩。 Lesson 2: 果果:你养宠物吗,玲玲? 玲玲:不,我不养。但我喜欢猫。猫都很安静。猫也很可爱。 果果:我喜欢狗。狗是我们的好朋友。狗对我们帮助很大。 玲玲:是的。但狗太吵了。狗见了陌生人会叫。 Lesson 3: 爸爸:放学后你喜欢做什么,麦克? 麦克:我喜欢做飞机模型。 爸爸:将来你想做什么? 麦克:我长大后想开真飞机。有朝一日我想飞到月球和火星。 爸爸:那也就是说你想当宇航员。你真棒! Lesson 5: 妈妈:你怎么了,宝宝? 宝宝:我觉得不舒服。我头很疼,妈妈。 妈妈:恐怕你是病了。你需要去看病。 宝宝:今天我不能上学了,太糟糕了。 Lesson 6: 宝宝:医生,我觉得不舒服。我头疼得厉害。 医生:唉!你发高烧了。张开嘴说“啊---”。 宝宝:你需要给我验血吗? 医生:恐怕需要。你得了流感。这种药每天吃三次。你很快就会康复的。Lesson 7: 医生:你怎么了? 麦克:我的右腿伤得很严重,医生。 医生:我来看看。哪疼啊? 麦克:膝盖附近疼。 医生:恐怕我们需要拍一个X光片。 Lesson 9: 麦克:对不起,你能告诉我去图书馆的路吗? 男人:哦,好的。就在那栋棕色楼的五层。 麦克:是在楼梯的右边还是左边呢? 男人:在右边的第三个房间。 麦克:太谢谢你了。 男人;我很乐意。 Lesson 10: 女人:对不起。我正在找医院。我怎么才能到那呢? 毛毛:就在附近。你看到那座有一个白色十字的灰色大楼了吗? 女人:看到了。在那座红色大楼的右边。 毛毛:我正好顺路。我带你去吧。 女人:你太好了。真谢谢你。 毛毛:不客气。 Lesson 11: 女人:对不起,请问车站在哪啊?远吗? 果果:不远。继续往前开车然后左转。你会在你的右边看见一个标志。 女人:我看到了。我应该先往前开然后左转。我会在我的右边看见一个标志。果果:是的。那个标志是红色和黄色的。你一定能看见。 女人:多谢。祝你一天过得愉快。 果果:你也是。 Lesson 15: 果果:五一就要到了。我们也叫它劳动节。在五月一日。 Sara:但是在美国劳动节是在九月的第一个星期一。 果果:在中国,劳动节是一个劳动人民的节日。那天你要干什么? Sara:我们要去参观长城。 Lesson 16: 玲玲:儿童节就要到了。在六月一号。 麦克:儿童节你干什么? 玲玲:全国的孩子们都庆祝这个节日。在那一天我们去电影院,公园,和博物馆。我们也会收到父母送的礼物。 麦克:我们学校每年都举办聚会吗? 玲玲:是的。你们肯定会过得很愉快的。 Lesson 17: 浅谈生物信息学在生物医药方面的应用 生物信息学(Bioinformatics)是在生命科学的研究中,以计算机为工具对生物信息进行储存、检索和分析的科学。它是当今生命科学和自然科学的重大前沿领域之一,同时也将是21世纪自然科学的核心领域之一。其研究重点主要体现在基因组学(Genomics)和蛋白质组学(Proteomics)两方面,具体说就是从核酸和蛋白质序列出发,分析序列中表达的结构功能的生物信息。 具体而言,生物信息学作为一门新的学科领域,它是把基因组DNA序列信息分析作为源头,在获得蛋白质编码区的信息后进行蛋白质空间结构模拟和预测,然后依据特定蛋白质的功能进行必要的药物设计。基因组信息学,蛋白质空间结构模拟以及药物设计构成了生物信息学的3个重要组成部分。是结合了计算机科学、数学和生物学的一门多学科交叉的学科。它依赖计算机科学、工程和应用数学的基础,依赖实验和衍生数据的大量储存。他将各种各样的生物信息如基因的DNA序列、染色体定位、基因产物的结构和功能及各种生物种间的进化关系等进行搜集、分类和分析,并实现全生命科学界的信息资源共享。 从生物信息学研究的具体内容上看,生物信息学可以用于序列分类、相似性搜索、DNA序列编码区识别、分子结构与功能预测、进化过程的构建等方面的计算工具已成为变态反应研究工作的重要组成部分。针对核酸序列的分析就是在核酸序列中寻找过敏原基因,找出基因的位置和功能位点的位置,以及标记已知的序列模式等过程。针对蛋白质序列的分析,可以预测出蛋白质的许多物理特性,包括等电点分子量、酶切特性、疏水性、电荷分布等以及蛋白质二级结构预测,三维结构预测等。 基因芯片是基因表达谱数据的重要来源。目前生物信息学在基因芯片中的应用主要体现在三个方面。 1、确定芯片检测目标。利用生物信息学方法,查询生物分子信息数据库,取得相应的序列数据,通过序列比对,找出特征序列,作为芯片设计的参照序列。 2、芯片设计。主要包括两个方面,即探针的设计和探针在芯片上的布局,必须根据具体的芯片功能、芯片制备技术采用不同的设计方法。 3、实验数据管理与分析。对基因芯片杂交图像处理,给出实验结果,并运用生物信息学方法对实验进行可靠性分析,得到基因序列变异结果或基因表达分析结果。尽可能将实验结果及分析结果存放在数据库中,将基因芯片数据与公共数据库进行链接,利用数据挖掘方法,揭示各种数据之间的关系。 大规模测序是基因组研究的最基本任务,它的每一个环节都与信息分析紧密相关。目前,从测序仪的光密度采样与分析、碱基读出、载体标识与去除、拼接与组装、填补序列间隙,到重复序列标识、读框预测和基因标注的每一步都是紧 四 川 大 学 网 络 教 育 学 院 模 拟 试 题( A ) 《管理运筹学》 一、 单选题(每题2分,共20分。) 1.目标函数取极小(minZ )的线性规划问题可以转化为目标函数取极大的线性规 划问题求解,原问题的目标函数值等于( C )。 A. maxZ B. max(-Z) C. –max(-Z) D.-maxZ 2. 下列说法中正确的是( B )。 A.基本解一定是可行解 B.基本可行解的每个分量一定非负 C.若B 是基,则B 一定是可逆D.非基变量的系数列向量一定是线性相关的 3.在线性规划模型中,没有非负约束的变量称为 ( D ) 多余变量 B .松弛变量 C .人工变量 D .自由变量 4. 当满足最优解,且检验数为零的变量的个数大于基变量的个数时,可求得( A )。 A.多重解 B.无解 C.正则解 D.退化解 5.对偶单纯型法与标准单纯型法的主要区别是每次迭代的基变量都满足最优检验但不完全满足 ( D )。 A .等式约束 B .“≤”型约束 C .“≥”约束 D .非负约束 6. 原问题的第i个约束方程是“=”型,则对偶问题的变量i y 是( B )。 A.多余变量 B.自由变量 C.松弛变量 D.非负变量 7.在运输方案中出现退化现象,是指数字格的数目( C )。 A.等于m+n B.大于m+n-1 C.小于m+n-1 D.等于m+n-1 8. 树T的任意两个顶点间恰好有一条( B )。 A.边 B.初等链 C.欧拉圈 D.回路 9.若G 中不存在流f 增流链,则f 为G 的 ( B )。 A .最小流 B .最大流 C .最小费用流 D .无法确定 10.对偶单纯型法与标准单纯型法的主要区别是每次迭代的基变量都满足最优检验但不完全满足( D ) A.等式约束 B.“≤”型约束 C.“≥”型约束 D.非负约束 二、多项选择题(每小题4分,共20分) 1.化一般规划模型为标准型时,可能引入的变量有 ( ) A .松弛变量 B .剩余变量 C .非负变量 D .非正变量 E .自由变量 2.图解法求解线性规划问题的主要过程有 ( ) A .画出可行域 B .求出顶点坐标 C .求最优目标值 D .选基本解 E .选最优解 3.表上作业法中确定换出变量的过程有 ( ) A .判断检验数是否都非负 B .选最大检验数 C .确定换出变量 D .选最小检验数 E .确定换入变量 4.求解约束条件为“≥”型的线性规划、构造基本矩阵时,可用的变量有 ( ) A .人工变量 B .松弛变量 C. 负变量 D .剩余变量 E .稳态 变量 5.线性规划问题的主要特征有 ( ) A .目标是线性的 B .约束是线性的 C .求目标最大值 D .求目标最小值 E .非线性 三、 计算题(共60分) 1. 下列线性规划问题化为标准型。(10分) 精读课文和略读课文的区别与教学重点 在小学语文教材中,精读课文的编排占据主体地位。就其涵盖的内容而言,包含了字词、句、段、篇等语文基本功训练项目,范围十分广泛,知识含量极高,是进行语文基本功训练的主要凭借。由此可见,精读课文的教学在小学语文教学中处于重中之重的地位,它是完成小学语文教学任务的重要途径。但是,就篇幅而言,略读课文在小学中段所占比例较小,但到了高段则是五五分成。因此略读课文的教学同样不可忽视。今天,我就以小学三年级的第一单元的教学为切入点来谈谈精读课文和略读课文教学的区别。 一、从教学目标上谈。 本单元文前三篇课文为精读课文,后一篇是略读课文,四篇课文从多角度地展现了大自然的美。我们可以从这些绿柳飞燕、鸟语花香、潺潺流水中,感受春天的来临,倾听大自然的声音,欣赏大自然的美景,从而激发热爱大自然的感情。我认真阅读了四篇课文,分析了教材说明,确立了: 精读课文的教学目标是: 1、加强词、句的训练。 2、重视朗读的指导和训练。朗读是最经常、重要的阅读训练,也是理解课文内容,也是体会课文思想感情的主要方法。 3、了解作者观察的方法,积累文中的优美句段。 阅读课文的教学目标: 1、用多种阅读方法获取重要信息,进行略读能力的训练,粗知文章的大意。略读课上,要更注重略读方法的运用,如扫读、跳读等,训练学生快速默读的方法,提高阅读的速度。 2、通过自主阅读获取信息,培养独立阅读能力,同时体现教师的引导作用。 3、加强课内外联系,沟通课内外阅读,适度拓展和延伸。略读课文的教学应该成为联系课内外阅读的桥梁,让学生在教师的指导下,尝试运用精读课.习得的方法独立阅读,实现向课外完全独立阅读的过渡,适当向课外拓展、延伸。 二、从教学过程上谈。 就精读课文《荷花》而言,可以这样教学: 1、精读。特级教师林润生是这样说的:"精读课文的教学,应让学生拥有完整的阅读过程,经历精读与略读,朗读与默读,自悟与交流,思考与想象,课文阅读与资料收集利用,感知内容与领悟感情,理解与积累运用语言的过程。"他是这样设计《荷花》这一课的:课始让学生比赛谁对荷花了解的多少,课中通过五读课文(一读整体感知,二读领悟感情,三读再悟情感,四读升化情感,五读积累语句),让学生抓住重点词句朗读、揣摩、体会情感,联系上下文和联系有关资料深入领会重点语句的含义,深刻感受课文情感--大自然的优美。课末让学 人教版七年级上册英语课文翻译 P4 Daming and I’min Class One. I’mfrom China and I’mChinese. I’mfrom Beiji My name’s my friend. ng. Beijing is a big city. Lingling’s in my class. She’s Lingling. I’mnot from England and I’mnot English. I’mChinese. I’min Class O My name’s in my class. W from Beijing and he’s ne. Daming is my friend. We’re twelve years old. He’s e’re good friends. Wang Hui and I’mChinese. I’mfrom Shanghai. I’mthirteen years old. I’min Cl My name’s ass One with Daming and Lingling. They are my friends. 我的名字叫大明,和我在一班。我来自中国,和我是中国人。我来自北京。北京是个大城市。 玲玲在我的班。她是我的朋友。 我的名字叫玲玲。我不是来自英国,和我也不是英国人。我是中国人。我在一班。大明是我 的朋友。我们12岁了。他来自北京,和他在我的班。我们是好朋友。 我的名字叫王辉,和我是中国人。我不是来自北京。我来自上海。我13岁了。我在一班和大明、玲玲。他们是我的朋友。 P8 Miss Li: Please welcome Betty and Tony to our school. They are from Beijing International School. This is Betty. Betty. I’mfrom America. I’m13 years old and I’m a student. I ca Betty: Hello. My name’s speak Chinese. Th n play football and I can play basketball. I can speak English but I can’t my friend. is is Tony. He’s Tony. I’m11 years old. I’mfrom England and I can speak English Tony: Hello. My name’s . I can play football and table tennis, and I can ride a bike. Lingling: Can you swim? speak Chinese! Tony: No, I can’t. And I can’t 李小姐:请欢迎贝蒂和托尼来我们学校。他们来自北京国际学校。这是贝蒂。 贝蒂:你好。我的名字叫贝蒂。我来自美国。我十三岁,和我是一个学生。我能踢足球,和 我能打篮球。我能说英语但是我不能说汉语。这是托尼。他是我的朋友 托尼:你好。我的名字叫托尼。我十一岁了。我来自英国,和我能说英语。我能踢足球和打 乒乓球,和我能骑一辆车。 四川大学网络教育学院模拟试题( A ) 《管理运筹学》 一、单选题(每题2分,共20分。) 1.目标函数取极小(minZ)的线性规划问题可以转化为目标函数取极大的线性规 划问题求解,原问题的目标函数值等于(C)。 A. maxZ B. max(-Z) C. –max(-Z) D.-maxZ 2.下列说法中正确的是(B)。 A.基本解一定是可行解B.基本可行解的每个分量一定非负 C.若B是基,则B一定是可逆D.非基变量的系数列向量一定是线性相关的3.在线性规划模型中,没有非负约束的变量称为( D ) 多余变量B.松弛变量C.人工变量D.自由变量 4. 当满足最优解,且检验数为零的变量的个数大于基变量的个数时,可求得 ( A )。 A.多重解B.无解C.正则解D.退化解5.对偶单纯型法与标准单纯型法的主要区别是每次迭代的基变量都满足最优检验 但不完全满足( D )。 A.等式约束 B.“≤”型约束 C.“≥”约束 D.非负约束 y是( B )。 6. 原问题的第i个约束方程是“=”型,则对偶问题的变量i A.多余变量B.自由变量C.松弛变量D.非负变量 7.在运输方案中出现退化现象,是指数字格的数目( C )。 A.等于m+n B.大于m+n-1 C.小于m+n-1 D.等于m+n-1 8.树T的任意两个顶点间恰好有一条(B)。 A.边B.初等链C.欧拉圈D.回路9.若G中不存在流f增流链,则f为G的( B )。 A.最小流 B.最大流 C.最小费用流 D.无法确定 10.对偶单纯型法与标准单纯型法的主要区别是每次迭代的基变量都满足最优检验 但不完全满足( D ) A.等式约束B.“≤”型约束C.“≥”型约束D.非负约束二、多项选择题(每小题4分,共20分) 1.化一般规划模型为标准型时,可能引入的变量有() A.松弛变量 B.剩余变量 C.非负变量 D.非正变量 E.自由变量 2.图解法求解线性规划问题的主要过程有() A.画出可行域 B.求出顶点坐标 C.求最优目标值 D.选基本解 E.选最优解 3.表上作业法中确定换出变量的过程有() A.判断检验数是否都非负 B.选最大检验数 C.确定换出变量 D.选最小检验数 E.确定换入变量 4.求解约束条件为“≥”型的线性规划、构造基本矩阵时,可用的变量有()A.人工变量 B.松弛变量 C. 负变量 D.剩余变量 E.稳态变量 5.线性规划问题的主要特征有() A.目标是线性的 B.约束是线性的 C.求目标最大值 D.求目标最小值 E.非线性 三、计算题(共60分) 1. 下列线性规划问题化为标准型。(10分) 1 / 17 小学语文新课程标准教材 语文教案( 2019 — 2020学年度第二学期 ) 学校: 年级: 任课教师: 语文教案 / 小学语文 / 小学五年级语文教案 编订:XX文讯教育机构 精读与略读课文 教材简介:本教材主要用途为通过学习语文的内容,培养学生的阅读能力、交流能力,学习语文是为了更好的学习和工作,为了满足人类发展和实现自我价值的需要,本教学设计资料适用于小学五年级语文科目, 学习后学生能得到全面的发展和提高。本内容是按照教材的内容进行的编写,可以放心修改调整或直接进行教学使用。 一个人要积累知识,就必须读书。对重要的文章和书籍,要认真读反复读,要逐字逐句地深入钻研,对重要的语句和章节所表达的思想内容还要做到透彻理解。这就是精读。我们所读的课文,都是经过精心编选的,对我们学习语文很有帮助,因此须要精读。 然而,人的精力是有限的,而书籍却浩如烟海,谁也不可能读完所有的书,更不可能对每本书每篇文章都去精读。为了获取更多的知识,更多的信息,又必须读大量的书,因此我们还要学会略读。 略读就大略的读。略读可以增加阅读量。通过略读,可以用较少的时间浏览大量的书刊,从而扩大自己的知识面,获得对有关读物的总的认识,便于以后需要的时候去查找。略读又是精读的基础。通过泛读,可以在很短的时间内知道一篇文章或一本书的基本内容,从而确定它是否须要精读,或哪些地方需要精读。 怎样进行泛读呢? 如果面对一大堆读物,我们可以将每本书的内容提要、前言、章节、目录等很快地从头 到尾看一遍,这样就能大致了解每本书的梗概、特点和应用范围。对于一本读物来说,可以几段几段地粗读,也可几页几页地翻阅,而不要探究某个字、词或句子的意思。俗话说的“一目十行”就是指这种走马观花式的快速阅读方法。 为了提高读书速度,略读通常采用默读的方式。 当然,泛读也并不是读完了事,每次泛读完毕,也应想一下所读的东西,最好用简炼的语言概括一个读物内容。 只要我们善于把精读和略读结合起来,就能取得最佳的读书效果。 XX文讯教育机构 WenXun Educational Institution 人教版七年级上册英语课文中文翻译完整版 预习单元1—3 Starter Unit 1 Section A 1a 早上好,海伦!嗨,鲍勃!早上好,艾丽斯!喂,弗兰克!喂,埃里克!早上好,戴尔! Section B 1 下午好,戴尔!嗨,辛蒂!你好吗?我很好,多谢。你好吗?我很好。 Self Check 1 嗨喂上午下午晚上好的好谢谢好的 4 年龄手他床Just for Fun 晚上好! Starter Unit 2 Section A 1b 这用英语怎么说?一张地图。一个橙子。 Section B 1a 用英语说这是什么?一把钥匙。请拼一下。 Self Check 3夹克衫艾丽斯地图钥匙橙子戴尔海伦格雷斯辛蒂鲍勃钢笔弗兰克被子埃里克尺子 4 名字能他腿美好的牛奶去狗 Starter Unit 3 Section A 1a 这是什么?它是字母V。它是什么颜色的?它是红色的。这是什么?它是字母Z。它是黑白相间的。 Section B 1b 这把钥匙是黄色的。这把尺子是蓝色的。这支钢笔是红色的。Self Check 它是绿色的。 字母意思(铅笔芯)硬黑激光唱片英国广播公司停车(美国)全国篮球协会千克小号/中号/大号不明飞行物中央电视台联合国 一单元 Section A 1a 我是吉娜。见到你真高兴。 Grammer Foucs 你的名字是什么?我的名字是詹妮。我是詹妮。他的名字是什么?他的名字是托尼。她的名字是什么?她的名字是吉娜。 Section B 1c 你的电话号码是什么,李欣?是281-6926。 3b 她的电话号码是什么?她的姓氏是什么?她的名字是什么? Self Check 1 我她是身份证什么我的喂你的他的她的名姓电话号码 Just for Fun你的名是什么?ZIG。你的姓是什么?ZAG。 二单元 Section A 1a 那是你的双肩背包吗?不,不是。它是他的双肩背包。这是你的铅笔吗?是的,它是。它是我的铅笔。这是你的尺子吗?不,不是。它是她的尺子。铅笔钢笔书橡皮擦尺子铅笔盒书包卷笔刀词典 2b 请原谅,索尼亚。这是你的铅笔吗?是的,谢谢。那是我的橡皮。简,这是你的尺子吗?不,不是。它是她的尺子。好的,这是我的书。这是你的铅笔盒,简。 Section B 1a 棒球手表电子游戏机身份证钥匙笔记本戒指钢笔 1b 这是什么?一块手表。你怎样拼写它?…… 3a 这是你的手表吗?给艾伦打电话495—3539。艾伦,失物招领箱中的电子游戏是你的吗?尼克招领:笔记本这是你的笔记本吗?请给玛丽打电话。电话#235—0285。寻物:我的学生证。我的名字是托尼。请打电话685精读课文和略读课文的授课区别
牛津英语必修二课文原文及中文翻译
学习略读课文方法
英语课文中文翻译
浅谈生物信息学在生物医药方面的应用
管理运筹学模拟试题及答案
精读课文与略读课文的区别
人教版英语七年级上册全册课文中文翻译
管理运筹学模拟试题附答案
五年级语文:精读与略读课文
人教版七年级上册英语课文中文翻译完整版