Porosity influence on the shear strength of granular material-clay mixtures
Engineering Geology 58(2000)125–136
www.elsevier.nl /locate /enggeo
Porosity in?uence on the shear strength of granular material–
clay mixtures
Luis E.Vallejo a,*,Roger Mawby b
a Department of Civil and Environmental Engineering,949Benedum Hall,University of Pittsburgh,Pittsburgh,PA 15261,USA
b Department of Civil and Environmental Engineering,Michigan State University,East Lansing,MI 48823,USA
Received 29June 1999;accepted for publication 17May 2000
Abstract
Materials forming part of rock ?ll dams,glacial tills,mud?ows,debris ?ows,soli?uction sheets,residual and colluvial soil deposits have a distinct structure,consisting of a mixture of large particles (gravel or hard clay fragments)and a soft matrix of clay.In order to analyze the stability of slopes made of granular material–clay mixtures,a measure of their shear strength is https://www.360docs.net/doc/a45143670.html,boratory tests on these types of mixtures have indicated that their shear strength will depend upon the relative concentrations of the large particles and the clay.If the percentage by weight of the granular material in the granular material–clay mixture was >75%,the shear strength of the mixture was basically that of the granular material alone.When the concentration by weight of the granular material in the mixtures was <40%,the shear strength of the mixtures was basically that of the clay that surrounded the granular material.For the case in which the percentage of the granular materials in the solids mixture was between 40and 75%,the shear strength of the mixtures was partially controlled by the granular phase.To date,no explanation has been put forward to account for why these limits of granular material in the mixtures exist at which it either controls,partially controls or has no control at all on the shear strength of the mixtures.This study presents an explanation for the existence of these limits.This explanation is based upon the resulting porosity of the mixtures.?2000Elsevier Science B.V.All rights reserved.
Keywords:Fabric;Porosity;Shear strength;Soil mixtures
1.Introduction
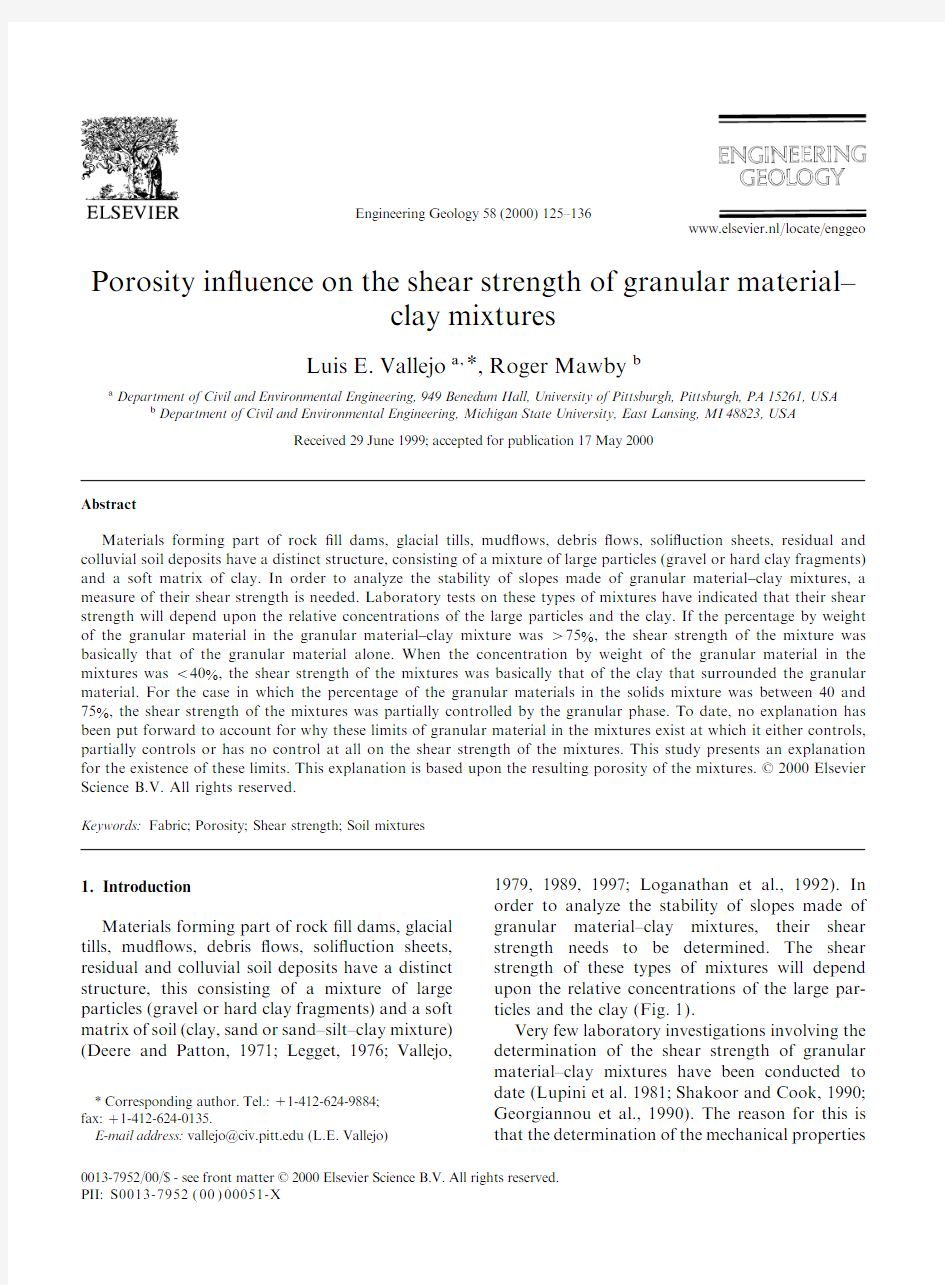
1979,1989,1997;Loganathan et al.,1992).In order to analyze the stability of slopes made of Materials forming part of rock ?ll dams,glacial granular material–clay mixtures,their shear tills,mud?ows,debris ?ows,soli?uction sheets,strength needs to be determined.The shear residual and colluvial soil deposits have a distinct strength of these types of mixtures will depend structure,this consisting of a mixture of large upon the relative concentrations of the large par-particles (gravel or hard clay fragments)and a soft ticles and the clay (Fig.1).
matrix of soil (clay,sand or sand–silt–clay mixture)Very few laboratory investigations involving the (Deere and Patton,1971;Legget,1976;Vallejo,
determination of the shear strength of granular material–clay mixtures have been conducted to date (Lupini et al.1981;Shakoor and Cook,1990;*Corresponding author.Tel.:+1-412-624-9884;Georgiannou et al.,1990).The reason for this is fax:+1-412-624-0135.
E-mail address:vallejo@https://www.360docs.net/doc/a45143670.html, (L.E.Vallejo)that the determination of the mechanical properties
0013-7952/00/$-see front matter ?2000Elsevier Science B.V.All rights reserved.PII:S0013-7952(00)00051-X
126L.E.Vallejo,R.Mawby/Engineering Geology58(2000)125–136
of such mixtures requires the use of large loading the few triaxial and direct shear tests conducted systems that can simulate?eld stress conditions
by various researchers on granular material–clay (Fragaszy et al.,1991;Donaghe and Torrey,1994)mixtures.These tests used mixture proportions (Fig.1).Table1indicates the results of some of
that varied between0and100%of either gravel
Fig.1.Rock–soil mixtures resulting from weathering.
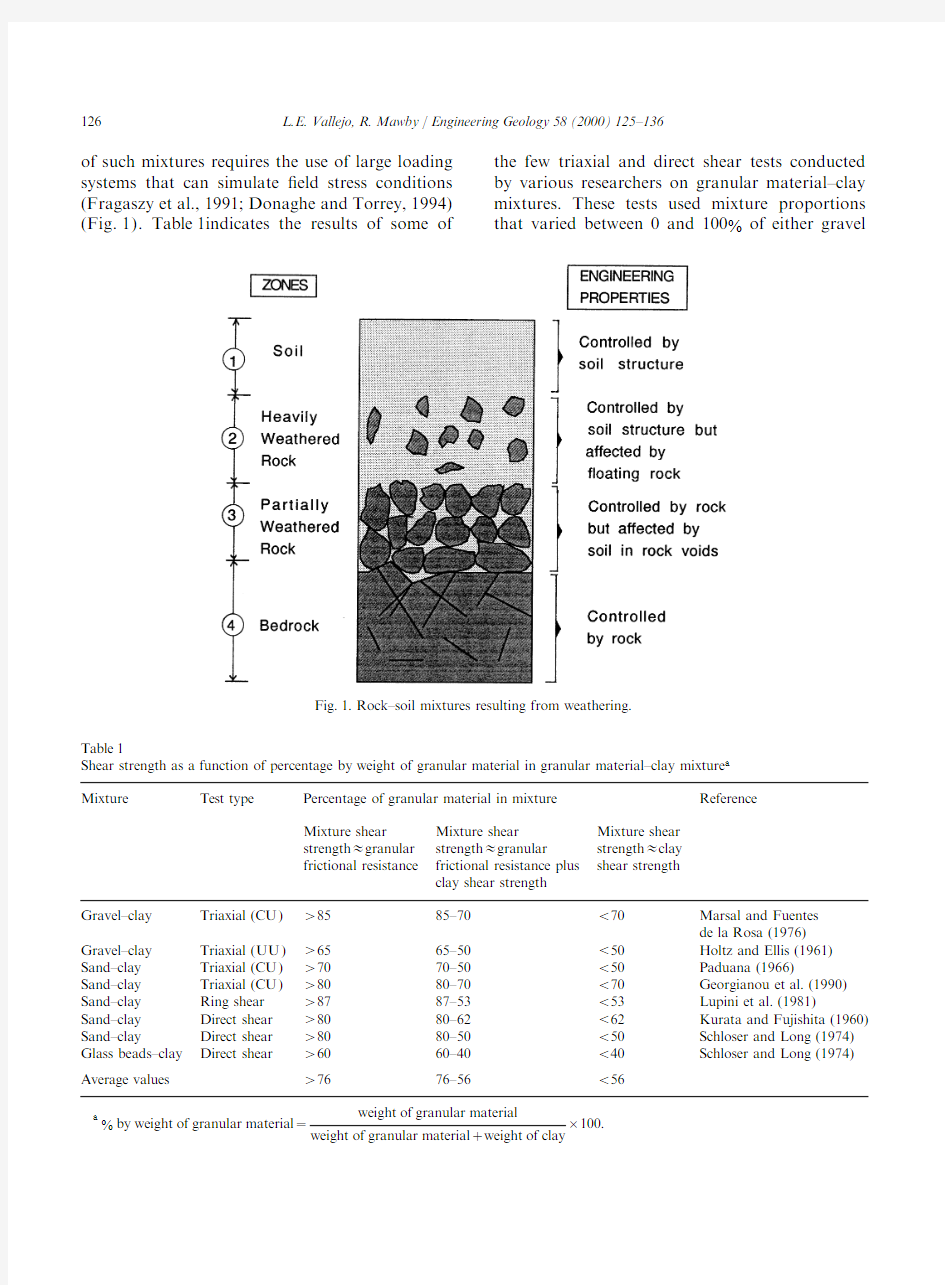
Table1
Shear strength as a function of percentage by weight of granular material in granular material–clay mixture a
Mixture Test type Percentage of granular material in mixture Reference
Mixture shear Mixture shear Mixture shear
strength#granular strength#granular strength#clay
frictional resistance frictional resistance plus shear strength
clay shear strength
Gravel–clay Triaxial(CU)>8585–70<70Marsal and Fuentes
de la Rosa(1976)
Gravel–clay Triaxial(UU)>6565–50<50Holtz and Ellis(1961) Sand–clay Triaxial(CU)>7070–50<50Paduana(1966)
Sand–clay Triaxial(CU)>8080–70<70Georgianou et al.(1990) Sand–clay Ring shear>8787–53<53Lupini et al.(1981)
Sand–clay Direct shear>8080–62<62Kurata and Fujishita(1960) Sand–clay Direct shear>8080–50<50Schloser and Long(1974) Glass beads–clay Direct shear>6060–40<40Schloser and Long(1974) Average values>7676–56<56
a%by weight of granular material=weight of granular material
×100.
weight of granular material+weight of clay
127
L.E.Vallejo,R.Mawby/Engineering Geology58(2000)125–136
or sand(representing the granular phase of the granular material in the mixtures was<56%,the
shear strength of the mixtures was controlled by mixtures)and clay.The mixtures were subjected
the clay and was basically equal to that of the clay to shear under undrained conditions in the triaxial
with zero granular material.For the case in which tests or were freely draining during the direct shear
the percentage of the granular materials in the tests.In either case,it was determined that the
solids mixture was between56and76%,the shear shear strength of the mixtures was controlled by
strength of the mixtures was partially controlled either the granular material or the clay depending
by the granular phase.That is,if the concentration upon their relative concentrations by weight.
by weight of the granular phase in the solids Table1indicates the percentages of granular mate-
mixture was between56and76%,the shear rial in the mixtures that either controlled,partially
strength of the mixture was equal to the partial controlled or had no control at all on the shear
shear strength provided by the granular phase plus strength of the mixtures.
the partial shear strength provided by the clay Using the average of the reported values in
phase.To date,no explanation has been put for-Table1,it was determined that when the percen-
ward to account for why these limits of granular tage by weight of the granular material in the
material in the mixtures exist at which it either granular material–clay mixture was>76%,the
controls,partially controls,or has no control at shear strength of the mixture(determined from all on the shear strength of the mixtures.Next,an plots of the Mohr–Coulomb failure envelope)was explanation for the existence of these limits is basically that of the granular material alone.That presented.This explanation is based upon the is,for a percentage of granular material>76%,porosity developed by the mixtures.
the shear strength of the mixtures was controlled
by the granular material.When the concentration
by weight of the granular material in the mixtures 2.Porosity of granular material–clay mixtures was<56%,the shear strength of the mixtures was
basically that of the clay that surrounded the In order to gain an understanding of the reasons
why limits of concentration by weight of granular granular material.That is,if the percentage of
Table2
Proportions of sand and clay in the mixtures and the porosities developed
Test Sample composition Normal Porosity n
mix Percentage by weight of
No.stress(kPa)(%)sand in mixture,v
s (%)
Sand(N)Clay(N)
13054.237100 230102.136
330150.035
43154.23275 531102.130
631150.025
72354.23640 823102.135
923150.035
101354.24125 1113102.139
1213150.039
130354.2560 1403102.148
1503150.050
128L.E.Vallejo,R.Mawby /Engineering Geology 58(2000)125–136
material in granular material–clay mixtures exist gravity,G s
=2.65.The kaolinite clay used had a
liquid limit,LL =58%;a plastic limit,PL =28%;and at which it either controls,partially controls,or has no control at all on the shear strength of the a speci?c gravity,G s
=2.75.The average size of the
clay particles was found to be equal to 0.0042mm.mixtures,laboratory and theoretical analyses of the changes in porosity developed by mixtures of The dry sand–clay samples were prepared by mixing various proportions of Ottawa sand with dry sand and dry clay are presented.The changes in porosity that di ?erent proportions of sand and kaolinite clay at room conditions.The proportions by weight in Newtons used in the mixtures are clay develop when mixed together seems to explain why these limits exist.
described in Table 2.Each of the mixtures was ?rst placed in a sealed plastic bag and shaken until the sand–clay mixture appeared visually homogen-2.1.Samples used and laboratory procedure eous.The mixtures were then poured into a cylin-drical container made of plexiglass.The cylindrical For the laboratory investigation of the changes in porosity developed by mixtures of two di ?erent container had inside and outside diameters equal to 5and 8cm,respectively,and a height that materials,dry Ottawa sand and dry kaolinite clay were used.Dry samples were used in order to measured 12cm (Fig.2).While in the container,the sand–clay mixtures were subjected to three simplify the analysis.The Ottawa sand was a uniform material with a coe ?cient of uniformity,C u
=1.3;
di ?erent normal (con?ning)stresses that ranged in value between 54.2and 150kPa (Table 2).Three
an average diameter,d 50
=0.59mm;and a speci?c
Fig.2.Consolidation apparatus.
129
L.E.Vallejo,R.Mawby /Engineering Geology 58(2000)125–136di ?erent normal stresses were used to determine
their e ?ect on the porosity and the shear strength of the mixtures.
2.2.Porosity measurements
After the mixtures were poured into the container measuring 5cm in diameter,the vertical pressures were applied and left in place for a period of 24h.After this time,the porosity of the samples was measured using the following relationship:n mix =V 0
?[(W s /c s )+(W c /c c )]
V
(1)where V 0
is the bulk volume of the mixture 24h
after the application of the vertical stress,W s
and
W c
are the weights in Newtons of the sand and clay in the mixture,and c s and c c
are unit weights
of the sand grains and the clay particles.
Since the area of the sample in the plexiglass container is known (78.5cm 2),one only needs to measure the height of the sample after the applica-Fig.3.Changes in porosity of the sand–clay mixtures
tion of the normal stress in order to obtain the (s n
=54.2kPa).bulk volume,V 0
.The height of the sample was
easily measured through the walls of the transpar-An analysis of the laboratory results shown in ent container or estimated using the readings from Figs.3–5indicates that the porosity of the mix-a dial gauge attached to the piston that applies ture,n mix
,depends on the fractional concentration
the normal stress to the sample (Fig.2).The unit of each particle size population.The porosity of weights of the sand and clay particles were the mixture of large (sand)and small particles obtained from the product of the their speci?c (clay),is less than the porosities of the pure gravities and the unit weight of water.The values components.The porosity of the mixtures of the measured porosities and the respective con-decreases as the level of compaction increases,and centration by weight of the granular material in tends toward a minimum value regardless of the the mixtures are indicated in Table 2.normal stresses used for compacting the sample.This minimum value is poorly de?ned for low values of the normal stress (s n
=54.2–102.1kPa),
2.3.Relationship between porosity and
and is well de?ned as the level of normal stress concentration of granular material in mixtures increases (s n =150kPa).
Next,the values of porosities of the mixtures, 2.4.The theoretical minimum porosity and its n mix
,and their associated concentration by weight associated granular concentration
of the granular material,v s
,were plotted in
Figs.3–5.The concentration by weight,v s
,of the
To gain an understanding of the particle packing granular material was obtained using the following and porosity characteristics acquired by binary relationship:mixtures under di ?erent levels of compaction,Fig.6is used.Fig.6(A)shows four grains of sands v s =
W s W s +W
c
(2)
enclosing a void space.When a small amount of
130L.E.Vallejo,R.Mawby /Engineering Geology 58(2000)125–136
Fig.5.Changes in porosity of the sand–clay mixtures Fig.4.Changes in porosity of the sand–clay mixtures (s n
=150kPa).(s n
=102.1kPa).[Fig.6(C)]can be obtained with the help of Fig.7.clay is added to the sand,the bulk volume of the Fig.7represents a phase diagram indicating the clay (clay particles and their enclosed void space)solids and void components in the mixture.will occupy a portion of the sand void space Fig.7(A)represents the case when there is only [Fig.6(B)].If one continues adding clay to the sand in the mixture.Fig.7(B)represents the case sand,there will be a moment at which the sand when the voids in the sand are completely ?lled void will be completely occupied by the bulk by the bulk volume of clay.Fig.7(C)represents volume of the clay.At this point,the binary the case when there is only clay in the mixture.mixture develops the conditions of minimum The porosity of the pure sand,n s
,can be
porosity [Fig.6(C)](Furnas,1928;Westman and obtained from the following relationship Hugill,1930;McGeary,1961;Rogers et al.,1994).[Fig.7(A)]:
After the minimum porosity condition has been reached in the sand–clay mixture,there is no more n s =V
v V T
=V
v (3)space between the sand grains for any additional clay.Thus,if one adds clay beyond the minimum porosity conditions,the only way to increase the where V v
is the volume of the voids in the sand
and V T
is the total volume of the sand and is
volume of clay in the mixture is for the sand grains to become separated,and the clay become the assumed to be equal to 1.
The porosity of the sand clay mixture at mini-dominant material in the mixture.At this stage the sand grains ?oat in the clay matrix [Fig.6(D)mum porosity,n mix ?min,
can be obtained from
Fig.7(B).In the phase diagram shown in and (E)].
The minimum porosity of the mixture that Fig.7(B),V vc
represents the volume of the voids
in the bulk volume of clay ?lling the sand void occurs when all the void space in the sand is completely ?lled by the bulk volume of clay
space [Fig.6(C )].V c
is the volume of the clay
131
L.E.Vallejo,R.Mawby /Engineering Geology 58(2000)125–136
Fig.6.Changes of fabric in the sand–clay mixtures.
Fig.7.Phase diagram for the sand–clay mixtures.
particles and V s
is the volume of sand.Since the
be obtained from the following relationship [Fig.7(B)]:void volume in the sand,V vs
,is completely occu-pied by the bulk volume of clay,the following relationship applies to this case:
n c =
V vc V vc +V
c
(5)
n s =V vs =V vc +V c
(4)The porosity in the bulk volume of clay can
Using Eqs.(4)and (5),the following relation-
132L.E.Vallejo,R.Mawby /Engineering Geology 58(2000)125–136
ship is obtained for V vc
:
3.In?uence of the porosity on the shear strength of the sand–clay mixtures
V vc =n c n s
(6) 3.1.Shear strength of sand–clay mixtures
Thus,the minimum porosity of the mixture,n mix ?min
,can be obtained from the following rela-The dry sand–clay mixtures that were prepared tionship [Fig.7(B)]:
in the cylindrical container described in Fig.2,were also subjected to direct shear testing.After n mix–min =V
vc V T
=n c n
s (7)the samples were compacted under the normal stresses described in Table 2,they were removed and placed in a direct shear apparatus that encloses Therefore,the minimum porosity of the mixture cylindrical samples with the same diameter as the can be obtained form the product of the porosities compaction device shown in Fig.2.Also,the of the pure sand and the pure clay.
samples were sheared under the same normal The concentration of the sand in the mixture,stresses that were used during the static compac-v s–min
,at conditions of minimum porosity can be tion tests of the dry mixtures.That is,the normal obtained very easily using Eqs.(2)to (7)and stresses used in the direct shear testing of the Fig.7(A)and (B).This particular granular con-samples were equal to 54.2,102.1and 150kPa.A centration can be obtained from:
rate of displacement equal to 0.02mm min ?1was used during the direct shear tests.
v s–min =(1?n s )c
s n s (1?n c )c c +(1?n s )c
s
(8)
Fig.8shows a plot of the measured peak shear strengths,t peak,
versus the concentration by
weight,v s
,of the sand in the mixtures for the
The points of minimum porosity-concentration of granular material by weight have been plotted in Figs.3–5as point B.If one joins the porosities of the pure sand and the pure clay with the points
of minimum porosity,one obtains the plot ABC from which to obtain the theoretical porosities of the mixture as a function of the granular material concentration by weight ratio (Furnas,1928).The line AB represents the porosities-grain concen-tration in the mixture that is controlled by the sand grains (sand supported structure)[Fig.6(A–C)].The line BC represents the porosities-grain concentration in the mixture that is controlled by the clay particles (clay supported structure)[Fig.6(D and E)].Figs.3–5indicate that the theoretical minimum porosities are very di ?cult to achieve in practice.The samples instead devel-oped a range of low porosity values in the bound-ary between the sand-controlled structure and the clay-controlled structure.This range of low poros-ity values,however,could explain why limits of concentration by weight of granular material in granular material–clay mixtures exist at which it either controls,partially controls,or has no control at all on the shear strength of the mixtures Fig.8.Peak shear strength of the sand–clay mixtures as a func-tion of sand concentration and normal stress.
(Table 1).
133
L.E.Vallejo,R.Mawby /Engineering Geology 58(2000)125–136three normal stress levels used in the compaction and direct shear tests.Fig.9shows a plot of the
measured peak shear strengths,t peak
,versus the
porosity in the mixtures for the three normal stress levels used in the testing program.The Mohr–Coulomb failure envelopes for the di ?erent mix-tures are also shown in Fig.10.These failure envelopes were linear and changed in slope slightly depending on the concentration of sand in the mixtures.
An analysis of Fig.8indicates that the shear strength of the mixtures changed depending upon the concentration of the sand.When the sand concentration,v s
,was >75%,the shear strength
of the mixtures was basically equal to the shear strength of the pure sand [Fig.6(A–C)].When the sand concentration was >40%,the shear strength of the mixtures was basically that of the pure clay [Fig.6(E)].For intermediate values of sand concentration (between 40and 75%),the shear strength increased gradually from the shear Fig.9.Peak shear strength of the sand–clay mixtures as a func-strength provided by the pure sand to that pro-tion of porosity and normal stress.
vided by the pure clay.Thus,for sand concen-tration values between 40and 75%,the shear
Fig.10.Failure envelopes for the sand–clay mixtures.
134L.E.Vallejo,R.Mawby /Engineering Geology 58(2000)125–136
Table 3
strength of the mixture seems to be provided in Values of porosities and sand concentration ratios and trans-part by the frictional resistance between a portion ition points of the sand grains and in part by the shear strength of a portion of the clay in the mixture [Fig.6(D)].Points
Porosity Sand concentration (Figs.3–5)n mix (%)ratio v s (%)
The limits of shear strength measured in the sand–clay mixtures seem to follow the same general m 3175trends as those found by other researchers investi-o 3075gating granular material–clay mixtures (Table 1).q 2578
Average:76The ?ndings related to the in?uence of the n 3740granular phase concentration on the shear strength p 3540of granular material–clay mixtures were obtained r
26
60
from results of triaxial,direct shear and ring shear Average:47
tests on gravel–clay,glass beads–clay and sand–clay mixtures (Table 1,Fig.8).It is also interesting to note that size and gradation of the granular tests on the mixtures seems to indicate that this is in fact the case.Fig.8indicates that when the sand phase may also have an in?uence on the shear strength of granular material–clay mixtures.concentration was >75%,the shear strength of the mixtures was basically that of the pure sand.Studies conducted by Holtz and Gibbs (1956)and Fragaszy,et al.(1991)on gravel–sand mixtures The theoretical n mix –v s
relationships given by
the plot ABC in Figs.3–5indicate that theoreti-with the purpose of investigating the e ?ect that size,shape and gradation of the oversize particles cally the sand–clay mixtures should reach a mini-mum porosity at one single point given by the has on the shear strength of the mixtures indicated that the concentration of oversize particles had the intersection of the straight line AB (representing the n mix –v s
relationship for a sand controlled
most in?uence on shear strength of the mixtures.The concentration of the granular phase in granu-structure)and the straight line BC (representing the n mix –v s
relationship for a clay controlled struc-lar material–clay mixtures seems also to be the most in?uential parameter a ?ecting the shear ture).Thus,theoretically the change from sand controlled to clay controlled mixture is abrupt and strength of granular material–clay mixtures (Table 1and Fig.8).
takes place when the mixtures reach their minimum porosities (point B in Figs.3–5).The laboratory samples,however,did not reach the minimum 3.2.Relationship between porosity and shear strength
porosities in an abrupt way.After clay was added to the sand structure,the sand controlled mixtures reached their minimum porosities not abruptly but In Figs.3–5representing the laboratory rela-tionship between porosity and sand concentration gradually (points m,o,q in Figs.3–5)(Table 3).Also,after reaching the minimum porosities,the in the mixtures,the points at which the sand–clay mixtures developed the minimum porosities have mixtures experienced a very gradual increase in porosity up to the point in which the clay com-been marked.These points are named m,o,and q.They indicate that the sand–clay mixtures pletely controlled the behavior of the mixture (given by points n,p,and r in Figs.3–5)(Table 3).reached a minimum value of porosities at an average sand concentration value of ca.76%Thus,the results of the laboratory experiments indicate that there is a transition zone between the (Table 3).Since it is the case that at sand concen-tration values >76%the structure of the sand–sand controlled structure and the clay controlled structure in the mixtures.In this transition zone,clay mixture is completely controlled by the sand structure [Fig.6(A–C )],any shear strength tests the sand and the clay portions in the mixtures both controlled not only their porosity but their run on mixtures with sand concentration values >76%should re?ect this sand controlled behavior.shear behavior as well [Figs.6(D),8and 9].This transition zone develops at sand concentration
An analysis of the results of the shear strength
135
L.E.Vallejo,R.Mawby /Engineering Geology 58(2000)125–136values between points m and n in Fig.3;o and p tration was <40%by weight,the shear strength of the mixtures was entirely dictated by the in Fig.4;and q and r in Fig.5.The values of the strength of clay.
porosities and sand concentration ratios for these 2.Porosity measurements in the sand–clay mix-points are given in Table 3.Fig.9shows the rela-tures indicated that the porosity of the mixtures tionship between peak shear strengths,t peak
,versus
was dependent upon the fractional concen-the porosity in the mixtures.This ?gure indicates tration of the sand and the clay particles.The that the peak strength was reached by the samples porosity of the mixtures was found to be less not in an abrupt way but gradually.The peak than the porosities of the two components,sand shear strengths measured in the mixtures generally and clay.
correlated well with the range of minimum porosity 3.The porosity of the mixtures decreased as the values as depicted in Figs.3–5.Fig.9also indi-level of compaction increased,and tends toward cates,the samples seem to have an optimum range a minimum value regardless of the stresses used of low porosity values at which their shear strength for compaction of the samples.The minimum is maximized.
porosity of the mixtures represents the theoreti-An analysis of the values in Figs.3–6and cal boundary between a sand controlled and a Table 3indicates that when the sand concentration clay controlled mixture.
in the mixtures varied between 100and 76%,the 4.The porosity of the mixtures and their shear sand–clay structure was controlled by the sand.strength were found to be related.The porosity When the sand concentration in the mixture was of the mixtures was related to percentages of >47%,the sand–clay structure was controlled by sand in the mixtures at which the sand either the clay.For sand concentrations that varied controlled (sand concentration >75%),par-between 76and 47%,the sand–clay structure was tially controlled (sand concentration between partially controlled by the sand and the clay.The 75and 40%)or had no control at all (sand existence of these limits seems to be re?ected by concentration <40%)on the shear strength of the shear strength tests run on the mixtures (Fig.8)mixture.The laboratory tests also revealed that as well as by past investigations on the shear the mixtures seem to have an optimum range strength of granular material–clay mixtures of low porosity values at which their shear (Table 1).
strength is maximized.4.Conclusions
References
From direct shear tests and porosity measure-Deere,D.U.,Patton,F.D.,1971.Slope stability in residual soils.ments on sand–clay mixtures,the following were Proc.4th Panamerican Conf.Soil Mech.Found.Eng.,San Juan,Puerto Rico 1,87–170.
established:
Donaghe,R.T.,Torrey III,V.H.,1994.A compaction test
1.From direct shear tests on dry mixtures of sand method for soil–rock mixtures in which equipment size and clay it was found that the percentage of e ?ects are minimized.Geotech.Test.J.17(3),363–370.sand in the mixtures had a marked in?uence on Fragaszy,R.J.,Su,W.,Siddiqi,F.H.,Ho,C.L.,1991.Modeling
their shear strength.It was determined that strength of sandy gravel.ASCE J.Geotech.Eng.118,920–935.
when the concentration by weight of the sand Furnas, C.C.,1928.The relations between speci?c volume,
in the mixtures was >75%,the shear strength voids and size composition in systems of broken solids of of the mixtures was governed mainly by the mixed sizes.U.S.Bureau of Mines,Pittsburgh,Report of frictional resistance between the sand grains.Investigations No.2894,1–10.
Georgiannou,V.N.,Burland,J.B.,Hight,D.W.,1990.The
When the concentration of sand varied between undrained behaviour of clayey sand in triaxial compression 75and 40%,the shear strength of the mixture and extension.Geotechnique 40(3),431–449.
was provided in part by the shear strength of Holtz,W.G.,Ellis,W.,1961.Triaxial shear characteristics of
the clay and in part by the frictional resistance clayey gravel soils.Proc.5th Int.Conf.Soil Mech.Found.Eng.,Paris 1,143–149.
between the sand grains.When the sand concen-
136L.E.Vallejo,R.Mawby/Engineering Geology58(2000)125–136
Holtz,W.G.,Gibbs,H.S.,1956.Triaxial shear tests on pervi-the strength and creep characteristics of sand–clay mixtures.
ouos gravelly soils.J.Soil Mechanics Foundations Division,
Ph.D.Thesis,University of California,Berkeley,CA.
ASCE82,SM1,1–22.Rogers,C.D.F.,Dijkstra,T.A.,Smalley,I.J.,1994.Particle Kurata,S.,Fujishita,T.,1960.Research on the engineering
packing from an earth science point of view.Earth Sci.Rev.
properties of sand–clay mixtures.Proc.1st Asian Regional36,59–82.
Conf.Soil Mech.Found.Eng.,New Delhi,India1,1–12.
Schlosser, F.,Long,N.T.,1974.Recent results in French Legget,R.F.,1976.Glacial Till.Royal Society of Canada,research on reinforced earth.ASCE J.Construct.Div.100, Ottawa.
CO3,223–237.
Loganathan,N.,DeSilva,S.,Thurairajah,A.,1992.Strength Shakoor,A.,Cook,B.D.,1990.The e?ect of stone content, correlation factor for residual soils.ASCE J.Geotech.Eng.
size,and shape on the engineering properties of a compacted 118(4),593–600.silty clay.Bull.Assoc.Eng.Geologists XXVII(2),245–253. Lupini,J.F.,Skinner,A.E.,Waughan,P.R.,1981.The drained
Vallejo,L.E.,1979.An explanation for mud?ows.Geotech-residual strength of cohesive soils.Geotechnique31(2),nique29(3),351–354.
181–213.
Vallejo,L.E.,1989.An extension of the particulate model of Marsal,R.J.,Fuentes de la Rosa,A.,1976.Mechanical proper-slope stability for mud?ows.Soils and Foundations29
(3),1–13.
ties of rock?ll soil mixtures.Trans.12th https://www.360docs.net/doc/a45143670.html,rge
Dams,Mexico1,179–209.Vallejo,L.E.,1997.Surge wave development in debris?ows. McGeary,R.K.,1961.Mechanical packing of spherical par-
Soils and Foundations37(4),115–119.
ticles.J.Am.Ceram.Soc.44,513–522.Westman,A.E.R.,Hugill,H.R.,1930.The packing of particles. Paduana,J.A.,1966.The e?ect of type and amount of clay on
J.Am.Ceram.Soc.13,767–779.