Fatigue Design Load Identification Using Engineering Data Analytics
Ha-Rok Bae
Assistant Professor
Mem.ASME Department of Mechanical
and Materials Engineering, Wright State University,
Dayton,OH45435
Hiroaki Ando
Engineering Specialist
Advanced VPD,PD>,
Caterpillar,Inc.,
1901S.First Street,
Champaign,IL61874 Sangjeong Nam
Staff Analyst Information Analytics,PD>,
Caterpillar,Inc.,
1901S.First Street,
Champaign,IL61874
Sangkyum Kim
Engineering Team Lead Information Analytics,PD>,
Caterpillar,Inc.,
1901S.First Street,
Champaign,IL61874
Christopher Ha
Manager Information Analytics,PD>,
Caterpillar,Inc.,
1901S.First Street,
Champaign,IL61874Fatigue Design Load Identification Using Engineering Data Analytics
Selecting an appropriate concept design in the early stage of the product development process is crucial for successful machine development.As one of the important design requirements,a structural design needs to validate the structural fatigue life against physical tests of actual?eld operations.Traditionally,the fatigue design loads for the concept design evaluations are generated by hand calculations based on past experience to capture envelopes of expected system responses.But such an approach often does not capture actual loading behaviors in the?eld.An alternative approach of leveraging observed data from physical tests is highly desired,and a new method of this approach is introduced in this study.Our goal is to develop a new methodology of identifying fundamental fatigue load(FFL)contents from observed data by using engineering data analytics(EDA)techniques.The proposed methodology is applied to determine a new sensor layout which enables us to capture fundamental structural damage load patterns. Numerical demonstrations and case studies of the proposed method are presented with a common structural component,an I-section cantilever beam,and an industrial large-scale structure,a front linkage of a hydraulic excavator.[DOI:10.1115/1.4027849] Keywords:sensor layout,load identi?cation,engineering data analytics,fundamental fatigue loads,pattern mining,feature selection
1Introduction
In heavy earth moving industries,a typical new machine devel-opment process starts with a survey of a wide range of customers to understand the full spectrum of machine applications and criti-cal needs.Based on the survey,design targets are determined and cascaded through all subsystems of the new machine to be built. For a structural system,one of the most important design objec-tives is to meet a structural fatigue life target.Engineers should have high con?dence in structural durability assessments achieved by running physical dynamic tests with a full scale prototype machine at a test ground.However,it is expensive and time consuming to perform physical tests at every stage of design de-velopment.Therefore,using advanced simulation power,a virtual product development(VPD)process[1,2]is employed to reduce dependency on physical tests.Since a typical sampling rate of a test measurement is around several hundred hertz,measured data is often too big to be used for an iterative simulation based concept design exploration in VPD.In practice,instead of the measured loads,designers use a static design load set usually de?ned by worst cases of machine operations to assess the dura-bility envelope,especially for a concept design evaluation. Obtaining a good concept design is crucial to achieve successful machine development because it can reduce any budgetary or pro-ject schedule risk that can arise from unnecessary physical tests and design alterations.In concept design exploration,the accuracy of the durability evaluation obviously depends on how well the fatigue design loads represent the measured load data.Conven-tionally,the fatigue design loads are determined mainly based on experiences and simple hand calculations,considering potential extreme cases of machine operations.However,these design loads may not be appropriate to account for all critical fatigue load content during actual operation.Therefore,as an alternative, it is desirable to extract representative fatigue design loads directly from the measured loads.For load extraction,the?rst concern is how to place a limited number of sensors on a test machine to obtain quality measured load data that contains all crit-ical fatigue load content.
Optimal sensor placement is a typical problem in structural health monitoring(SHM).The main focus of sensor placement in SHM is how to maximize the chance of detecting system faults or potential damage with a limited number of sensors.In practice, the number of sensors is usually limited by the monitoring equip-ment channel capacity.Accessibility and serviceability will also pose constraints for the sensor layout design.Therefore,optimal sensor placements should be customized for applications and con-?gurations of a target machine https://www.360docs.net/doc/a48111056.html,prehensive surveys of SHM sensor placement can be found in Refs.[3–6].One of the popular approaches to measure the effectiveness of sensor place-ments is to use the Fisher information matrix[7],which shows the sensitivity of measurements of interest with respect to the sensor locations.Additional common approaches include modal assur-ance criterion(MAC)[8],effective independence method[9], kinetic energy method[10],mode shape sensitivity method with a dynamic reduction system[11],and energy index method with empirical mode decomposition[12,13].Most sensor layouts in SHM are determined by focusing on dynamic response changes of a targeted structure to detect structural damage,mostly through a
Contributed by the Design Automation Committee of ASME for publication in the J OURNAL OF M ECHANICAL D ESIGN.Manuscript received September12,2013;?nal manuscript received June3,2014;published online November14,2014.Assoc. Editor:Xiaoping Du.
pattern recognition process.The dynamic responses include struc-tural mode shapes,modal strain energy,nonlinear crack behavior, and dynamic?exibility[5].However,these SHM sensor layouts may not be optimal for identifying fatigue design load patterns and recently a modal stress weighting method was proposed to identify fatigue loads[14].In this study,the research effort is focused on the optimum sensor layout that can capture all critical fatigue load patterns from the sensor data rather than the detection of a change in structural dynamic responses.
Several researchers[15–17]have proposed load extraction methods that can generate static design loads from measured loads for fast design iterations.Kang et al.[15]developed an analytical method based on modal analysis for the transformation of dynamic loads into equivalent static loads.However,the static loads are aimed at reproducing equivalent displacement?elds,not fatigue damage.Based on the fatigue history wavelet transform [18],Abdullah et al.[19]developed the wavelet bump extraction (WBE)algorithm to?nd fatigue design loads.In this method,the signal is converted from the time domain to the frequency domain using the fast Fourier transform method.The frequency domain signal is decomposed into multiple wavelets in which each wave-let covers frequency regions of speci?c failure locations.Then the fatigue damage events or bumps are identi?ed such that they pro-duce equivalent signal statistics and fatigue damage to the original signal.In practical cases,however,WBE is ineffective to interpret the critical features of the fatigue loads method when it deals with many damage locations related with different frequency ranges. In this study,a new sensor layout method is proposed based on data analytics processes,such as pattern mining and feature extraction coupled with fatigue mechanics to amplify and capture fundamental damaging load patterns.By using data analytics,?rst,FFL elements are identi?ed from large amounts of measured load data.Damage-based sensitivity is proposed to amplify hidden patterns of the FFLs.Then,based on the identi?ed FFLs, optimized sensor placements are extracted from a number of can-didate sensor locations.Section2gives a brief description of the cumulative fatigue analysis with quasi-static stress responses, which outlines a typical approach used for the durability evalua-tion of concept designs.The proposed EDA approach for the sen-sor layout is presented in Sec.3.This is followed by numerical demonstrations and case studies with a common structural compo-nent,an I-section cantilever beam,and an industrial large-scale structure,the front linkage of a hydraulic excavator.The paper concludes with a summary of the research?ndings and potential next topics.
2Cumulative Fatigue Analysis
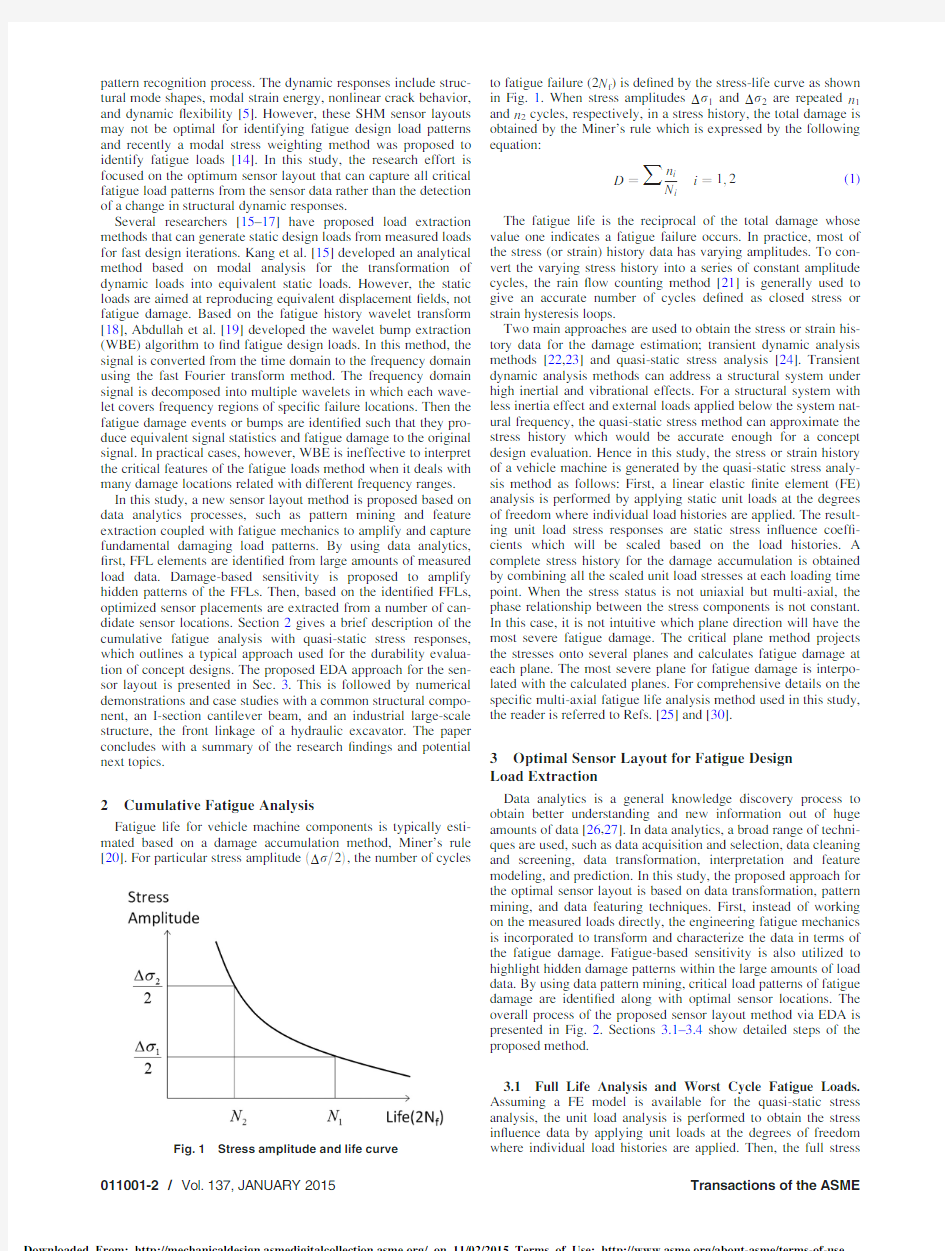
Fatigue life for vehicle machine components is typically esti-mated based on a damage accumulation method,Miner’s rule [20].For particular stress amplitudeeD r=2T,the number of cycles to fatigue failure(2N f)is de?ned by the stress-life curve as shown in Fig.1.When stress amplitudes D r1and D r2are repeated n1 and n2cycles,respectively,in a stress history,the total damage is obtained by the Miner’s rule which is expressed by the following equation:
D?
X n i
N i
i?1;2(1)
The fatigue life is the reciprocal of the total damage whose value one indicates a fatigue failure occurs.In practice,most of the stress(or strain)history data has varying amplitudes.To con-vert the varying stress history into a series of constant amplitude cycles,the rain?ow counting method[21]is generally used to give an accurate number of cycles de?ned as closed stress or strain hysteresis loops.
Two main approaches are used to obtain the stress or strain his-tory data for the damage estimation;transient dynamic analysis methods[22,23]and quasi-static stress analysis[24].Transient dynamic analysis methods can address a structural system under high inertial and vibrational effects.For a structural system with less inertia effect and external loads applied below the system nat-ural frequency,the quasi-static stress method can approximate the stress history which would be accurate enough for a concept design evaluation.Hence in this study,the stress or strain history of a vehicle machine is generated by the quasi-static stress analy-sis method as follows:First,a linear elastic?nite element(FE) analysis is performed by applying static unit loads at the degrees of freedom where individual load histories are applied.The result-ing unit load stress responses are static stress in?uence coef?-cients which will be scaled based on the load histories.A complete stress history for the damage accumulation is obtained by combining all the scaled unit load stresses at each loading time point.When the stress status is not uniaxial but multi-axial,the phase relationship between the stress components is not constant. In this case,it is not intuitive which plane direction will have the most severe fatigue damage.The critical plane method projects the stresses onto several planes and calculates fatigue damage at each plane.The most severe plane for fatigue damage is interpo-lated with the calculated planes.For comprehensive details on the speci?c multi-axial fatigue life analysis method used in this study, the reader is referred to Refs.[25]and[30].
3Optimal Sensor Layout for Fatigue Design
Load Extraction
Data analytics is a general knowledge discovery process to obtain better understanding and new information out of huge amounts of data[26,27].In data analytics,a broad range of techni-ques are used,such as data acquisition and selection,data cleaning and screening,data transformation,interpretation and feature modeling,and prediction.In this study,the proposed approach for the optimal sensor layout is based on data transformation,pattern mining,and data featuring techniques.First,instead of working on the measured loads directly,the engineering fatigue mechanics is incorporated to transform and characterize the data in terms of the fatigue damage.Fatigue-based sensitivity is also utilized to highlight hidden damage patterns within the large amounts of load data.By using data pattern mining,critical load patterns of fatigue damage are identi?ed along with optimal sensor locations.The overall process of the proposed sensor layout method via EDA is presented in Fig.2.Sections3.1–3.4show detailed steps of the proposed method.
3.1Full Life Analysis and Worst Cycle Fatigue Loads. Assuming a FE model is available for the quasi-static stress analysis,the unit load analysis is performed to obtain the stress in?uence data by applying unit loads at the degrees of freedom where individual load histories are applied.Then,the full
stress Fig.1Stress amplitude and life curve
history at a location of interest is recovered by multiplying load history data to the stress in?uence data under the assumption of linearity as in the following equations:
r j ?
X
i
L ij U i i ?1;2;…;I j ?1;2;…;J (2)U i ?f U xx i U yy i U xy i g T (3)r j ?f r xx j r yy j r xy j g T
(4)
Here,I is the total number of loading locations,J is the total number of load history time points,L ij is a load component (unit:N)on the i th loading location at the j th time point in the load his-tory data,U i is the stress in?uence coef?cient data (unit:m à2)obtained by applying a unit load at the i th loading location con-sisting of three in?uence coef?cients U xx_i ,U yy_i ,and U xy_i for the plane stress,and r j is the stress status at the j th time point at a location of interest also consisting of three plane stress components r xx_j ,r yy_j and r xy_j .In practice,there are many dif-ferent fatigue life assessment algorithms depending on load types (high or low cycles),materials,temperature,or residual stress and manufacturing methods such as a casting or fabricated structure.In this study,the main purpose of performing the full life analysis is to examine the load data by transforming it into cyclic loads.Therefore,the multi-axial principal stress algorithm with no mean stress correction is selected for a conservative life assessment of a general fabricated structure.
Once the fatigue analysis is performed,damage information can be extracted from the recovered full stress history in terms of the critical damage plane,worst damaging cycles,and their fre-quencies for the following EDA process.For the worst cycle extraction,the strain time history is obtained from the stresses normal to the critical damage plane.With the strain time history,individual fatigue cycles are collected by using a rain?ow cycle algorithm [21].As an example shown in Fig.3,a worst cycle that contributes to the total fatigue damage is identi?ed as a pair of time points,wc 1and wc 2,from the history.The number of worst cycles depends on the coverage ratio of the total fatigue damage to be covered at a location and the complexity of the load history data.For example,the 90%coverage ratio of the total fatigue life would include more worst cycles than the 80%coverage ratio.In practical cases,the number of extracted worst cycles can be con-trolled by segmenting the measured load data based on unique types of dynamic events.With the worst cycle time points,fatigue damaging load vectors are obtained as in the following equations:
L j ?f L ij j 8i g
(5)FL k ?eL wc 2k àL wc 1k Tk ?1;…;K p
(6)
Here,L j is the load vector given at the j th time point in a load
history data,wc 1k and wc 2k are the load history time points for the k th worst cycle,K p is the total number of identi?ed worst cycles at the location of interest p ,and FL k is the k th worst cycle fatigue load vector.As a result,a matrix of worst cycle fatigue load vec-tors is obtained at each candidate sensor location as
FL p ?f FL k j k ?1;2;…;K p g ;
p ?1;2;…;P
(7)
where P is the total number of candidate sensor locations and the FL p matrix has the size of K p ?I .
The next step is to ?nd basic patterns among the fatigue load vectors in each FL p .Based on the basic patterns obtained in this step,our goal is to select essential locations of sensors.In practice,typically the total number of the fatigue loads from all the loca-tions is computationally challenging to deal with altogether within a signal EDA process.In the proposed method,to take advantage of parallel computing power,the pattern mining is divided into two stages,local and global pattern mining.The local pattern min-ing is performed at each observation location to collect locally unique load patterns.And then,all local load patterns obtained from the individual observation locations are processed by a global-level pattern mining to identify FFL patterns.The local pattern identi?cations can be distributed to multiple processors
to
Fig.2Overall process of the proposed sensor layout
method
Fig.3Worst cycle identi?ed with time points,wc 1k and wc 2k ,via Rain?ow cycle counting
reduce the computational time since the interaction effects among the basic patterns are addressed by the global pattern mining. In the pattern mining,it should be considered that the same load patterns can be found in multiple locations.And load patterns which are insigni?cant at one location could be highly damaging at other locations,depending on the sensitivities of loads to fatigue damage.Hence the sensitivity needs to be incorporated along with the pattern mining.
3.2Pattern Amplification by Using Damage Based Sensitivity.Before pattern mining,the fatigue load vectors are weighted with damage based sensitivities to amplify hidden pat-terns in terms of fatigue damage according to the location they belong.The fatigue damage at a location is a function of stress ranges along the critical plane direction obtained from the previ-ous full fatigue analysis.At a given critical plane direction(h c) for the j th load history point,the stress is obtained as
r x1j?r xx jtr yy j
2
t
r xx jàr yy j
2
cos2h ctr xy j sin2h c(8)
where the plane stress components,r xx_j,r yy_j,and r xy_j,are from Eqs.(2)–(4).The damage based sensitivity is approximated by the stress sensitivity which will be unique at each observation location as
@r x1
@L i
?U xx ie1tcos2h cT=2tU yy ie1àcos2h cT=2
tU xy i sin2h c(9)
where U xx_i,U yy_i,and U xy_i are the three stress in?uence coef?-cients from the unit load stress analysis.The sensitivity vector which approximates the damage sensitivity is obtained by Eq.(10)at each candidate sensor location p.Then a matrix of pattern-ampli?ed fatigue load vectors(wFL p)is obtained by Eq.(11),which is essentially scaled by the damage based sensitiv-ity(DS p)for each fatigue loads at each location p
DS p?
@r x1
@L i
p
;i?1;2;:::;I
()
p?1;2;…;P(10)
wFL p?f wFL p k?DS P:?FL p k;k?1;…;K p g p?1;2;…;P
(11) Here,the operator(.*)is for the component wise vector by ma-trix multiplications.
3.3Local and Global Basic Pattern Identifications.The proposed method employs two stages—the local and global min-ing processes of the FFL patterns.Again,our goal in this study is to minimize the number of sensors across the target structure while all the FFL patterns are captured by the measured data. Therefore,identifying all the fundamental load patterns is the key task in the proposed method.Once the FFL patterns are identi?ed, they can be used to determine the optimum layout.
First,the local pattern mining is performed at each observation location p.For the simplicity,the superscript p for a sensor loca-tion is omitted in Eqs.(12)and(13).The pattern-ampli?ed fatigue load vectors are cross-compared to each other to obtain a normal vector correlation(NVC)which is de?ned by
NVC mn?
wFL T máwFL n
2
wFL T
m
wFL m wFL T
n
wFL n
m?1;…;K p;n?1;…;K p
(12)
where the superscript T indicates the transposition of the vector. The NVC measurement is essentially the same as the MAC[28]which is a common measure to estimate the correlation among the modal shapes in SHM.In this study,NVC measures the degree of correlation between two fatigue load vectors,instead of mode shapes.And the load patterns are ampli?ed with the damage-based sensitivity calculated at each observation location.In the local pat-tern identi?cation process,if any vector show high NVC,it will be taken as a dependent load pattern and excluded from wFL.However all fatigue load vectors that show the NVC values to all other vectors lower than a correlation threshold(corr_tol)are regarded as unique load patterns and kept in the local fatigue load(LFL)matrix as LFL?f wFL m j8NVC mn n?mt1;…;l K p;m?1;2;…;l K p g (13) where l K p are the number of the identi?ed unique load vectors and the size of LFL is l K p?I. This local pattern mining will eliminate correlated load patterns sequentially in the order of fatigue damage severity.At the end of the local pattern mining with a given correlation threshold,only uncorrelated patterns are stored in LFL as locally unique fatigue loads for the current observation location.The correlation thresh-old is a user de?ned control parameter for the pattern mining.It is expected the higher the correlation threshold,the larger the num-ber of unique fatigue load vectors.This local process is repeated for all candidate sensor locations and the matrix of locally unique fatigue load vectors at a location p is obtained as LFL p.Each LFL p could have the different size of l K p?I at each location p. Typically,the size of LFL p becomes much smaller than FL (Eq.(7))as only unique pattern fatigue loads are collected from each observation location. Next,the global mining process is performed to identify FFLs for the entire structure.For the global process,all the LFL p matrices are appended into the one local fatigue load vectors(LFLV)matrix as in Eq.(14)where C is the total number of the identi?ed load pat-terns from all observation locations,and the size of LFLV is C?I LFLV?f LFL1;LFL2;ááá;LFL P g ?f LFLV c j c?1;2;…;C g(14) In the global process,the NVC measurements for the LFLV vectors are again compared to each other to?nd fundamentally unique fatigue load patterns through the entire observation loca-tions.However,unlike the local mining,the global process needs to consider a global NVC matrix which consists of multiple sets of the NVC values obtained by applying different damage based sensitivity ampli?cations of individual observation locations as gNVC p c 1 c2 ? wLFLV p c1 TáwLFLV p c 2 2 wLFLV p c 1 T wLFLV p c 1 wLFLV p c 2 T wLFLV p c 2 c1?1;…;C;c2?1;…;C;p?1;…;P(15) where wLFLV p c ?DS p:?LFLV p c The global NVC matrix starts with all LFLV load vectors in the beginning of the global process.However,if a pair of LFLVs shows higher values than the user de?ned correlation threshold at all the observation locations,they are taken as the same load pattern.The process is performed sequentially in the order of structural damage contribution until only FFL vectors are left (Eq.(16)) FFL q?f LFLV c 1 j8emin?gNVC p c1c2 ;p?1;2;…;P T c2?c1t1;…;l C;c1?1;2;…;l C g(16) Here,l C starts with the total number of LFLV and updated itself sequentially as any correlated LFLV vector is detected and removed from gNVC.As a result of the global mining process,the patterns of FFLs are obtained by FFL ?f FFL q j q ?1;2;…;Q g (17) where Q is the total number of FFL patterns and the size of the FFL matrix becomes Q ?I .In most practical cases,the size of FFL is signi?cantly smaller than the originally measured load data.The process also keeps the association information (Eq.(18))of LFLV to the individual FFL patterns which are used in the next step to determine the sensor location selection FFL q ?f LFLV q /LFLV h h ?1;2;…;H q g (18) Here,H q is the number of correlated local fatigue load vectors for the q th FFL pattern. 3.4Sensor Location Selection.The patterns in FFLs obtained from the previous step are not actual loads,but they represent fundamental patterns for the fatigue damage from the measured load data.As mentioned before,the FFL patterns are obtained according to the severity of fatigue damage.However,in this step,our goal is to select the minimum number of sensors across the target structure while all the FFLs are captured. By using the association information of FFL,all LFL load vec-tors at the local observation locations are translated in terms of the FFL patterns.Since FFL is typically a smaller set than LFL,there could be many locations having the same FFL patterns.Consider-ing individual observation locations as design variables for the sensor layout,each variable has a different amount of information for the fatigue load patterns.Hence to select minimum observa-tion locations or the sensor placements,most signi?cant design variables are selected ?rst which can yield maximum information on the FFLs.It is a typical feature selection problem in data ana-lytics.This feature selection problem is basically a combinatorial optimization problem for selecting a minimum number of obser-vation locations considering discrete association relationships of FFL.A typical approach for the combinatorial optimization prob-lem is to use genetic algorithm with constraint for the combination rule [29]. In this study,a heuristic search method is adopted to ?nd the minimum sensor locations in terms of both fatigue damage and full coverage of fatigue load patterns.In a practical application,there would be additional considerations such as accessibility to install sensors,signal to noise sensitivity,geometrical layout requirements,and historical or highly expected fatigue failure locations.To address all the considerations in practice along with the FFL patterns,the numerical optimization approach would come into picture. 4Numerical Examples As demonstrations of the proposed method,numerical exam-ples are presented in this section.First a basic and common struc-tural component,a cantilever beam,is presented to facilitate better understanding of the effectiveness of the proposed method.4.1I-Section Cantilever Beam.The cantilever beam described by Fig.4is used as a numerical demonstration of the proposed method.The cantilever beam has the I-type cross sec-tion.With one end ?xed,the other free side has two loading inputs:bending and axial.Material properties are assumed to be the typical steel properties of E ?205,000N/mm 2and ?0.3.As described in Sec.3,unit load stress analysis is performed to obtain the stress in?uence coef?cient data as shown in Fig.5.It is found that the bending stress (unit:MPa)is higher than the axial stress with the unit loads.Load history data which has a limited number of cyclic fatigue loads for the demonstration is shown in Fig.6.From the load history data,the fatigue damage from the repetitive segment is expected to occur.The fatigue analysis is performed by using the commercial fatigue life analysis code Fe-Safe [30].As discussed in Sec.3,the linear damage fatigue analysis with quasi-static stress history is performed with the maximum princi-pal stress algorithm and the SN curve for the ISO steel 1020from the material database built into Fe-safe.The detailed material fatigue strength properties and SN curve are shown in Table 1and Fig.7,respectively.The fatigue life contour over the cantilever beam is shown in Fig.8in terms of the repetitions of the given load history. Since the load history is simple repetitions of the load block,only ?ve exact FFL patterns exist as shown in Table 2.Due to the Fig.4I-section cantilever beam Fig.5Stress plot with bending unit load high magnitudes of axial forces versus bending,the overall NVC values of the loads are close to unit values as shown in Fig.9.The NVC results indicate all the load vectors are strongly correlated and can be combined into a single load vector.However,by applying the damage based sensitivity at the location close to the ?xed end,the NVC values become more distinctive for ?nding the patterns of the loads as shown in Fig.10.This shows the bene-?t of using the pattern-ampli?ed fatigue load vectors introduced in Sec.3.Based on the damage sensitivity of an observation loca-tion,the signi?cance of an individual FFL to the fatigue damage would be different.For example,at the location close to the ?xed boundary,it is expected the majority of the fatigue damage is from the bending dominant loads,such as FFL_01and FFL_02while the axial force,such as FFL_03,will contribute more dam-age at the locations close to the free end. To ?nd the best sensor locations,a total of 48locations are con-sidered as candidate sensor locations as shown in Fig.11.Both top and bottom sides of marked locations in the ?gure are consid-ered.In the proposed EDA method,the number of candidate Fig.6Axial and bending load history data Table 1 SAE-1020Steel fatigue material property Material property Steel Ultimate tensile strength 393Cyclic strain hardening coef?cient (Mpa)1487Cyclic strain hardening exponent 0.3Basquin’s fatigue strength exponent à0.135Cof?n–Manson fatigue ductility exponent à0.459Fatigue ductility coef?cient 0.2340Fatigue strength coef?cient (Mpa)855.0 Surface ?nish Smooth surface Fig.7SAE-1020Steel SN plot Fig.8Cantilever beam fatigue analysis result Table 2FFLs Axial (N) Bending (N)FFL_011,800,00045,000FFL_021,800,000à45,000 FFL_031,800,0000FFL_041,800,00030,000FFL_05 1,800,000 à 15,000 Fig.9Five FFLs and their NVC values Fig.10Pattern-ampli?ed FFLs and their NVC values locations considered is limited only by the available computa-tional power.The ?nal sensor placements are obtained by a se-quential process of local and global extractions for unique load vector patterns according to the process in Fig.2.For the pattern mining with the NVC measurements,damage based sensitivity vectors are calculated and utilized at each observation location.In this example,the desired damage coverage is set to 98%,which means the worst cycles will be extracted to cover 98%of fatigue damage at each location.The correlation threshold for the local and global pattern identi?cation is 98%.This means if any NVC value of two load vectors is less than 0.98,the vectors are kept as unique load patterns.Having a higher value of correlation thresh-old will result more FFL patterns since more LFLVs will be selected as unique load patterns.The purpose of this numerical example is to con?rm the accuracy and effectiveness of the pro-posed EDA method in extracting all the damaging FFL patterns from the given input load history and proposing a least number of sensor locations to capture all identi?ed FFLs.As a result,in the current cantilever beam example,the proposed method success-fully ?nds exact ?ve FFLs.And also it suggests that only two sen-sor locations indicated in Fig.12would be enough to capturing all FFLs out of 28candidate locations.It is noted that the sensor loca-tions are not on the ?xed boundary area where the fatigue damage is most high as a potential fatigue failure location.Instead the pro-posed method selects the locations where both the bending and axial forces are distinctively contributing to the fatigue damage.Case study 1:With low fatigue life coverage,it can be expected less signi?cant worst cycles would be ignored in the EDA process.Figure 13shows the case study result with 90%fatigue life cover-age.The result of the sensor locations for this case study are still away from the ?xed boundary condition,but FFL_05,which is less damaging than other FFLs,is not selected as a unique load pattern.Therefore,by varying the fatigue life coverage and per-forming the EDA process,sensitivity of sensor locations to the FFL coverage can be estimated. Case study 2:When the set of candidates are limited only on the area close to the ?xed boundary,even though the fatigue life coverage is back up to 98%as before,it is expected to ?nd only FFLs with high bending loads.Figure 14shows the expected Fig.11Candidate sensor locations (marked with black squares) Fig.12Sensor placement result w/fatigue life coverage 98% Fig.13Case study 1—sensor placement result w/fatigue life coverage 90% Fig.14Case study 2—sensor placement result w/fatigue life coverage 98% result which lists only FFL_01and FFL_02as fundamental loads.It shows if sensors are installed on only the locations of high fa-tigue damage,it could potentially miss some other FFL contents.Therefore,to extract fatigue design loads,the sensor placements should be considered from the perspective of capturing fatigue load patterns rather than high fatigue damages. 4.2Industrial Example:Hydraulic Excavator Front Linkage Structure.To demonstrate the practicality of the pro-posed EDA framework for an industrial scale problem,the front linkage structure of a hydraulic excavator as shown in Fig.15is presented in this section.A general Excavator has three parts of front linkage bodies,usually referred to as a boom,stick,and bucket that are actuated by three main hydraulic cylinders.The boom structure which is the ?rst linkage body from the rotating platform will be investigated for the optimal sensor layout for the FFL pattern detection.The linkage point tagged as PT1in the boom ?gure is the hinge joint to the main platform,PT2is for a boom cylinder,PT3for a stick cylinder,and PT4is the linkage connection to the stick structure.The boom cylinder makes up and down motions,while the stick cylinder is usually for digging in and out positions.With many different con?gurations of the front linkage,excavators can perform many different applications.One of the common applications is truck loading in which an excavator loads materials on a truck as shown in Fig.15above.The truck loading consists of several operations,such as digging,lifting,rotating,dumping,and returning.During the course of operations,the boom structure will be under different loadings that come from the main platform vibrations with a counter weight mass,as well as from soil to bucket interactions.For the boom structure,there are total 14load channels as shown in Table 3where,for example,PT1FX and PT1MX stand for force and moment components in the x direction,respectively.Figure 16shows typical load histories at a few selected channels for the truck loading application data.In a typical design process,yielding loads de?ned from extreme operations are used for con-cept design exploration.However,fatigue damage failures which are different from yield failures would not be addressed correctly unless the yield loads are the same as the fatigue loads embedded in the load history data.Therefore by using the proposed EDA method,the fundamental damage loads from the load history are extracted and applied in the concept design development of the boom structure. Fig.15General hydraulic excavator and its front linkage boom structure Table 3Load channel names for the boom structure PT1PT2PT3PT4PT1FX PT2FX PT3FX PT1FX PT1FY PT2FY PT3FY PT1FY PT1FZ PT1FZ PT1MX PT1MX PT1MY PT1MY Fig.16Load history for truck loading application As in the previous example,the structural fatigue life contour is assessed by using the multi-axial principal stress algorithm with the ISO steel 1020material property as shown in Fig.17.To ?nd FFLs and the best sensor layout for comprehensive damage assessment,50total locations shown in Fig.18are selected as ini-tial candidates.Again,in this proposed method,to cover the entire fatigue life range of the boom structure,we can select as many locations as our computational power allows.To extract FFLs, the Fig.17Fatigue life contour with the given load history Fig.18Initial candidate sensor locations (marked with black squares) Fig.19Optimum sensor layout for capturing all 16FFLs fatigue damage coverage and the correlation threshold are set to 98%.For the result of local and global pattern mining,a total of 16FFLs (FFL01–FFL16)are identi?ed as unique fatigue load pat-terns that account for up to 98%of the fatigue damage from the given load history.It is also found only the six sensors shown in Fig.19are needed to capture the 16FFLs for the 98%damage and FFL correlation coverage.It is noted the scales and frequen-cies of FFLs need to be determined further in order to fully recover the same fatigue damage as the given load history,which is out of scope of the current research.Hence at this stage we will focus on the FFL patterns.In the Appendix,all 16FFLs are normalized by PT1FX and PT1MX for forces and moments,respectively,to visualize the patterns.For a few selected FFLs,Fig.20shows their distinctive structural deformations.FFL01shows primarily a boom bending deformation while FFL08makes twisting.The combination of bending and twisting is shown by Fig.20Stress contours and deformed shapes with FFL01,FFL04,and FFL08 Fig.21High correlations among the FFL groups FFL04.To obtain more insight on the obtained FFLs,two more studies were performed by changing(1)the damage coverage to 90%from98%,and(2)the correlation threshold to90%from 98%. For the?rst case study,where we reduced damage coverage, some FFLs whose damages are not as signi?cant as others among the16FFLs are dropped down.The dropped ones are FFL03, FFL05,FFL09,FFL10,and FFL14.From this study,we can say the remaining FFLs are more important load vectors in terms of the damage contribution to the structure.However,some of the dropped ones,such as FFL09and FFL10,have unique patterns that are irreplaceable by any other remainders.On the other hand, in the second case study with the reduced correlation threshold, but with the previous98%damage coverage,only FFLs which show higher uniqueness or small values in NVC would survive. The dropped FFLs among the16FFLs are FFL03,FFL11,FFL12, FFL13,FFL14,and FFL15.Close observations reveal that FFL03 and FFL13have the similar patterns as FFL02,and the pattern of FFL04can cover FFL11and FFL12.Figure21shows the normal-ized FFL vectors and clearly indicates high correlations among the FFLs,which means the surviving one can potentially make up the damage characteristics of the other dropped ones.Therefore we can say the results from the second case study would better preserve potential damage characteristics by focusing on the unique load patterns instead of the damage coverage. 5Conclusion Due to recent advancements on power electronics,many heavy machines are equipped with a variety of advanced sensors and control systems to maximize machine performance and availabil-ity.One of the next imminent challenges in advanced VPD would be how to process the huge amount of data generated by on-board sensors directly from job-sites and pull out useful and meaningful information for engineering designs and intelligent maintenance. The proposed EDA could play an important role in addressing this next engineering challenge.In this paper,a new sensor layout method with the EDA approach is proposed to effectively capture all critical fatigue load contents with a minimum number of sensors.The proposed method employs two level pattern iden-ti?cations—local and global fatigue load pattern mining.To dis-tinguish load patterns more effectively,damage-based sensitivity weights are applied before the NVC-based pattern mining.The proposed method is successfully demonstrated with numerical examples highlighting the basic logics of the proposed EDA method and the case studies of several sensor layouts. As a next step of the study,to increase the effectiveness of the process to the large-size and complex problem,an optimization method can be investigated to address all the practical considera-tions,such as accessibility to install sensors,signal to noise sensi-tivity,geometrical layout requirements,historical or highly expected fatigue failure locations,and so forth.This methodology can be extended to develop fundamental fatigue design loads that can replace the full measured load in estimating structural durabil-ity in an effective and ef?cient manner,especially targeting the application in the concept design development.Also,as more measured data sets are collected for the similar group of machine operations,statistical inference of fatigue design loads can be obtained to address robustness based concept design against uncontrollable variability in real operational conditions. Acknowledgment This research was supported by Caterpillar,Inc.and Wright State University Research Initiation Grant.This support is grate-fully acknowledged. Appendix The normalized vectors of forces and moments of16FFLs are listed here.The bars in the graphs are in the order of PT1FX, PT1FY,PT1FZ,PT2FX,PT2FY,PT3FX,PT3FY,PT4FX, PT4FY,PT4FZ,PT1MX,PT1MY,PT4MX,and PT4MY from the left in Fig.22. References [1]Dieter,G.E.,and Schmidt,L.C.,2013,Engineering Design,5th ed.,McGraw- Hill,New York. [2]Wang,L.,Shen,W.,Xie,H.,Neelamkavil,J.,and Pardasani, A.,2002, “Collaborative Conceptual Design—State of the Art and Future Trends,”Com-put.-Aided Des.,34,pp.981–996. [3]Worden,K.,and Burrows,A.,2001,“Optimal Sensor Placement for Fault Detection,”Eng.Struct.,23(8),pp.885–901. [4]Padula,S.L.,Palumbo,D.L.,Kincaid,R.K.,Asme,T.A.,and Ahs,A.,1998 “Optimal Sensor/Actuator Locations for Active Structural Acoustic Control,” Proceedings of the39th AIAA/ASME/ASCE/AHS/ASC Structures,Structural Dynamics,and Materials Conference,AIAA-98-1865,Long Beach,CA. [5]Sohn,H.,Farrar, C.R.,Hemez, F.M.,Czarnecki,J.J.,Shunk, D. D., Stinemates,D.W.,and Nadler,B.R.,2003,“A Review of Structural Health Fig.22Normalized forces and moments of16FFLs Monitoring Literature:1996–2001,”Los Alamos National Laboratory Report, Report https://www.360docs.net/doc/a48111056.html,-13976-MS. [6]Meo,M.,and Zumpano,G.,2005,“On the Optimal Sensor Placement Techni- ques for a Bridge Structure,”Eng.Struct.,27(10),pp.1488–1497. [7]Kirkegaard,P.H.,and Brincker,R.,1994,“On the Optimal Location of Sensors for Parametric Identi?cation of Linear Structural Systems,”Mech.Syst.Signal Process.,8,pp.639–647. [8]Breitfeld,T.A.,1995,“Method for Identi?cation of a Set of Optimal Points for Experimental Modal Analysis,”J.Anal.Exp.Modal Anal.,11(1), pp.1–9. [9]Kammer,D.C.,and Brillhart,R.D.,1996,“Optimal Sensor Placement for Modal Identi?cation Using System-Realization Methods,”J.Guid.,Control Dyn.,19,pp.729–31. [10]Heo,G.,Wang,M.L.,and Satpathi,D.,1997,“Optimal Transducer Placement for Health Monitoring of Long Span Bridge,”Soil Dyn.Earthquake Eng.,16, pp.495–502. [11]Lam,H.-F.,and Yin,T.,2011,“Dynamic Reduction-Based Structural Damage Detection of Transmission Towers:Practical Issues and Experimental Veri?cation,”Eng.Struct.,33(5),pp.1459–1478. [12]Rezaei, D.,and Taheri, F.,2010,“Damage Identi?cation in Beams Using Empirical Mode Decomposition,”Struct.Health Monit.,10(3),pp. 261–274. [13]Cheraghi,N.,and Taheri,F.,2007,“A Damage Index for Structural Health Monitoring Based on the Empirical Mode Decomposition,”J.Mech.Mater. Struct.,2(1),pp.43–62. [14]Wentzel,H.,2013,“Fatigue Test Load Identi?cation Using Weighted Model Filtering Based on Stress,”Mech.Syst.Signal Process.,40,pp.618–627. [15]Kang,B.S.,Park,G.J.,and Arora,J.S.,2005,“Optimization of Flexible Multi- body Dynamic Systems Using Equivalent Static Load Method,”AIAA J., 43(4),pp.846–852. [16]Park,K.J.,Lee,J.N.,and Park,G.J.,2005,“Structural Shape Optimization Using Equivalent Static Loads Transformed From Dynamic Loads,”Int.J. Numer.Methods Eng.,63,pp.589–602.[17]Wickham,M.J.,Riley, D.R.,and Nachtsheim, C.J.,1995,“Integrating Optimal Experimental Design Into the Design of a Multi-Axis Load Trans-ducer,”J.Eng.Ind.,117,pp.400–405. [18]Oh, C.S.,2001,“Application of Wavelet Transform in Fatigue History Editing,”Int.J.Fatigue,23,pp.241–250. [19]Abdullah,S.,Choi,J.C.,Giacomin,J.A.,and Yates,J.R.,2006,“Bump Extraction Algorithm for Variable Amplitude Fatigue Loading,”Int.J.Fatigue, 28,pp.675–691. [20]Miner,M.A.,1945,“Cumulative Damage in Fatigue,”ASME J.Appl.Mech, 12(3),pp.A159–A164. [21]Downing,S.D.,and Socie,D.F.,1982,“Simple Rain?ow Counting Algo- rithms,”Int.J.Fatigue,4(1),pp.31–40. [22]Haiba,M.,Barton,D.C.,Brooks,P.C.,and Levesley,M.C.,2002,“Review of Life Assessment Techniques Applied to Dynamically Loaded Automotive Components,”Comput.Struct.,80,pp.481–494. [23]Huang,L.,Agrawal,H.,and Kurudiyara,P.,1998,“Dynamic Durability Analy- sis of Automotive Structures,”Society of Automotive Engineering,SAE Paper No.980695. [24]Conle,F.A.,and Mousseau,C.W.,1991,“Using Vehicle Dynamics Simula- tions and Finite-Element Results to Generate Fatigue Life Contours for Chassis Components,”Int.J.Fatigue,13(3),pp.195–205. [25]Socie,D.F.,and Marquis,G.B.,“Multiaxial Fatigue,”SAE International,ed, Warrendale,PA. [26]Fayyad,U.,Piatetsky-shapiro,G.,and Smyth,P.,1996,“From Data Mining to Knowledge Discovery in Databases,”Artif.Intell.(AI)Mag.,17(3),pp.37–54. [27]Lan,H.,2011,Data Mining:Practical Machine Learning Tools and Techni- ques,3rd ed.,Morgan Kaufman,Boston. [28]Allemang,R.J.,2002,“The Modal Assurance Criterion(MAC):Twenty Years of Use and Abuse,”Proceedings of the International Modal Analysis Confer-ence IMAC20,Los Angeles,CA,pp.397–405. [29]Gen,M.,and Cheng,R.,2000,Genetic Algorithms and Engineering Optimiza- tion,Wiley,New York. [30]“Fe-Safe User’s Manual,”Safe Technology Limited,Shef?eld,UK,2011. 公路桥梁结构桥梁抗疲劳设计方法应用 摘要:随着我国社会既经济的发展,公路桥梁工程建设越发的完善,但是由于我国人口众多,私家车拥有量也是与日俱增,这就导致我国公路桥梁工程的消耗使用比较严重,部分公路桥梁由于长期处于疲劳工作状态下使得其结构出现严重破损,影响交通工程的安全性。其中,桥梁工程出现疲劳的现象比较多,所以,在进行公路桥梁结构看疲劳设计时要将工作重点放在桥梁抗疲劳设计上,从而促进公路桥梁抗疲劳性能。 关键词:公路桥梁;结构桥梁;抗疲劳设计;方法应用 引言 随着我国社会经济的发展,结构桥梁工程的建设越来越多,但是在发展的同时也会越到需索刁钻的问题,其中,抗疲劳设计就是一项比较复杂而且艰难的工作。在施工与运行的过程中如果略了各类问题,就会导致工程在启动之后出现抗疲劳强度不足,出现桥梁使用年限缩小的情况。 一、影响桥梁结构抗疲劳强度因素 1.残余应力 在我国现阶段的桥梁建设中普遍采用钢结构作为桥梁的主要材料,而钢结构的抗疲劳性能基本上是受加工材料性能的影响,例如在加工阶段中冶炼、轧制、焊接等过程,都与可能会出现受热不均的现象,致使钢结构内部存在残余应力,对于钢结构桥梁来说,其一般只能承受翼缘内周期性压力应力,在高残余拉应力范围内便会出现开裂问题,而影响桥梁结构抗疲劳性能。针对钢结构中的残余应力,如果不能够完全掌握受力的峰值,还有受力的分布区域,这就很可能会造成残余应力影响钢结构质量的问题出现,尤其是对桥梁结构疲劳强度影响十分明显。 2.低温冷脆循环作用 在一般情况下,钢结构桥梁工程的施工过程对下弦和桥墩支座连接位置的集中应力以及流限状态的研究不够全面,这种钢结构桥梁受到低温冷脆循环很容易会发生脆断的现象。除此之外,当钢结构材料厚度为B≥2.5(KIC/σys)2时,钢结构平面应力逐渐趋于脆性状态,是钢结构桥梁施工设计的要点。 3.其余因素 3.1钢结构的材料特性 虚拟天文馆“学习指南”(六下) 虚拟天文馆学习指南 学习者:六()姓名__________ 一、月球观察 (一)观察同一天的不同时间,月球运动的方向: 1.打开虚拟天文馆,设置地点:苏州;时间:2016年4月17日15时 2.缩小画面,点亮"基点"按钮,调整方向使地面水平(东、南、西三字呈一直线)。点击“加快时间”按钮: 从地面观察,在同一天的不同时间,月球的运动方向是自______向______。 3.我们还观察到不仅月球这样运动,其他星体(除北极星外)的运动方向也是自______向______的。 (二)观察不同日期的同一时间,月球的运动方向: 缩小画面,点亮"基点"按钮,调整方向使地面水平(东、南、西三字呈一直线)。 1.设置观察时间:2016年4月7日20时(农历三月初一),不关闭“日期时间”窗口, 逐一增加日期(时间始终为20时,分、秒忽略),连续观察月球的方位,直到2016年5月6日(农历三月三十)是一整个月。 2.同样的方法,继续往后推时间,观察下一个月的月球方位。你发现什么规律了么? 从地面观察,月球在不同日期的同一时间,运动的方向是自_____向_______的。(三)观察月球的样子(月相) 1.打开“日期时间”窗口,设置时间为2016年4月10日20时(初四,7、8、9日观察不到 月球)。不关闭“日期时间”窗口,点击月球。按画面右上角第二个“传感器”按钮,近距离观察月球的样子。注意:请不要用目镜观察,目镜观察到的图像是相反的。 2.逐一增加日期(时、分、秒忽略),连续观察月相的变化,找到规律,请连线。 收集于网络,如有侵权请联系管理员删除 实用为上!十大常用工具软件集锦 随着电脑及互联网的普及,人们传统的工作方式、学习方式及思维方式逐渐发生变化,很多传统的信息查询方式都逐渐被电脑所取代,比如以前我们通常通过去书店买本词典来查询英语单词,而今我们只需安装一款免费的词典软件即可轻松查询单词甚至进行全文翻译,再比如现在很多人喜欢在网上淘宝,买到心仪的商品后很多人喜欢查询快递到达情况,我们再也无需要拿着快递单号去快递公司查询了直接在网上通过软件即可查询。为了生活的更加舒适和便捷,我们需要诸如此类的实用信息查询软件,随着这些软件大多是一些名不见经传的小软件,但是却是日常生活中实用性非常强的好工具,相信有了这些软件的帮助,我们的生活一定会更加舒适和便捷! 1.淘友必备:快递查询软件推荐——快递精灵 随着互联网的普及和人们消费观念的更新,网上购物已经被越来越多人所接受,网购成了时尚,成了不可阻挡的潮流,即使在全球金融风暴的阵阵寒流中,也依然可以看到“风景这边独好”。网购的不断发展,不仅仅给经营者和消费者带来实实在在的实惠,还带动了诸多行业的飞速发展,尤其是物流快递业,作为卖家与买家之间的纽带,快递业无疑遇到了行业发展的春天! 很多网友在网购后盼货心情急切,因此对快递跟单查询产生大量需求,一般情况下用户可以进入快递公司的网站进行查询,但是由于快递公司比较多,四处查找快递公司的网址比较不便,因此小编这里为大家推荐一款可以直接查询快递跟单信息的小工具:快递精灵。 快递查询精灵资料: 快递查询精灵软件预览: 快递查询精灵可以帮助用户查询几乎所有快递公司的跟单信息,包括邮政快递、申通快递、圆通快递等淘宝网常见合作快递单位,如图所示,用户只需在程序界面左侧输入快递单号即可轻松跟踪到快递运输情况。注意:快递查询服务必须在联网状态下进行。 疲劳载荷处理软件(LMS T ecWare)技术指标 ?系统要求 -操作系统:WindowsNT/2000, HP UX, SGI, Sun 工作站 ?任务管理和载荷时间历程管理(T ecW are Kernel 模块) -同时读入不同格式的多个文件中的任意多个时间历程,单个或多个同时显示、编辑 -时域信号编辑功能:同时对多个通道进行积分、微分、时间段剪切/粘贴、偏移/零点漂移初步矫正、数据平滑、函数生成时间历程信号、自动选择时间段… -可轻松地将时域信号在几种格式之间相互转换 -袖珍计算器和逻辑操作功能,根据数学函数生成时间历程 -桌面管理器用来管理所有数据对象并监控分析任务 -结果自动添加到当前桌面管理器中 -完全可自定义的用户界面(如菜单、按扭等) ?疲劳计数(T ecW are FatiCount 模块) -Rainflow(雨流),Range pair(程对)、level crossing(穿级), symmetrical level crossing(对称穿级), Peak Count(峰值计数)III … -一次批作业设置可以处理多个时间历程和通道 -交互式设置处理参数 -预定义的通用参数(滤波带宽、分级数、结果储存方案等) ?基于雨流矩阵的基本编辑和处理、重构为时间历程(T ecW are RainEdit 模块) -编辑雨流矩阵和雨流计数留数:改变分级大小和个数,对行/列/点/对角线进行计数值的修改/删除 -基于雨流矩阵的时间历程重构,进行加速模拟试验 ?基本的疲劳寿命估计(Falancs Strain & Stress 模块) -根据应变时间历程和材料特性计算该点的疲劳寿命,可以是应变片测得的时间历程 -根据载荷时间历程、应力集中系数和材料特性计算该点的疲劳寿命 -应力法和应变法多种损伤准则、均值校正 -可更改材料特性并存为新材料 ?基于雨流矩阵的载荷组合和外推(T ecW are RainExtra模块) -雨流矩阵的组合、叠加、差别比较等 -由短的时间历程生成雨流,外推到更长的使用工况 -扩展为更苛刻的载荷数据(更粗暴的驾驶员、更恶劣的试验路段等) ?耐久性试验信号处理(TecW are durability signal processing 模块) -提供处理时域信号常用的谱分析和附带交互式滤波器设计工具的频率滤波功能 -快速富氏变换(FFT)和逆变换,功率谱密度函数、频率响应函数、相干函数 -交互式滤波器设计工具:低通、高通、带通和组合式 ?高级耐久性试验信号处理(TecW are Advanced durability signal processing 模块) -检测信号异常、显示时域信号趋势。突出显示不正确的数据段,自动进行信号净化。 -自适应尖峰检测 -消除信号漂移 -逐帧信号分析 ?用多轴雨流技术进行多轴载荷分析(T ecW are MultiRain 和MultiRain Extension 模块) -把雨流矩阵扩展到包含相位影响的多轴向载荷分析 -叠加、外推为更长的测量数据,并重构为时间历程。基于雨流的所有著名的单轴向方法都扩展到多轴向。 ?多轴载荷的雨流投影滤波器(T ecW are RP filter 模块) -设定幅值大小,多通道统一滤波,显著缩短时间历程的长度,保持多轴载荷的相位特征 -保留频率特性,或者把能量损失限制在用户定义的频段内 -时间窗技术,用于保留窗内的频率特性 -试验预处理算法在需要时可以降低信号的斜率或频率 摘要:疲劳破坏是结构的主要失效形式,疲劳失效研究在结构安全分析中扮演着举足轻重的角色。因此结构的疲劳强度和疲劳寿命是其强度和可靠性研究的主要内容之一。机车车辆结构的疲劳设计必须服从一定的疲劳机理,并在系统结构的可靠性安全设计中考虑复合的疲劳设计技术的应用。国内的机车车辆主要结构部件的疲劳寿命评估和分析采用复合的疲劳设计技术,国外从疲劳寿命的理论计算和疲劳试验两个方面在疲劳研究和应用领域有很多新发展的理论方法和技术手段。不论国内国外,一批人几十年如一日致力于疲劳的研究,对疲劳问题研究贡献颇多。 关键词:疲劳 UIC标准疲劳载荷 IIW标准 S-N曲线机车车辆 一、国内外轨道车辆的疲劳研究现状 6月30日15时,备受关注的京沪高铁正式开通运营。作为新中国成立以来一次建设里程最长、投资最大、标准最高的高速铁路,京沪高铁贯通“三市四省”,串起京沪“经济走廊”。京沪高铁的开通,不仅乘客可以享受到便捷与实惠,沿线城市也需面对高铁带来的机遇和挑战。在享受这些待遇的同时,专家指出,各省市要想从中分得一杯羹,配套设施建设以及机车车辆的安全性绝对不容忽略。根据机车车辆的现代设计方法,对结构在要求做到尽可能轻量化的同时,也要求具备高度可靠性和足够的安全性。这两者之间常常出现矛盾,因此,如何准确研究其关键结构部件在运行中的使用寿命以及如何进行结构的抗疲劳设计是结构强度寿命预测领域研究中的前沿课题。 在随机动载作用下的结构疲劳设计更是成为当前机车车辆结构疲劳设计的研究重点,而如何预测关键结构和部件的疲劳寿命又是未来机车车辆结构疲劳设计的重要发展方向之一。机车车辆承受的外部载荷大部分是随时间而变化的循环随机载荷。在这种随机动载荷的作用下,机车车辆的许多构件都产生动态应力,引起疲劳损伤,而损伤累积后的结构破坏的形式经常是疲劳裂纹的萌生和最终结构的断裂破坏。随着国内铁路运行速度的不断提高,一些关键结构部件,如转向架的构架、牵引拉杆等都出现了一些断裂事故。因此,机车车辆的结构疲劳设计已经逐渐成为机车车辆新产品开发前期的必要过程之一,而通过有效的计算方法预测结构的疲劳寿命是结构设计的重要目标。 1.1国外 早在十九世纪后期德国工程师Wohler系统论述了疲劳寿命和循环应力的关系并提出了S-N 曲线和疲劳极限的概念以来,国内外疲劳领域的研究已经产生了大量新的研究方法和研究成果。 结构疲劳设计中主要有两方面的问题:一是用一定材料制成的构件的疲劳寿命曲线;二是结构件的工作应力谱,也就是载荷谱。载荷谱包括外部的载荷及动态特性对结构的影响。根据疲劳寿命曲线和工作应力谱的关系,有3种设计概念:静态设计(仅考虑静强度);工作应力须低于疲劳寿命曲线的疲劳耐久限设计;根据工作强度设计,即运用实际使用条件下的载荷谱。实际载荷因为受到车辆等诸多因素的影响而有相当大的离散性,它严重地影响了载荷谱的最大应力幅值、分布函数及全部循环数。为了对疲劳寿命进行准确的评价,必须知道设计谱的存在概率,并且考虑实际载荷离散性,才可以确定结构可靠的疲劳寿命。 20世纪60年代,世界上第一条高速铁路建成,自那时起,一些国外高速铁路发达国家已经深入研究机车车辆结构轻量化带来的关键结构部件的疲劳强度和疲劳寿命预测问题。其中,包括日本对车轴和焊接构架疲劳问题的研究;法国和德国采用试验台仿真和实际线路相结合的技术开发出试验用的机车车辆疲劳分析方法;英国和美国对转向架累计损伤疲劳方面的研究等等。在这些研究中提出了大量有效的疲劳寿命的预测研究方法。 1.2、国内 1.2.1国内疲劳研究现状与方法 国内铁路相关的科研院所对结构的疲劳寿命也展开了大量的研究和分析,并且得到了很多研 联合 ANSYS WORKBENCH和DESIGNLIFE进行疲劳分析 分类: CAE 疲劳分析 ansys 疲劳失效是机械零部件失效的主要形式。如何对这些结构进行有效的疲劳分析,引起了很多产品设计工程师的关注。对于一般零部件的疲劳分析,并没有理论公式可以解决,几乎都是依据有限元技术以及疲劳分析技术。因此联合有限元分析软件和疲劳分析软件,对这些零部件进行疲劳分析,是解决这类问题的有效途径。 ANSYS WORKBENH是世界上著名的以多物理场分析为特色的有限元分析软件,而DESIGNLIFE是NCODE公司的功能强大的疲劳分析软件。本文以材料力学中中一根变截面轴的弯扭组合的疲劳分析为例,说明如何联合这两款软件对之进行疲劳分析。 问题描述如下: 一根变截面轴,左边轴段(蓝色部分)固定,而在最右边轴段上(红色部分)施加一个1N 的集中力(它导致弯曲变形)和一个1000Nmm的集中力偶(它导致扭转变形), 对于这两种载荷的时间历程,使用力传感器进行测定94秒,得到如下图所示的时间历程曲线。 上图中的红色曲线图反应了集中力随时间的变化规律,横坐标是时间,单位是秒,这里测试了94秒。而纵坐标是载荷的大小。从图中可以看出,最大的载荷是18KN左右,而且也可 以看到,载荷的变化很不规则,并非理想的循环方式。而蓝色曲线反应的是集中力偶随时间变化的规律,其幅值在-2717到2834之间改变。 该轴的材料已经给定,是碳钢SAE1045_390_QT. 现在要求对该轴进行疲劳分析。 使用WORKBENCH和DESIGNLIFE对之进行疲劳分析,分为两步。第一步是在WORKBENCH中建立有限元模型,并分别施加集中力和集中力偶,通过计算,得到两种情况的米塞斯应力,这相当于两种工况,这样可以得到ANSYS WORKBENCH的结构分析结果文件*.rst.第二步在DESIGNLIFE中进行,首先根据疲劳分析的五框图,构造疲劳分析流程,然后分别设定各个框图的属性,即有限元结果文件,载荷文件,材料文件,疲劳分析选项,然后启动分析,通过后处理以查看轴上各点的疲劳寿命。 1. WORKBENCH中建立有限元模型并进行分析。 (1)使用designmodeler创建几何模型。 (2)设置材料属性。 (3)划分网格。 (4)设置分析选项。 这里设置两个载荷步,其目的只是分开弯曲和扭转这两种工况。 最佳答案 移动和选取前后翻页放大缩小 移动和选取CTRL+上下箭头放大缩小 移动和选取鼠标滚轮放大缩小 移动和选取鼠标左键选择天体 移动和选取鼠标右键取消天体选择 移动和选取反斜杠(\) 自动缩小 移动和选取正斜杠(/) 自动放大到所选物体 移动和选取空格键将所选物体置于屏幕中心 显示回车键切换赤道仪和经纬仪 显示F1 全屏显示模式开关 显示c 星座连线显示开关 显示b 星座界线显示开关 显示v 星座名称显示开关 显示r 星座艺术图像显示开关 显示d 星名显示开关 显示n 星云名称显示开关:不显示/显示简称/显示全称 显示e 天球赤道坐标网格显示开关 显示z 循环显示:地平线/地平坐标网格/都不显示 显示p 循环显示:无行星标签/有行星标签/行星标签和轨道 显示g 地面显示开关 显示a 大气显示开关 显示f 地平雾气显示开关 显示q 方向基点(东、西、南、北)显示开关 显示o 切换月面显示比例(4倍/1倍) 显示t 天体追踪开关(移动天幕,始终将选中的天体显示在屏幕中央)显示s 恒星显示开关 显示4 或者,(逗号) 循环显示:黄道/黄道和行星轨道/不显示 显示5 或者 .(句号) 天球赤道显示开关 窗口及其他控制CTRL+s 截取屏幕图像写入stellarium*.bmp文件 窗口及其他控制CTRL+r 显示/关闭脚本记录器 窗口及其他控制CTRL+f 显示/关闭搜索窗口 窗口及其他控制h 显示/关闭帮助窗口 窗口及其他控制i 显示/关闭信息窗口 窗口及其他控制数字1 显示/关闭设置窗口 窗口及其他控制m 显示/关闭文字菜单 窗口及其他控制ESC 关闭打开的窗口(帮助、信息、设置等窗口) 时间和日期6 暂停时间流动(在脚本运行时为暂停脚本执行) 时间和日期7 设置时间流动速度为0(时间停止) 时间和日期8 将时间设为当前时间 时间和日期j 减慢时间流动(在脚本运行时为降低脚本速度) 时间和日期k 设置时间流动速度为正常 时间和日期l 加速时间流动(在脚本运行时为加快脚本速度) 时间和日期- 时间后退24小时 a b a q u s与f a t i g u e结 合疲劳分析 公司标准化编码 [QQX96QT-XQQB89Q8-NQQJ6Q8-MQM9N] Fatigue 分析实例 为如图1所示的中心孔板,材料为LY12-CZ ,板宽50mm,孔直径为8mm ,板厚1mm 。LY12-CZ 铝板弹性模量GPa E 68=,强度极限MPa b 482=σ。在板的两边施加1MPa 的均布拉应力。 图1 中心孔板结构示意图 1、应力计算结果与分析 对上述模型进行有限元计算,结果应力云图如图2所示。 图2 应力云图 2、*.Fil文件说明 *.fil文件是ABAQUS的一种二进制输出文件,供其他软件(如Patran)后处理使用,如生成X-Y曲线,制作二维表格等,可以输出的项目包括:单元、节点、接触面、能量、模态、梁截面等的输出信息,输出的方法是在INP文件中增加输出指令, 生成*.fil文件的步骤如下 对ABAQUS/Standard,可以直接输出.fil文件,步骤如下: 在inp文件中,step步骤之后, end step步骤之前,加上以下内容: *NODE FILE RF,U,V **输出节点的作用力(RF),位移(U,V)到*.fil中 *EL FILE S,E **输出单元应力(S),应变(E)到*.fil中 在abaqus的job界面重新运行inp文件,即可得到对应的fil文件3、疲劳寿命估算 疲劳寿命估算需用到软件中的模块。如图3所示,位于的Tools菜单下,点击Main Interface即可进入模块主界面。 图3 在中进入界面 分类号密级 UDC编号 华中师范大学 硕士学位论文 虚拟天文台数据访问服务(VO-DAS)之任务调度研究 及VO-DAS的应用 田海俊 指导教师郑小平教授、赵永恒研究员、崔辰州副研究员 华中师范大学物理科学与技术学院申请学位级别硕士学科专业名称理论物理 论文提交日期2007年6月论文答辩日期2007年6月 培养单位物理科学与技术学院 学位授予单位华中师范大学 答辩委员会主席 Job Scheduling Research in Virtual Observatory Data Access Service(VO-DAS) and VO-DAS Application Hai-Jun Tian Supervisor: Prof.Xiao-Ping Zheng&Prof.Yong-Heng Zhao&Dr.Chen-Zhou Cui HuaZhong Normal University May,2007 Submitted in total ful?lment of the requirements for the degree of Master in Theory of Physics 摘要 天文观测数据资源具有时间跨度大、数据量大、存储管理分散、管理工具驳杂等特点。如何提供给天文学家一个统一访问这些分布存放的异构数据资源的方案,是虚拟天文台的一个重要研究课题。 计算机与互联网技术的飞速发展,网格技术、XML技术、语义网技术等全新IT技术的涌现,以及在此技术背景下,国际虚拟天文台联盟(IVOA)依据天文自身的特点不断提出并完善的各种规范标准,使得海量、分布式、多波段天文数据的无缝融合和处理成为可能。 对于异地异构数据的统一访问,我们基于开放网格服务架构(OGSA)提出了一种网格的解决方案:使用OGSA-DAI技术实现了对异地异构的天文星表数据、图像数据和光谱数据的统一封装(DataNode);利用ADQL语言完成对任务的统一描述;基于WSRF框架完善了对数据资源、计算资源以及存储资源的任务调度。我们设计的虚拟天文台数据访问服务(VO-DAS)实现了对数据资源、计算资源、存储资源的自动发现以及异地异构数据的联合访问并对访问结果进行数据分析的一体化工作模式,这将使天文数据源的多波段交叉证认、海量数据分析及对分析结果的可视化等成为可能。VO-DAS支持国际虚拟天文台联盟(IVOA)的各项相关标准,使得它具有良好的互操作性,它的对外接口简单实用、可以针对不同需求的天文数据用户发展出多种网格应用产品。 论文以VO-DAS的任务调度及其实现为重点,分别对VO-DAS的设计模式、Session 机制、生命周期、资源销毁、异常处理等模块进行了详细的阐述,并从多个角度分别给出了系统的设计图。为了验证以OGSA-DAI为基础的天文数据访问的可行性和性能,我们采用两个科学范例对VO-DAS原型进行了实验。 论文最后以VO-DAS对China-VO Ephemeris WS计算平台的扩展为例,介绍了VO-DAS外部接口的扩展方法,以及VO-DAS在星历计算方面的应用,并简要阐述了VO-DAS在其他方面的科学应用。 关键词:虚拟天文台,数据访问,网格技术,OGSA-DAI 常用工具软件的的分类、安装于使用技巧 XXX XXX系XXX专业1101B 随着社会的发展,计算机在我们的生活中扮演着越来越重要的角色。目前,人类社会已经进入了计算机网络时代,计算机和互联网已经深深地进入到老百姓的日常生活工作和学习中。当然,学习怎么使用计算机也是人们所必须的,要想学习如何使用当然要从最简单开始--使用计算机常用的软件。 下面介绍一下什么是工具软件:它是为了方便用户管理计算机系统而专门设计的软件。他们是为了增强和扩充原有的操作系统的某些功能而安装使用的的辅助性软件。有了它们可以是我们更方便、更快捷的使用计算机。下面介绍常用工具软件的分类安装与使用。 一、常用工具软件的分类: 1、安全类工具软件: 2、、系统工具软件: 3、网络工具软件: 4、网络软件通信工具: 5、文件管工具软件: 6、图文处理工具软件: 7、媒体播放与制作工具软件: 二、常用工具软件的安装 软件安装时一定要注意软件的安全性。有些软件可能含有某些未知的病毒或木马。所以尽量使用安全的即“绿色”的软件。如果想使用该软件,但又不知道该软件的安全性可以通过 安装虚拟机对该软件进行安装和测试。下面简单介绍一个常用工具软件的安装过程。 暴风影音: (1)、打开暴风影音安装包,进入暴风影音安装向导,对许可协 议选择“接受”。 (2)、选定安装组件 (3)选择目标文件夹 (4)、暴风影音进入安装状态,当进度条充满,“下一步”按钮由灰变黑时,点击。 (5)、选择软件推荐 (6)安装完成 三、使用技巧 软件在使用时有的附加有说明文档,如有疑问,可以点击文档获取。软件在使用的过程中要注意防护,防止其被病毒入侵,或者感染木马。若对软件不放心可以使用虚拟机对软件进行使用和操作。 疲劳分析,从零开始 1 测量应变、应力谱图 (1)衡量应力集中的区域,布置应变片 可以通过模拟(有限元)或试验(原型上涂上一层油漆,待油漆干后施加载荷,油漆剥落的地方应力集中),确定应力集中的区域,然后按左下图在应力集中区域布置三个应变片: 因为材料是各向同性,所以x,y方向并不一定是水平和竖直方向,但两者一定要垂直,中间一个一定要和x,y方向成45°角。 (2)根据测的应变和材料性能,计算应力 测得的三个应变,分别记为εx, εy, εxy。两个主应力(假设只有弹性变形): 其中,E为材料的弹性模量,μ为泊松比。根据这两个主应力,可以计算出有些方法可能需要的等效应力(主要目的是将多分量的应力状态转化为一个数值,以方便应用材料的疲劳数据),如米塞斯等效应力: ()()222122121σσσσσ++-=m 或最大剪应力: ()2121 σσστ-= 实际测量的是应变-时间谱图,应力(或等效应力)-时间谱图可由上述公式计算。 (3)分解谱图 就是对上面测得的应力(应变)-时间谱图进行分解统计,计算出不同应力(包括幅度和平均值)循环下的次数,以便计算累积的损伤。最常用的是雨流法(rainflow counting method )。 2 获取材料数据 如果载荷频率不高,可以做一组简单的疲劳测试(正弦应力,拉压或弯曲均可,有国家标准): 得到一条应力-寿命(即循环次数)曲线,即所谓的S-N 曲线: 1:如果载荷频率较高或温度变化较大,还要测量不同平均应力和不同温度下的S-N 载荷,以便进行插值计算,因为此时平均应力对寿命有影响。也可以根据不同的经验公式(如Goodman准则,Gerber准则等),以及其他材料性能(如拉伸强度,破坏强度等),由普通的S-N曲线(即平均应力为0)来计算平均应力不为零时对应的疲劳寿命。 2:如果材料数据极为有限,或者公司很穷很懒不愿做疲劳试验,也可以由材料的强度估算疲劳性能。 3::如果出现塑性应变,累计损伤一般基于应变-寿命曲线(即E-N曲线),所以需要施加应变载荷。 3 损伤计算 到目前为止,疲劳分析基本上是基于经验公式,还没有完全统一的理论。损伤 累积的计算方法有很多种,最常用的是线性累计损伤(即Miner 准则), 但其结果不保守,计算得到的寿命偏高。 ∑∑≥=0.1,f i i i N n D 准确度比较高的累计准则是双线性准则,并且计算比“破坏曲线法”要容易,所以,是一个很好的折衷选择。 媒体文章 结构疲劳分析技术新进展 安世亚太 雷先华 众所周知,疲劳累积损伤是导致航空产品结构失效的主要原因之一,而结构失效往往给航空器带来灾难性后果,因而在现代航空产品设计中通常要求进行较为准确的结构疲劳寿命预测。由于疲劳的形式和影响结构疲劳的因素都非常繁多,因而并没有一套放之四海而皆准的疲劳寿命预测算法,多数算法都只能在某些特定情况下才能获得满足工程精度要求的预测结果。现代疲劳分析软件通常需要在通用疲劳算法的丰富性和先进性(核心)、有限元应力应变计算的准确性和精确性(基础)、以及针对特殊疲劳问题进行处理的方法多样性和完整性(全面)等方面进行持续不断的改进方能较好地满足工程设计的要求。下面我们以安世亚太高级疲劳分析软件Fe-safe为例,简要阐述其在这些方面的新进展。 1.基于临界平面法的精确多轴疲劳算法 航空器上的零部件通常都是在多轴疲劳载荷作用下工作,此时,材料的循环应力应变关系由于受到加载路径的影响而变得相当复杂。目前,多轴疲劳破坏的准则主要有三大类:应力准则、应变准则和能量准则。众多分析及试验对比证明,组合最大剪应变和法向应变的Brown-Miller准则和Wang-Brown准则对于韧性材料具有最好的计算精度,而主应变准则则适合于脆性材料。 对于航空结构中常见的、而且是最复杂的多轴非比例加载情况,由于载荷间的相位关系在不断变化,结构中每个位置点处的主应力/应变、最大剪应力/应变等参数的方向(所在平面)都是随加载历程而不断变化的,也就是说损伤累积在每个位置处都有方向性。对于很多软件所采用的Wang-Brown准则,它无法直接考虑这种方向变化性,只是利用了一个附加的材料参数来考虑法向应变对裂纹萌生的影响。 Fe-safe独特地提供了“临界平面”算法来配合Brown-Miller准则、主应变准则等,以获得最好的计算精度。临界平面法的核心思想是:将每个位置处的应变分解到按某种规律变化的一系列平面上,计算每个平面上的损伤,以这些平面中的最小寿命作为该位置的寿命。 2.独特的焊接结构疲劳算法 焊接连接是航空器上非常常见的结构连接方式,在航空结构设计中具有非常重要的地位,但焊接部位同时也是最容易产生疲劳裂纹问题的位置。现有疲劳分析软件几乎无一例外都是按照“焊接分类”(如英国BS7608标准)的方法来进行焊接结构疲劳分析的,该方法在大量工程实例的基础上根据预期的疲劳裂纹位置而将焊接结构分为数个类型(B、C、D、E、F、F2、G、W等),每个类型对应一条相互平行的S-N曲线用于疲劳评估。因此,在焊接结构疲劳分析中存在两个主要问题极大地影响了其工程应用:一是焊接分类的标准难以把握(事实上焊接类型是无穷多的);二是由于焊接位置通常都是应力集中位置,难以精确计算应力分布。 抗疲劳设计 1、疲劳的概念 疲劳是指材料在循环应力和应变作用下,在一处或者几处逐渐产生局部永久性累计损伤,经一定循环次数产生裂纹或者突然发生完全断裂的过程。 2、疲劳破坏失效的特点 金属零件在使用中发生疲劳破坏的特点:(1)突发性;(2)高度局部性;(3)对各种缺陷的敏感性。 3、疲劳破坏机理 金属的疲劳破坏可以分为疲劳裂纹萌生、疲劳裂纹扩展和失稳断裂三个阶段。 (1)疲劳裂纹萌生 疲劳裂纹萌生是由塑形应变集中引起,有三种常见的萌生方式:滑移带开裂,晶界或孪晶界开裂,夹杂物或相与基体的界面开裂。其中,滑移带开裂不但是最常见的疲劳裂纹萌生方式,也是三种萌生方式中最基本的一种。 (2)疲劳裂纹扩展 疲劳裂纹扩展可以分为第Ⅰ阶段裂纹扩展和第Ⅱ阶段裂纹扩展两个阶段。其中,第Ⅰ阶段裂纹扩展在断口上一般并不留下任何痕迹,第Ⅱ阶段裂纹扩展则常留下“条带”的显微特征。 (3)失稳断裂 失稳断裂是疲劳破坏的最终阶段,它与前两个阶段不同,是在一瞬间突然发生的。 4、疲劳破坏的原因 影响机械零件疲劳强度的因素很多,归纳起来可以从内因(材料的化学成分、组织、内部缺陷、材料强韧化、材料的选择及热处理状况等)和外因(零件几何形状及表面状态、装配与连接、使用环境因素、结构设计、载荷特性等)两个方面来考虑。 (1)缺口效应 在机械零件中,由于结构上的要求,一般都存在有槽沟、轴肩、孔、拐角、切口等截面变化,这些截面变化称之为缺口。在这些缺口处,不可避免地要产生应力集中,而应力集中又必然使零件的局部应力提高。当零件承受静载荷时,由于常用的结构材料都是延性材料,有一定的塑形,在破坏以前有一个宏观塑形变形过程,使零件上的应力重新分配,自动趋于均匀化,因此,缺口对零件的静强度一般没有多大的影响。疲劳破坏的情形完全不同,这时截面上的名义应力尚未达到材料的屈服极限,因此破坏以前不产生明显的宏观塑性变形。这样便使得应力集中处的疲劳强度比光滑部分底,常常成为零件的薄弱环节。因此,抗疲劳设计时必须考虑缺口效应。 (2)尺寸效应 式样和零件的尺寸对其疲劳强度影响很大,一般说来,零件和试样的尺寸增大时疲劳强度降低。这种疲劳强度随着零件尺寸增大而降低的现象称为尺寸效应。 (3)表面加工方法的影响 金属切削加工不仅是一个使制件得到一定尺寸和形状的过程,而且与热处理一样,对金属的性质(确切的说,是对于制件表面层的性质)也有重要影响。制件的疲劳强度多由表面层的性质决定,因此,切削用量、切削工具的几何形状等与切削加工有关的因素,都对疲劳强度的发生有影响。 (4)平均应力的影响 拉伸平均应力使疲劳强度和寿命降低,压缩平均应力使疲劳强度和寿命增加。 (5)其它因素的影响 a)加载频率的影响低频使疲劳极限降低,高频使疲劳极限升高; b)应力波形的影响循环的波形(正玄、三角形、梯形、矩形等)确定 了在最大应力下停留时间。在高温与腐蚀介质条件下循环波形有较 大影响。滞后回线特性与循环波形密切相关,因此,在应变伏较大 的情况下,循环波形对裂纹形成寿命有很大影响,而对裂纹扩展寿 命影响很小。在焊接试验时,由三角波变为方波,使寿命明显降低。 c)中间停歇的影响1>中间停歇对疲劳极限没有明显的影响;2>中间 停歇对疲劳寿命有一定影响,其影响随材料而异。对低碳钢影响较 大,每隔10%N停歇6-8个小时可使疲劳寿命提高一倍以上;而对 于合金钢、铝合金、镁、铜等金属,则影响很小,停歇越频繁,停 歇时间越长,对疲劳寿命的影响越大。停歇时若对试样进行中间加 福建师范大学地理科学学院(350007) 贺志康 巧用虚拟天文馆软件Stellarium 演示太阳周日视运动轨迹 在高中地理必修1[1]《地球的运动》这一节中,昼夜交替与正午太阳高度角的变化两部分内容都涉及到一个知识点即太阳的周日运动。2012年安徽高考文综选择题第30题的正确解答就需要先确定太阳的方位,相类似的题目也比较常见,但鉴于平时疏于观察与空间思维能力有限等原因,大部分学生对这个知识点感觉很困难,难以理解与掌握。可以说,太阳周日视运动既是重点,也是难点。通过虚拟天文馆软件Stellarium 模拟太阳周日视运动,演示其运动轨迹,形象而又生动,有助于学生从感性认识向理性认识的转变,利于学生对太阳周日视运动的理解。 一、虚拟天文馆软件简介 虚拟天文馆软件Stellarium 是一款免费的虚拟星象仪的计算机软件。它使用OpenGL 对星空进行实时渲染,在电脑桌面上生成一块虚拟3D 天空,所模拟的星空效果与用肉眼,望远镜或者天文望远镜进行实际观察所看到的星空基本没有什么区别,形象逼真。它可以根据观测者所在的地方时和位置,计算天空中太阳、月球、行星和恒星的位置,并将其显示出来。它还可以绘制星座、虚拟天文现象(如日食、月食和流星雨等)。总之,Stellarium 是一款功能极其强大的软件,深受广大天文爱好者的喜欢,对地理教师的教学也很有用。 二、部分操作按键 Stellarium 提供了较多的键盘操作指令,版本更新很快。现在以Stellarium 0.12.1为例,将部分可能与演示操作有关的按键列出(如表1),剩余部分的操作指令,读者如有兴趣,打开软件后,按F1键进一步了解。 表1 操作按键说明 按键说明鼠标滚轮放大缩小 鼠标左键选择天体或移动画面鼠标右键取消天体选择 F1说明F2设定F5日期及时间F6所在地点Z 地平坐标网格 Q 基点 J 减缓时间流逝K 正常时间速度8调至当前时刻L 加快时间流逝 Ctrl+Q 退出 三、演示过程 下载安装完Stellarium 后,打开软件,此时如果显示为英文,则按F2键,出现一个界面,点击中间的下拉菜单进行语言设置,将语言设置为简体中文。软件初始设置地点为法国巴黎,时间是与电脑时间同步。 以北京为例,来演示当地2013年6月1日的太阳周日视运动轨迹。按F6键,则会出现一个界面,在这个界面的右上角的下拉菜单中寻找“北京”,或者先通过其他途径找到北京的经纬度,再在该界面的左下角输入北京的经纬度数值。北京的经纬度为东经116.46°,北纬39.92°。然后按住左键,拉动画面,找到“东”方向。若找不到,按Q 键。同时按Z 键,此时画面会显示地平坐标网络。接着找到太阳,单击鼠标左键,将太阳选中,此时画面左上角会出现与太阳相关的天文参数,如太阳的星等、赤经与赤纬、时角与赤纬等,特别 摘要:介绍了虚拟天文馆软件Stellarium,列举了软件的主要操作按键,介绍了用软件演示太阳周日视运动的操作过程。 关键词:虚拟天文馆软件;Stellarium;太阳周日视运动 常用工具软件培训大纲 Company Document number:WTUT-WT88Y-W8BBGB- 《常用工具软件》培训大纲 I.课程的性质 计算机日益普及,应用日益广泛,许多问题需要计算机使用者自己处理。工具软件拥有体积小、功能强等优点,具有独特优势。学会选择和使用各种工具软件,就能更充分发挥计算机的作用,享受到计算机强大功能带来的方便与乐趣。 本课程从学员的实际需要出发,介绍最常用工具软件的实用功能。尽量选取各类软件中使用广泛、功能完备、简单易学的软件进行讲解。各章所选软件都是经过多年实践检验,拥有众多用户的经典软件。 学习本课程不需要任何相关的预备知识。学员只要打开书,开启PC 运行相应的软件,按照书中所讲的步骤一步步地做下去,就可以在边看书边实践的过程中,不知不觉地学会使用计算机去完成不同工作任务、享受信息时代的高质量生活。本课程的另外一个目的,就是能使初学者少走弯路,能够更快更全面地掌握计算机这个智能工具。 Ⅱ.课程的目的和任务 “常用工具软件”课程的培训目的是: 1.了解常用工具软件的概念与不同种类,掌握根据不同工作需求选择软件工具的方法和习惯。 2.了解计算机安全知识与法律法规,掌握使用反病毒工具的基本方法与步骤。 3.通过对不同类型常用工具软件的操作说明与讲解,使读者掌握这些软件的基本操作,用以能动地解决不同的工作问题。 4.了解系统优化的常识,掌握一种系统优化软件,提高使用计算机解决问题的能力与效率。 Ⅲ.学时安排 本课程共包含10部分内容,其中视频教程第一讲是课本外的增补内容,相当于常用工具软件课程的概述部分,请注意在其中了解关于软件分类与选用原则的基础知识; 本课程共包含10部分内容。第1部分介绍计算机安全知识与病毒防护工具,第2部分介绍文件压缩工具,第3部分介绍翻译工具,第4部分介绍多媒体播放工具,第5部分介绍声音处理工具,第6部分介绍图片图像浏览工具,第7部分介绍网络邮件工具,第8部分介绍网络传输工具,第9部分介绍网络实时通信工具,第10部分介绍系统优化与维护工具。 其中第4部分、第5部分、第8部分、第9部分都介绍了两种同类的工具软件,学员只需熟练掌握其中一种即可。 在视频教程的最后一讲也是增补内容,除了介绍在信息技术发展迅速的背景下如何进行工具软件知识与技能的动态更新,还讲了在选择使用工 第三章疲劳载荷谱的统计处理 3.1 疲劳载荷谱的统计处理理论基础 3.1.1 数字化滤波 频率分析的典型参量是功率谱密度(PSD),如像确定频率为4Hz对应的幅值的均方根值,只需要求取功率谱密度下对应的3.5-4Hz之间的面积。 3.1.2 雨流计数法 循环计数法:将不规则的随机载荷-时间历程,转化为一系列循环的方法。 3.2 数据的导入与显示 (1)新建:File>New (2)导入:Tools>Fatigue Utilities>File Conversion Utilities>Covert ASCII.dac to Binary...>Single Channel(设置,注意Header Lines to skip要跳过的行数)>exit (3)查看:Tools>Fatigue Utilities>Graphic Display>Quick Look Display 1)放大:View>Window X,输入X的最值 2)读取:①左击任何位置,状态栏显示②数据轨迹:Display>Track 3)显示数据点:Display>Join Points;显示实线图:Display>Join 4)网格和可选坐标轴:Axes>Axes Type/Grid 5)显示某段时间信号的统计信息:Display>Wstats,放大 3.3 数字滤波去除电压干扰信号 (1)载荷时间历程的PSD分析 1)File>New 2)Tools>Fatigue Utilities>Advanced Load Utilities>Auto Spectral density (2)信号的滤波 1)Tools>Fatigue Utilites>Advanced Load Utilities>Fast Fourier Filtering 2)比较滤波前后结果:Tools>Fatigue Utilities>Graphic Display>Multi-file Display (3)滤波稳定性检查:比较前后PSD,多文件叠加显示 第四章应力疲劳分析 4.2 载荷谱块的创建与疲劳寿命计算 (1)创建载荷谱块:Tools>Fatigur Utility>Load Management>Add an Entry>Block program (2)疲劳分析:Tools>Fatigue Utilities>Advanced fatigue utilities>选方法 4.3 零部件疲劳分析 (1)导入有限元模型及应力结果:工具栏Import>Action、Object、Method,查看Results (2)疲劳分析 1)设置疲劳分析方法:工具栏Analysis,设置 2)设置疲劳载荷 ①创建载荷时间历程文件Loading info>Time History Manager ②将有限元分析工况与时间载荷关联:Loading Info>Load case空白>Get/Filte result... 首先要明确我们大体上遇到的疲劳问题均为高周疲劳问题(当然不排除个别如压力容器和燃气轮机的零件疲劳问题),应力水平较低,破坏循环次数一般大于十的四次方或五次方。疲劳设计和寿命预测方法一般有无限长寿命设计法和有限寿命设计法。无限寿命设计法使用的是S-N曲线的右段水平部分(疲劳极限),而有限寿命设计法使用的是S-N曲线的左段斜线部分。有限寿命设计的设计应力一般高于疲劳极限,这时就不能只考虑最高应力,而要按照一定的累积损伤理论估算总的疲劳损伤。 大多数零件所受循环载荷的幅值都是变化的,也就是说,大多数零件都是在变幅载荷下工作。变幅载荷下的疲劳破坏,是不同频率和幅值的载荷所造成的损伤逐渐积累的结果。因此,疲劳累计损伤是有限寿命设计的核心问题。 一般常用三种累积损伤理论,其各自适用范围如下: 线性疲劳累积损伤理论适合于高周疲劳寿命计算,可较好地预测疲劳寿命均值。线性累计损伤理论指的是损伤积累与循环次数成线性关系,包括Miner法则和相对Miner法则;Miner 理论的表达式为(D为损伤) 修正的线性疲劳累积损伤理论适合于低周疲劳寿命计算; 而非线性疲劳累积损伤理论对二级加载情况的疲劳寿命估算比较有效。非线性累计损伤理论包括损伤曲线法和Corten-Dolan理论。 要注意的是,只有当应力高于疲劳极限时,每一循环使结构产生一定量的损伤,这种损伤是累积的;当应力低于疲劳极限时,由于此时N将无穷大,因此,它的循环便不必考虑。 国内外常用的疲劳设计方法-安全寿命法的具体步骤为: 1. 得到用于疲劳计算的载荷谱; 2. 计算构件各位置的应力历程; 3. 利用计数法(如雨流法)将应力历程整理为不同应力幅及其相应的循环次数; 4. 由S-N曲线得到应力幅对应的使用极限; 5. 利用累积损伤理论(如Miner准则)计算总损伤; 6. 计算安全寿命Ts=TL/D MSC.Fatigue软件与此方法结合的很好,然而,有限元法解决实际工程中的疲劳问题还有一些问题: 1. 目前疲劳理论对于材料微裂纹的形成和扩展过程中的某些效应无法全面彻底地分析其机理,因此在此基础上发展而来的各种方法在某些情况下可能导致结果误差很大; 2. 各种疲劳分析有限元法对应力类型及作用方式十分敏感,而实际工程中这些因素往往无法精确得到,造成结果分散性相当大; 3. 很难预先判断易发生疲劳破坏的危险区域,而想要对其中所有可能发生初始裂纹的节点进行细化建模分析目前显然不太现实; 4. 不确定因素如载荷时间历程的复杂性、模型试验结果的分散性、残余应力及腐蚀影响等,可能导致结果与实际情况存在量级上的偏差。 对于常用的疲劳分析软件Fatigue,其自带三种分析方法适用范围如下: 1. S-N曲线总寿命分析法: 疲劳寿命相当长的结构,且很少发生塑性变形; 裂纹初始化及裂纹扩展模型不适用的结构如复合材料、焊接材料、塑料以及一些非钢结构;已有针对结构的大量现成S-N数据的情形; 焊接热点区域疲劳分析以及随机振动引发的疲劳问题。 2. 适用裂纹初始化分析法的情形: 基本没有缺陷的金属构件;公路桥梁结构桥梁抗疲劳设计方法应用
虚拟天文馆“学习指南”(六下)复习过程
十大常用工具软件集锦
LMS TecWare疲劳载荷处理软件
疲劳分析流程 fatigue
workbench与其他软件联合疲劳寿命分析
虚拟天文馆操作手册
abaqus与fatigue结合疲劳分析
[硕士论文] 虚拟天文台数据访问服务(VO-DAS)之任务调度研究及VO-DAS的应用
常用工具软件的的分类
疲劳分析计算的流程
结构疲劳分析技术新进展
抗疲劳设计
巧用虚拟天文馆软件Stellarium演示太阳周日视运动轨迹_贺志康
常用工具软件培训大纲
Msc.Fatigue疲劳分析实例指导教程
有限元软件进行疲劳分析的若干问题