pheatmap
Package‘pheatmap’
September14,2012
Type Package
Title Pretty Heatmaps
Version0.7.3
Date2010-11-3
Author Raivo Kolde
Maintainer Raivo Kolde
Depends R(>=2.0)
Description A package for drawing pretty heatmaps in R.The ordinary
heatmap function in R has several drawbacks when it comes to
producing publication quality heatmaps.It is hard to produce
pictures with consistent text,cell and overall sizes and
shapes.The function pheatmap tries to alleviate the problems
by offering more?ne grained control over heatmap dimensions and appearance.
Imports grid
License GPL-2
LazyLoad yes
Collate’pheatmap-package.r’’pheatmap.r’
Repository CRAN
Date/Publication2012-09-1412:07:21
R topics documented:
pheatmap-package (2)
pheatmap (2)
Index6
1
pheatmap-package Pretty heatmaps
Description
The package for drawing pretty heatmaps in R.The ordinary heatmap function in R has several
drawbacks when it comes to producing publication quality heatmaps.It is hard to produce pictures
with consistent text,cell and overall sizes.The function pheatmap tries to alleviate the problems by
offering more?ne grained control over heatmap dimensions and appearance.
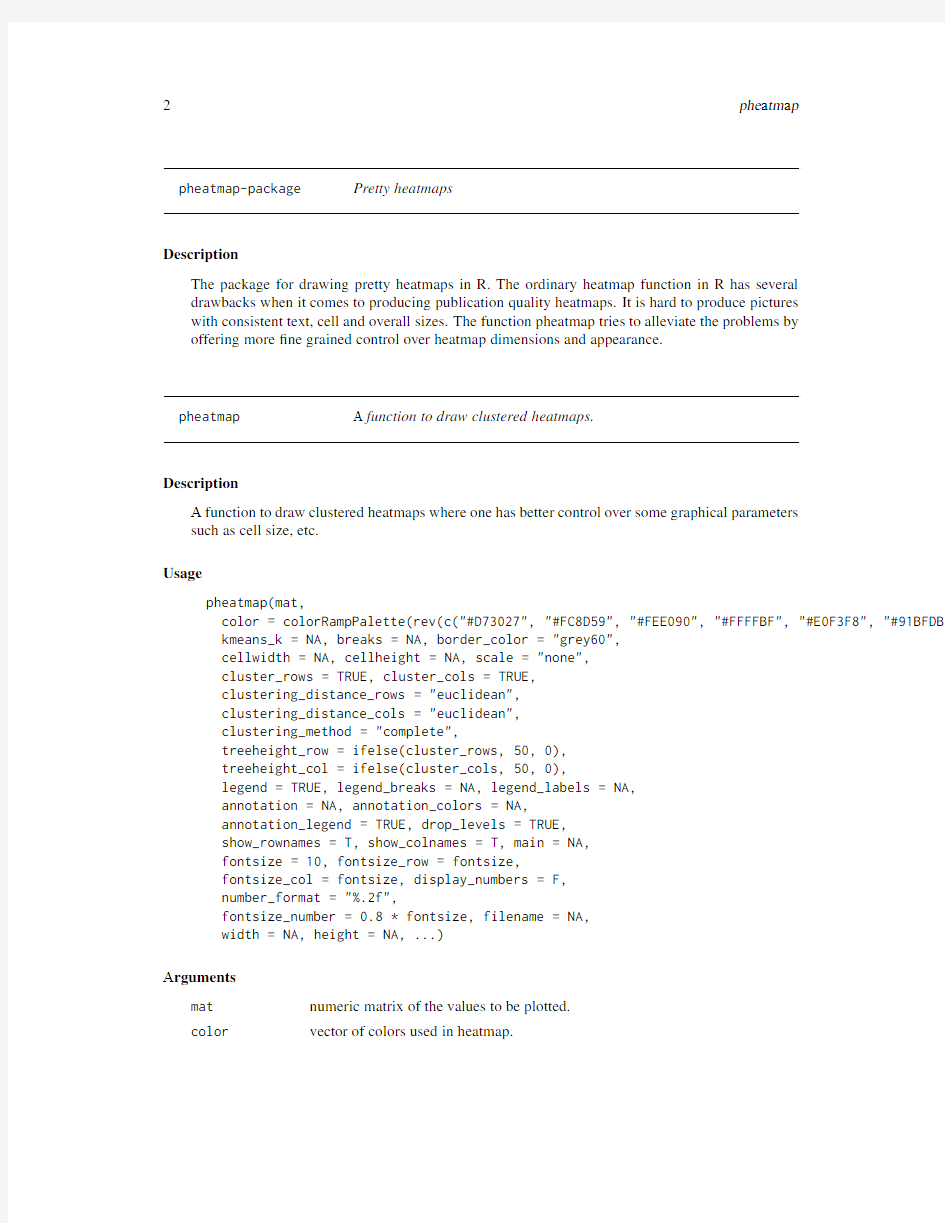
pheatmap A function to draw clustered heatmaps.
Description
A function to draw clustered heatmaps where one has better control over some graphical parameters
such as cell size,etc.
Usage
pheatmap(mat,
color=colorRampPalette(rev(c("#D73 27","#FC8D59","#FEE 9 ","#FFFFBF","#E F3F8","#91BFDB", kmeans_k=NA,breaks=NA,border_color="grey6 ",
cellwidth=NA,cellheight=NA,scale="none",
cluster_rows=TRUE,cluster_cols=TRUE,
clustering_distance_rows="euclidean",
clustering_distance_cols="euclidean",
clustering_method="complete",
treeheight_row=ifelse(cluster_rows,5 , ),
treeheight_col=ifelse(cluster_cols,5 , ),
legend=TRUE,legend_breaks=NA,legend_labels=NA,
annotation=NA,annotation_colors=NA,
annotation_legend=TRUE,drop_levels=TRUE,
show_rownames=T,show_colnames=T,main=NA,
fontsize=1 ,fontsize_row=fontsize,
fontsize_col=fontsize,display_numbers=F,
number_format="%.2f",
fontsize_number= .8*fontsize,filename=NA,
width=NA,height=NA,...)
Arguments
mat numeric matrix of the values to be plotted.
color vector of colors used in heatmap.
kmeans_k the number of kmeans clusters to make,if we want to agggregate the rows before drawing heatmap.If NA then the rows are not aggregated.
breaks a sequence of numbers that covers the range of values in mat and is one element longer than color https://www.360docs.net/doc/a412060462.html,ed for mapping values to https://www.360docs.net/doc/a412060462.html,eful,if needed
to map certain values to certain colors,to certain values.If value is NA then the
breaks are calculated automatically.
border_color color of cell borders on heatmap,use NA if no border should be drawn.
cellwidth individual cell width in points.If left as NA,then the values depend on the size of plotting window.
cellheight individual cell height in points.If left as NA,then the values depend on the size of plotting window.
scale character indicating if the values should be centered and scaled in either the row direction or the column direction,or none.Corresponding values are"row",
"column"and"none"
cluster_rows boolean values determining if rows should be clustered,
cluster_cols boolean values determining if columns should be clustered.
clustering_distance_rows
distance measure used in clustering rows.Possible values are"correlation"
for Pearson correlation and all the distances supported by dist,such as"euclidean",
etc.If the value is none of the above it is assumed that a distance matrix is pro-
vided.
clustering_distance_cols
distance measure used in clustering columns.Possible values the same as for
clustering_distance_rows.
clustering_method
clustering method used.Accepts the same values as hclust.
treeheight_row the height of a tree for rows,if these are clustered.Default value50points. treeheight_col the height of a tree for columns,if these are clustered.Default value50points. legend logical to determine if legend should be drawn or not.
legend_breaks vector of breakpoints for the legend.
legend_labels vector of labels for the legend_breaks.
annotation data frame that speci?es the annotations shown on top of the columns.Each row de?nes the features for a speci?c column.The columns in the data and rows in
the annotation are matched using corresponding row and column names.Note
that color schemes takes into account if variable is continuous or discrete. annotation_colors
list for specifying annotation track colors manually.It is possible to de?ne the
colors for only some of the features.Check examples for details.
annotation_legend
boolean value showing if the legend for annotation tracks should be drawn.
drop_levels logical to determine if unused levels are also shown in the legend
show_rownames boolean specifying if column names are be shown.
show_colnames boolean specifying if column names are be shown.
main the title of the plot
fontsize base fontsize for the plot
fontsize_row fontsize for rownames(Default:fontsize)
fontsize_col fontsize for colnames(Default:fontsize)
display_numbers
logical determining if the numeric values are also printed to the cells.
number_format format strings(C printf style)of the numbers shown in cells.For example "%.2f"shows2decimal places and"%.1e"shows exponential notation(see
more in sprintf).
fontsize_number
fontsize of the numbers displayed in cells
filename?le path where to save the picture.Filetype is decided by the extension in the path.Currently following formats are supported:png,pdf,tiff,bmp,jpeg.Even
if the plot does not?t into the plotting window,the?le size is calculated so that
the plot would?t there,unless speci?ed otherwise.
width manual option for determining the output?le width in
height manual option for determining the output?le height in inches.
...graphical parameters for the text used in plot.Parameters passed to grid.text, see gpar.
Details
The function also allows to aggregate the rows using kmeans clustering.This is advisable if number of rows is so big that R cannot handle their hierarchical clustering anymore,roughly more than1000.
Instead of showing all the rows separately one can cluster the rows in advance and show only the cluster centers.The number of clusters can be tuned with parameter kmeans_k.
Value
Invisibly a list of components
?tree_row the clustering of rows as hclust object
?tree_col the clustering of columns as hclust object
?kmeans the kmeans clustering of rows if parameter kmeans_k was speci?ed
Author(s)
Raivo Kolde
Examples
#Generate some data
test=matrix(rnorm(2 ),2 ,1 )
test[1:1 ,seq(1,1 ,2)]=test[1:1 ,seq(1,1 ,2)]+3
test[11:2 ,seq(2,1 ,2)]=test[11:2 ,seq(2,1 ,2)]+2
test[15:2 ,seq(2,1 ,2)]=test[15:2 ,seq(2,1 ,2)]+4
colnames(test)=paste("Test",1:1 ,sep="")
rownames(test)=paste("Gene",1:2 ,sep="")
#Draw heatmaps
pheatmap(test)
pheatmap(test,kmeans_k=2)
pheatmap(test,scale="row",clustering_distance_rows="correlation")
pheatmap(test,color=colorRampPalette(c("navy","white","firebrick3"))(5 ))
pheatmap(test,cluster_row=FALSE)
pheatmap(test,legend=FALSE)
pheatmap(test,display_numbers=TRUE)
pheatmap(test,display_numbers=TRUE,number_format="%.1e")
pheatmap(test,cluster_row=FALSE,legend_breaks=-1:4,legend_labels=c(" ",
"1e-4","1e-3","1e-2","1e-1","1"))
pheatmap(test,cellwidth=15,cellheight=12,main="Example heatmap")
pheatmap(test,cellwidth=15,cellheight=12,fontsize=8,filename="test.pdf")
#Generate column annotations
annotation=data.frame(Var1=factor(1:1 \%\%2== ,labels=c("Class1","Class2")),Var2=1:1 ) annotation$Var1=factor(annotation$Var1,levels=c("Class1","Class2","Class3"))
rownames(annotation)=paste("Test",1:1 ,sep="")
pheatmap(test,annotation=annotation)
pheatmap(test,annotation=annotation,annotation_legend=FALSE)
pheatmap(test,annotation=annotation,annotation_legend=FALSE,drop_levels=FALSE)
#Specify colors
Var1=c("navy","darkgreen")
names(Var1)=c("Class1","Class2")
Var2=c("lightgreen","navy")
ann_colors=list(Var1=Var1,Var2=Var2)
pheatmap(test,annotation=annotation,annotation_colors=ann_colors,main="Example with all the features") #Specifying clustering from distance matrix
drows=dist(test,method="minkowski")
dcols=dist(t(test),method="minkowski")
pheatmap(test,clustering_distance_rows=drows,clustering_distance_cols=dcols)
Index
dist,3
gpar,4
grid.text,4
hclust,3,4
pheatmap,2
pheatmap-package,2
sprintf,4
6