An ordinal optimization based method for power distribution system control
Available online at https://www.360docs.net/doc/bb16689418.html, Electric Power Systems Research78(2008)
694–702
An ordinal optimization based method for power
distribution system control
Erkan Atmaca?
Istanbul University,Faculty of Engineering,Electrical Engineering Department,34850Avc?lar,˙Istanbul,Turkey
Received18August2006;received in revised form19January2007;accepted17May2007
Available online28June2007
Abstract
This work presents an Ordinal Optimization Theory based method for power distribution system control.The solution procedure bases on an evolutionary search scheme.The method aims at minimizing the total power losses on network feeders while keeping the node voltages at near rated values against changing loading conditions.By relaxing the de?nition of optimality and softening the goal of optimization,ordinal optimization makes the problem easier as well as the solution process faster.A solution can be de?ned as good enough in performance value if it is one of the best m-percent solutions on the search space with probability P%.A solution can be de?ned as good enough also if its performance value approximates to the optimal value to a pre-de?ned extent.This work estimates the performance value,the total power loss,of the optimum state of power distribution network at a given loading condition.Then,with the two relaxed de?nitions for optimality,it?nds the optimal settings of on-load tap changers and capacitors in a24-h time frame.Results verify our method is proper for on-line and off-line operation.
?2007Elsevier B.V.All rights reserved.
Keywords:Power distribution control;Ordinal optimization;Performance value;Good enough criterion
1.Introduction
Due to recent rises in energy prices and already common use of sensitive electronic loads,power distribution system control is an important issue concerned with power loss minimization and electric power quality.To deal with this issue utilities make use of new technologies providing for the automatic control structure necessary to manage the network from a remote center.
The primary aim of power distribution system control is at minimizing power and energy losses while keeping the node voltages at near rated values against changing loading con-ditions.This control is realized by adjusting the on-load tap changer(OLTC)settings,which are located at substations,and by switching the capacitors,which are located at substations and on network feeders.Recon?guration of the network by switch-ing the tie-switches at branches is another tool for distribution control.Automatic control of power distribution system bases on an optimally con?gured network in which the capacitors are optimally placed and sized at the design stage.During opera-?Tel.:+902124737070x17906;fax:+902124737064.
E-mail address:erkana@https://www.360docs.net/doc/bb16689418.html,.tr.tion,states of the controlling elements are changed continuously by switching operations and total switching operations number of each element for a speci?c time interval should be limited because of their life expectancy constraints.
Therefore,power distribution system control is a constrained, multi-objective optimization problem with integer variables and solution to this problem requires rather new techniques than the conventional approaches,particularly for large systems.Lu and Hsu[1]propose a dynamic programming method for prop-erly dispatching the shunt capacitors and on-load tap changers at the distribution substation based on the forecasted hourly loads.Liang and Cheng[2]improved this method so as to include the capacitors installed on network feeders.But dynamic programming method is inadequate in large systems due to the computational burden involved with it.Ramakrishna and Rao[3]introduce an adaptive neuro-fuzzy inference system for volt/var control,which involves complex calculations for deci-sion process and considerable training times for arti?cial neural networks.
Due to the drawbacks of preceding studies,recent studies used heuristic techniques like genetic algorithms(GAs).Hu et al.
[4]develops a GA based method for minimizing the total energy loss through the24-h time frame.They reduce the search space
0378-7796/$–see front matter?2007Elsevier B.V.All rights reserved. doi:10.1016/j.epsr.2007.05.012
E.Atmaca/Electric Power Systems Research78(2008)694–702695 by dividing the24-h load pattern into a number of load levels
and OLTC settings change only when the load level changes.
But since this method encodes the states of variables through the
entire24-h time frame,it leads to a considerable computational
burden despite the reduced search space.Augugliaro et al.[5]
combines the network recon?guration problem with dispatching
the capacitors and tap changers.Further,this study uni?es the
power loss minimization and voltage pro?le?attening objectives
into a single one by a fuzzy reasoning approach.This uni?cation,
however,introduces an additional computational burden.Mori
and Tani[6]proposes a Parallel Tabu search method for on-
line capacitor control,which uses ordinal optimization(OO)
concepts,however,disregards the voltage regulation problem.
Although these studies work quite well,their ef?ciencies can
be improved by using the OO concepts.Ordinal Optimization
Theory is relatively a new topic,and found limited use in power
system studies.By relaxing the de?nition of optimality and soft-
ening the goal of optimization,ordinal optimization makes the
problem easier as well as the solution process faster.This study
presents an OO based method for volt/var control in power dis-
tribution systems.It aims at minimizing total power losses at
changing loading conditions.It uses two de?nitions for opti-
mality:It identi?es a solution as optimum according to either its
‘performance order’in performances of a feasible set of solu-
tions,or its‘performance value’compared with performance
value of the‘truly optimum’.Although the truly optimum can-
not be identi?ed in advance,we can estimate its performance
value by setting the reactive components of the loads to a small
amount.Following the forecasted daily load pattern,the method
searches for the OLTC settings and capacitor on/off statuses at
each hour that minimize the total power loss at that time inter-
val.The search technique is evolutionary search(ES)based.The
method is proper for on-line control as well.Results obtained
from the tests on a sample system are promising as far as total
computation time and quality of solutions are concerned.
2.Method
2.1.Formulation of the problem
The considered power distribution system is assumed to have
the following properties:
(a)There is an OLTC at each HV/MV distribution substation,
whose tap ranges from?8to+8with voltage range of
variation±10%.
(b)There are shunt capacitor banks installed at substations and
on network feeders.
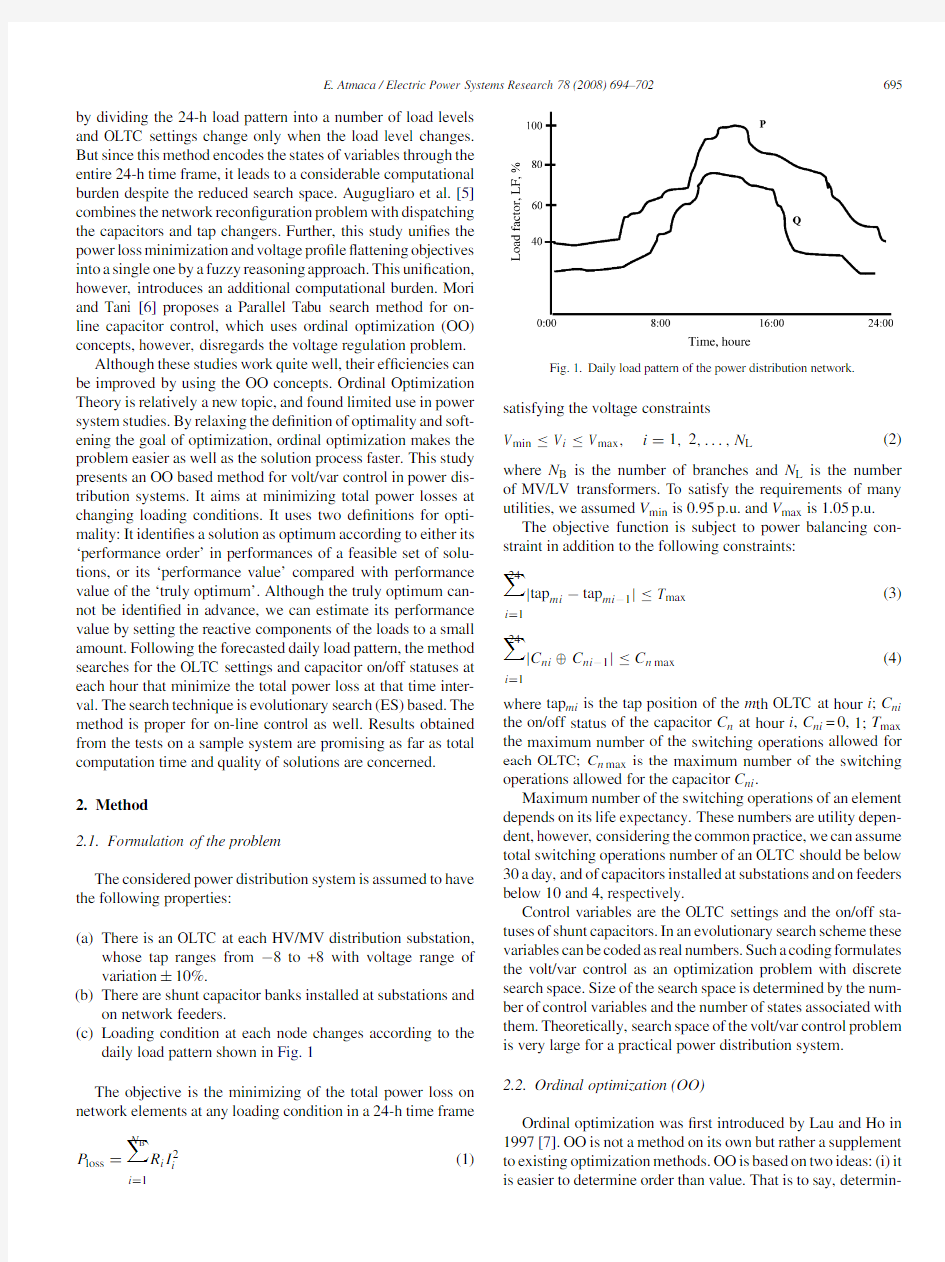
(c)Loading condition at each node changes according to the
daily load pattern shown in Fig.1
The objective is the minimizing of the total power loss on
network elements at any loading condition in a24-h time frame
P loss=N B
i=1
R i I2i
(1)
Fig.1.Daily load pattern of the power distribution network.
satisfying the voltage constraints
V min≤V i≤V max,i=1,2,...,N L(2)
where N B is the number of branches and N L is the number
of MV/LV transformers.To satisfy the requirements of many
utilities,we assumed V min is0.95p.u.and V max is1.05p.u.
The objective function is subject to power balancing con-
straint in addition to the following constraints:
24
i=1
|tap mi?tap mi?1|≤T max(3)
24
i=1
|C ni⊕C ni?1|≤C n max(4)
where tap mi is the tap position of the m th OLTC at hour i;C ni
the on/off status of the capacitor C n at hour i,C ni=0,1;T max
the maximum number of the switching operations allowed for
each OLTC;C n max is the maximum number of the switching
operations allowed for the capacitor C ni.
Maximum number of the switching operations of an element
depends on its life expectancy.These numbers are utility depen-
dent,however,considering the common practice,we can assume
total switching operations number of an OLTC should be below
30a day,and of capacitors installed at substations and on feeders
below10and4,respectively.
Control variables are the OLTC settings and the on/off sta-
tuses of shunt capacitors.In an evolutionary search scheme these
variables can be coded as real numbers.Such a coding formulates
the volt/var control as an optimization problem with discrete
search space.Size of the search space is determined by the num-
ber of control variables and the number of states associated with
them.Theoretically,search space of the volt/var control problem
is very large for a practical power distribution system.
2.2.Ordinal optimization(OO)
Ordinal optimization was?rst introduced by Lau and Ho in
1997[7].OO is not a method on its own but rather a supplement
to existing optimization methods.OO is based on two ideas:(i)it
is easier to determine order than value.That is to say,determin-
696 E.Atmaca/Electric Power Systems Research78(2008)694–702
ing whether A is greater or less than B is easier than determining the values of A and B exactly.(ii)Softening the goal of opti-mization makes the problem easier as well.Instead of asking the‘best for sure’,the‘good enough with high probability’can be proposed.For example,considering a search on the search spaceΘ,we can de?ne the‘good enough’subset,G/Θ,as the top-1%of the space based on objective function values.Consider a‘selected’subset,S/Θ,determined by a sampling procedure. This sampling can be random,or be done by rough calculations and measurements.By requiring high probability for match-ing of these two subsets,we can narrow down the search space fromΘto S.Relaxation of the optimization objective can reduce computation time signi?cantly for a large-scale problem.
Let us de?ne the good enough subset G as the top m-percent of the whole set of the solutions,based on objective function values.Let N S be the total number of solutions in the selected subset S.Then,the probability for at least one of the selected solutions being a member of G is P.Then,
P=1?(1?m)N S(5) Let us de?ne P as the con?dence level of the sampling procedure, and the percentage m as the solution quality.Therefore,from Eq.
(5),we can determine at least how many candidates should be sampled so that they include at least one solution from the best m-percent set with con?dence level P.Having decided for P and m by engineering judgment,the least number of solutions to be sampled is
N S=ln(1?P)
ln(1?m)
(6)
In this way,size of the good enough set is determined beforehand by the operator and it is independent of the problem.But this approach does not tell us how much difference in performance value can be between the solution we found and the truly opti-mum.Therefore,a slightly different‘good enough’de?nition can be made,which measures the performance value of a solu-tion with respect to the performance value of the truly optimum [8].
Consider an optimization problem
min J(θ)
θ∈Θ
(7)
whereΘis the search space,J(θ)is the performance function.Θ={θ1,...,θN}is a?nite discrete set,where N is the size of the search space and J(θi)=J(θj)if i=j.We can de?ne the good enough set as G≡{solution that satis?es a good enough criterion}.Then,it is possible to make two different de?nitions for a good enough subset:
G1≡the top-1%solution(8.a) G2≡{θi|J(θi)≤1.01×J(θopt)}(8.b) whereθopt represents an optimal solution,which minimizes the objective function on the search space.But whether all the solu-tions in G1or G2are desirable is problem dependent.
Consider we know performance values of all the solutions in Θ.By ordering them according to their performance values
we Fig.2.Two categories of the ordered performance curves(OPCs)of an opti-mization problem.
can obtain the ordered performance curve(OPC)of the problem. The shape and characteristics of this curve can fall in one of the categories shown in Fig.2.A?at OPC represents a problem with lots of good solutions,although a steep OPC represents a problem with few good solutions.Therefore,although the good enough criterion G1can produce desirable results for a problem with?at OPC,it may not be satisfactory for a problem with steep OPC,in which the good enough criterion G2is more reliable.
For many optimization problems,performance value of the optimal solution is not known beforehand,unless all the solu-tions are calculated.But use of the good enough criterion G2 requires it to be known.In a properly compensated power dis-tribution system the reactive power?ows through the lines are negligible compared with the active power?ows[9].A proper compensation level can be simulated by setting the reactive com-ponents of the loads to a small amount.To be realistic,we set the reactive loads at5%of their original values.We regulate the system by changing only OLTC settings.We de?ne the perfor-mance value,the total power loss,calculated at these conditions as the reference optimal value for measuring quality of the solu-tions.This value is a reference and underestimates the value of the real optimum.The real optimum cannot be identi?ed unless the computation was completed.This is why the good enough criterion G2deals with the reference optimal value.On the other hand,we use the good enough criterion G1as the lower bound for the quality of the solutions.During the search process at each hour,tap perturbations are performed in the neighborhood of the OLTC settings that found when calculating the reference optimal value of that hour.This procedure is prone to satisfy the bus voltage constraints.Nevertheless,the solutions that provoke intolerable voltages are not rejected but assigned to very large power loss values so that they are subordinated during the search process.
2.3.Solution procedure
The solution procedure is based on an evolutionary search scheme,where only the mutation operator is considered.New
E.Atmaca/Electric Power Systems Research78(2008)694–702697 solutions are created by perturbing the existing solutions but
not by recombination.A similar scheme is used successfully by
Augugliaro et al.[5].
It is reported Tabu Search(TS)outperforms Genetic Algo-
rithm[11].However,TS needs a serious effort to model the
solution strategy.Besides,creating a neighborhood around a
solution can be time consuming for a large-scale problem.On
the other hand,classical GA needs to tune up the cross-over and
mutation operators.A convergence criterion is also needed by
TS and GA.However,generating new solutions in evolution-
ary strategies is simple,and selection of parents is more?exible
compared with classical GA.ES also allows the real-coding of
variables,hence simpli?es the representation of individuals.
In our algorithm,the search at each hour starts with slight
modi?cations on the optimum of previous hour.The load pro?le
changing smoothly allows using such a scheme.However,for a
daily load pro?le changing sharply,the search process demands
more diversi?cation than our algorithm produces,in which some
kind of cross-over can be used to improve the solution quality.
In this application,we used(λ+μ)selection scheme,where
the symbolμstands for the number of parents in one generation,
andλfor the number of created offsprings.At each generation
parents and offspring’s are joined and the bestμindividuals are
selected from this combined set.To exploit the smoothly chang-
ing pattern of the loading conditions,we have chosen the?rst
generation solutions for each loading condition as the same as
the last generation solutions of the previous one.This approach
leads the optimization process to converge fast.
Each solution is coded into an integer string;Z,containing
the information of taps positions of OLTCs,and shunt capacitor
statuses:
Z=Z tap,Z cap(9)
Theoretically,the size of Z tap is the number of OLTCs and the
size of Z cap is the number of capacitors.Size of the search space
depends on the number of control variables and the number of
states associated with each variable.
Limiting the range of variations of the variables reduces the
computational burden.To restrict the range of tap variations
of an OLTC,some studies perform the perturbations around a
forecasted starting tap position that is obtained by the analytical
formula in Eq.(10)[1,5].The formula is based on the active
and reactive power demands from transformer and the desired
voltage at secondary bus.
t=?
?
?
|Z T|2
2
2
1
?
?
Q L+
V21
T
2
+P2L
?
?
?
?
?
1/2
(10.a)
where
k=
|Z C|
|Z C|?|Z T|
,t=1+0.0125×TAP(10.b)
In these equations,TAP is the position of an OLTC,Z C is the impedance of the switched capacitor banks at the substation,V0 and V1the transformers primary and secondary voltages,Z T the transformer impedance,P L and Q L are active and reactive loads of the transformer,and t is the transformer voltage ratio.
In our scheme,determination of the starting tap positions and estimation of the reference optimal values are related to each other.If the reactive power?ows through feeders are neg-ligible compared with active power?ows,the total power loss on feeders and the node voltages are function of only the OLTC positions.To create a pseudo-state of optimal compensation,we set the reactive loads at5%of their original values.Hence,for each loading factor(LF)in the24-h time frame,we determine the starting tap position of the m th OLTC,t m start,h,as the following: t m start,h∴min f(t m,i,h);i=?8,?7,...,7,8(11.a) f(t m,i,h)=1
N L
|1.00?V i,j,h|;Q j=0.05×Q j;
j=1,2,...N L(11.b) where V m,i,h is the tap position of the m th OLTC at hour h; V i,j,h the voltage of the j th node at the tap position i at hour h; N L the number of the load nodes;Q j the original value of the reactive component of the load at the j th node;Q j is the reactive component of the load at the j th node.
To avoid the unnecessary calculations we searched for t m start,h in the neighborhood(±1)of the tap settings found by the formula in Eq.(10).
Namely,the starting tap positions at hour h are those that make the voltage pro?le of the network most?at.We de?ne the reference optimal value, P loss ref,h or performance value of the truly optimum,as the total power loss resulted from the conditions described in Eq.(11).The reference optimal value will be calculated at each hour.This value will serve for de?ning the good enough criterion G2in Eq.(8).
P loss ref,h=
N B
i=1
R i I2i;i=1,2,...N B
∴t m,i,h=t m start,h;Q j=0.05×Q j;j=1,2,...N L
(12) The solution procedure is summarized in the?ow chart in Fig.3. Loading factor(LF)is a number between0.4(the lightest load-ing condition)and1.01(the heaviest loading condition).They are obtained from the load forecasting data of the given day. Updating LF means continuing to the next hour calculations.
Proper sizes for the numbers of population,N pop,and gen-erations,N gen,depend on search space size in an evolutionary search scheme.They are generally determined by engineering judgment.These two parameters result in size of the selected subset:
N S=|S|=N pop×N gen(13) Considering Eqs.(6)and(13)we choose the numbers of gener-ations and population according to desired con?dence level and acceptable solution quality.Hence,the good enough criterion G1results in the proper sizes for N pop and N gen,and the good enough criterion G2serves as the termination criterion of the search process as well as the quality measure for solutions.
698 E.Atmaca/Electric Power Systems Research78(2008)
694–702
Fig.3.Flow chart of the solution procedure.
2.4.Test system
We applied our method to a commonly used115/23kV/kV test system[3,4,10].The network and load data were taken from Ref.[10].To complicate the problem,we repeated the test system four times as shown in Fig.4;hence created a 121-node system with120lines.Line parameters are same but the loads of the nodes1–30,31–60,61–90and91–120 were set to100,90,75and60%,respectively,of their original values.Further,we installed additional units at each capaci-tor bus to enlarge the search space.Since distribution system loads are sensitive to voltage,using only P–Q models for loads can lead to inaccuracies.Accordingly,we modeled half the load at each bus as constant current load and the other half as constant impedance load.We assumed loads change accord-ing to the daily load pro?le shown in Fig.1.Transformers with OLTCs are installed between the node0and nodes1, 31,61and91.We assumed primary voltage of each trans-former is constant and1.00p.u.Totally28groups of capacitors are installed at24nodes.A group consists of three units.A commercial size of300kvars is assumed for each capacitor
unit.
Because we perturb the tap settings(±1)around starting posi-
tions,for any loading condition,there are three possible states
for each OLTC.The state of each group of capacitors can be rep-
resented by a number between0and3;there are four states for
each group.For example,number‘2’means two of the capacitor
units are on and number‘0’none of them.Hence,we sample the
solutions from(34×428)=5.8×10¹⁸possible states for each hour.The evolutionary search parameters used in this sampling
is shown in Table1.
Hence,for a given loading condition,the maximum num-
ber of traversed solutions,N S,is25×10=250.Based on this
selected-subset size,Table2shows how the solution quality
changes with con?dence level according to Eq.(6).
Hence,the set of250random samples includes at least one
solution from the top-1%subset with probability92%.How-
ever,since the search is guided to more promising areas through
evolutions we can expect con?dence levels higher than those in
Table2.
The good enough criterion G2can terminate the search pro-
cess of the current hour without traversing all the250solutions
if the following condition is satis?ed:
P loss,h≤1.01×P loss ref,h(14) where P loss,h is performance value of the best solution in cur-rent population,and P loss ref,h is the reference optimal value for hour h.
The average voltage variation at hour h, V h was de?ned as
the following:
V h=1
N L
|1.00?V j,h|;j=1,2,...,N L(15)
where N L is the total number of load nodes and V j,h is the p.u. value of the j th node voltage at hour h.
3.Results
The program was written in MATLAB and run on a PC with 1.5GHz microprocessor.Many runs result in85s computation time in average for a24-h time frame.This computation time is proper for on-line control operation.
To test the ef?ciency of the good enough criterions G1and G2,and the method overall,we extended the search space and increased the number of samplings for comparison purposes. We set the width of mutation tap to(±2);N pop to20and N gen to50hence traversed1000solutions for a single loading factor without a termination criterion.
Table3compares the limited and extended searches referring to the reference values.In Table3, P loss(%)denotes to total power loss error,where
P loss(%)=
P loss? P loss ref
P loss ref
×100
Table3includes total power losses of the uncontrolled system as well.
E.Atmaca/Electric Power Systems Research78(2008)694–702
699
Fig.4.One-line diagram of the test distribution system.
Table1
Evolutionary search parameters used in this work
Number of generations Parent population,μOffspring population,λWidth of mutation tap Width of mutation capacitor Mutation probability 251010±1±300kvars 1.0
Resulting objective function values of the limited search,with good enough criterions G1and G2,are comparable to those of the extended search.On the other hand,the extended search improves total power loss results slightly at the expense of minor Table2
Solution qualities versus con?dence level with250and1000samples Solution quality(m,%)vs.
con?dence level with250and
1000samples
Con?dence level P(%)
637887929799 2500.400.600.80 1.00 1.40 1.80 10000.100.150.210.250.350.46increases in voltage variations.This is expected due to large variations in tap settings,since the extended search perturbs the OLTC settings(±2)around starting positions.As far as the de?nition in Eq.(15)is concerned for voltage variation,the limited search results in more smooth voltage pro?les than the extended search does at the expense of minor increases in power losses.
Although the good enough criterion G2is not fully satis?ed by the limited search at some hours(1,3,4,5,21,23,24),errors are inconsiderable.Many runs have converged in on an average of10 generations per hour in the24-h frame.On the other hand,solu-tion process continued up to25generations at six loading factors on average.However,at some loading factors such as the?rst
700 E.Atmaca/Electric Power Systems Research78(2008)694–702
Table3
Comparison of actual total power losses with reference values
Hour Unregulated Reference values Extended search Limited search
P loss(kW)P loss ref(kW) V(%)N gen P loss(kW) P loss(%) V(%)N gen P loss(kW) P loss(%) V(%) 1221.5185.00.7450187.0 1.07 1.2425187.0 1.070.83 2256.1213.80.7850215.90.98 1.041215.90.980.78 3346.4289.10.9150291.70.90 1.5325292.1 1.070.94 4466.5389.0 1.0750392.60.93 1.6925393.2 1.07 1.22 5641.9534.7 1.2250539.90.96 1.7625540.4 1.06 1.35 6760.8633.3 1.3350638.40.81 1.3512639.50.98 1.51 7935.2777.6 1.5250783.60.76 1.685785.30.98 1.70 81128.1936.8 1.6450943.80.75 1.771945.30.91 1.69 91423.61180.0 1.82501188.30.71 2.0231190.70.91 1.87 101339.51111.0 1.77501118.90.71 1.8611121.30.93 1.80 111103.0916.1 1.6250923.10.76 1.721925.20.99 1.72 121005.4835.6 1.5650841.70.73 1.943843.40.93 1.70 13912.4758.8 1.4650764.30.73 1.766766.30.99 1.46 141078.1895.6 1.6150902.20.73 2.081904.00.93 1.66 151258.01043.9 1.72501051.50.73 1.8431054.00.97 1.80 161153.5957.8 1.6550964.70.73 1.741966.40.90 1.69 171029.3855.4 1.5850861.90.76 1.731863.10.90 1.65 18720.0599.5 1.2950605.50.99 1.6713605.50.99 1.30 19568.4473.7 1.1650478.00.92 1.717478.30.98 1.18 20499.3416.3 1.1050420.00.89 1.375420.10.93 1.28 21389.3324.80.9750327.70.90 1.2225328.2 1.05 1.08 22306.0255.40.8650257.80.93 1.566258.0 1.00 1.01 23268.1223.80.8050226.00.96 1.0525226.2 1.060.85 24210.6175.90.7250178.0 1.23 1.8025178.0 1.23 1.09 Mean750.9624.3 1.2950629.30.80 1.6310630.30.96 1.38
and last ones,the extended search was lack of satisfying the sec-ond good enough criterion,either.This occurs especially at low loading factors,where underestimation of the truly optimal leads to larger percentage errors.The cross-over operator,inserted at these hours for further improvement,resulted in inconsiderable rise in solution quality despite the increase in total computation time due to the extent of solution diversi?cation it introduced. However,the good enough criterion G2still serves as a quality measure for solutions.
Table4shows the tap positions and capacitor status varia-tions at substations and on feeders through24h.Total switching operations numbers a day satisfy the constraints.These con-straints are on-line,not?nal checks.Total switching operations number of each unit has a certain daily limit beyond which further switching is prohibited.However,since our search at each hour proceeds with slight modi?cations on existing solu-tions of the previous hour we never observed such a violation. Consider that for the system at hand total number of power-?ow runs in the24-h time frame is proportional to the total number of generations.The good enough criterion G2ter-minated the search process for each hour averagely in10 generations.This leads to a considerable saving in computation time compared with the extended search,which is performed without a termination criterion through50generations for each hour.
V oltage pro?le of the node15,which is the lowest volt-age node of the network,is shown through24h in Fig.5.The extended search regulates the voltage of the node15bet-ter than the limited search does,since the former resulted in the average voltage as0.98p.u.through24h while the lat-ter0.97p.u.Despite such a difference for a speci?c node, as far as the overall voltage regulation capability is con-cerned,the limited search slightly outperformed the extended
search.
Fig.5.V oltage pro?le of the node15through24h.(*)Results of the extended search.
702 E.Atmaca/Electric Power Systems Research78(2008)694–702
4.Conclusions
This work deals with power losses minimization of power dis-tribution systems while keeping the node voltages at near rated values.It treats the optimization problem by an evolutionary search scheme supplemented by Ordinal Optimization Theory. Ordinal optimization approach relaxes the de?nition of optimal-ity and makes the optimization problem easier.In this work,two de?nitions of the good enough criterion were used to identify the optimality of a solution.A solution may be optimal in terms of its performance value order among all the solutions on the search space,or in terms of its performance value with respect to that of a truly optimum.The?rst good enough criterion was used to determine the number of solutions to be sampled for at least one of them included by the best m-percent subset with a desired probability.For identifying the optimality of a solution in terms of the second good enough criterion,this work?rst cal-culated a reference optimal value for each loading factor then interpreted it as the estimated performance value of the truly optimum.Results verify validity of this estimation.The method ?nds the OLTC settings and capacitor on/off statuses at each hour by performing perturbations on solutions of the previous hour. This procedure,with the relaxed de?nitions of optimality,pro-duces a fast solution to the power distribution control problem, making the method proper for on-line and off-line operation. Acknowledgement
The author would like to acknowledge the Istanbul University Scienti?c Researches Unit for?nancial support of this research under grant450/27122005.References
[1]F.C.Lu,Y.Y.Hsu,Reactive power/voltage control in a distribution sub-
station using dynamic programming,IEE Proc.Gen.Transm.Distr.142 (1995)639–645.
[2]R.H.Liang,C.K.Cheng,Dispatch of main transformer ULTC and capac-
itors in a distribution system,IEEE Trans.Power Deliv.16(2001)625–630.
[3]G.Ramakrishna,N.D.Rao,Adaptive neuro-fuzzy inference system for
volt/var control in distribution systems,Electr.Power Syst.Res.49(1999) 87–97.
[4]Z.Hu,X.Wang,H.Chen,G.A.Taylor,V olt/var control in distribution
systems using a time-interval based approach,IEE Proc.Gen.Transm.
Distr.150(2003)548–554.
[5]A.Augugliaro,L.Dusonchet,S.Favuzza,E.R.Sanseverino,V oltage reg-
ulation and power losses minimization in automated distribution networks by an evolutionary multiobjective approach,IEEE Trans.Power Syst.19 (2004)1516–1527.
[6]H.Mori,H.Tani,Fast hybrid method of parallel tabu search and ordinal
optimization for on-line capacitor control in distribution systems,in:IEEE Proceeding PES General Meeting,2003,pp.1553–1558.
[7]https://www.360docs.net/doc/bb16689418.html,u,Y.C.Ho,Universal alignment probabilities and subset selection
for ordinal optimization,J.Optimiz.Theory Appl.93(1997)455–489. [8]X.Lin,A discussion on performance value versus performance order,IEEE
Trans.Autom.Control45(2000)2355–2358.
[9]J.J.Grainger,S.Civanlar,et al.,Optimal voltage dependent continous-time
control of reactive power on primary feeders,IEEE Trans.Power Apparatus Syst.103(1984)2714–2723.
[10]S.Civanlar,J.J.Grainger,V olt/var control on distribution systems with
lateral branches using shunt capacitors and voltage regulators.Part III.Numerical results,IEEE Trans.Power Apparatus Syst.104(1985) 3291–3297.
[11]A.Augugliaro,L.Dusonchet,S.Favuzza,E.R.Sanseverino,Genetic,sim-
ulated annealing and Tabu Search algorithms:three heuristic methods for optimal recon?guration and compensation of distribution networks,ETEP Eur.Trans.Electr.Power Eng.9(1999)35–41.