Photocatalytic activity
Chemical Engineering Journal 148(2009)248–253
Contents lists available at ScienceDirect
Chemical Engineering
Journal
j o u r n a l h o m e p a g e :w w w.e l s e v i e r.c o m /l o c a t e /c e
j
Photocatalytic activity and hydroxyl radical formation of carbon-doped TiO 2nanocrystalline:Effect of calcination temperature
Qi Xiao ?,Linli Ouyang
School of Resources Processing and Bioengineering,Central South University,Changsha 410083,China
a r t i c l e i n f o Article history:
Received 21August 2007
Received in revised form 13August 2008Accepted 25August 2008
Keywords:
Carbon-doped TiO 2nanocrystalline Hydroxyl radical
Photocatalytic activity
a b s t r a c t
Carbon-doped TiO 2nanocrystalline was prepared by sol–gel auto-combustion method and characterized by X-ray diffraction,X-ray photoelectron spectra (XPS),Brunauer–Emmett–Teller method (BET),UV–vis
diffuse re?ectance spectroscopy (DRS).The analysis of ?
OH radical formation on the sample surface under visible light irradiation was performed by ?uorescence technique with using terephthalic acid,which
readily reacted with ?
OH radical to produce highly ?uorescent product,2-hydroxyterephthalic acids.It was found that the order of photocatalytic activity per unit surface area was the same as that of the
formation rate of ?OH radicals unit surface area,namely,the greater the formation rate of ?
OH radicals unit surface area was,the higher photocatalytic activity unit surface area was achieved,indicating that the
photocatalytic activity unit surface area was positive correlation to the formation rate of ?
OH radicals unit surface area over the catalysts.In this study,the optimum calcination temperature was 600?C,at which
the highest formation rate of ?
OH radicals per unit surface area was,and thereby the highest photocatalytic activity per unit surface area was achieved.In addition,it could be found that the order of photocatalytic activity correlated very well with the amount of visible light absorption,namely,the stronger the visible light absorption,the higher the photocatalytic activity.
?2008Elsevier B.V.All rights reserved.
1.Introduction
Photocatalytic degradation of various organic and inorganic pollutants using solar energy has been reported [1–3].TiO 2was the most widely used photocatalyst because of its good activity,chemical stability,commercial availability,and inexpensiveness.However,only a small UV fraction of solar light (3–5%)could be utilized because of the wide band gap of TiO 2.Therefore,it was urgent to develop a particular photocatalyst sensitive to sunlight [4].Recently,doping TiO 2with nonmetal elements such as nitrogen [5],carbon [6],sulfur [7],iodine [8]noticeably improved the photo-catalytic activity of TiO 2under visible light.Various synthetic routes have been studied for carbon-doped TiO 2nanoparticles.Khan et al.[6]synthesized chemically modi?ed TiO 2by controlled com-bustion of Ti metal in a natural gas ?ame.Irie et al.[9]prepared carbon-doped anatase TiO 2nanoparticles by oxidative annealing of TiC under O 2?ow at 873K.Sakthivel and Kwasch [10]reported the wet process synthesis of carbon-doped n-TiO 2by hydrolysis of TiCl 4with tetrabutylammonium hydroxide (C 16H 36NOH)fol-
?Corresponding author.Tel.:+867318830543;fax:+867318879815.E-mail address:xiaoqi88@https://www.360docs.net/doc/c45851722.html, (Q.Xiao).lowed by calcinations of the precipitates.Especially,Nagaveni et al.[11,12]reported that the solar photocatalytic degradation rates with combustion-synthesized nano-TiO 2was 20times higher for remazol brill blue R (RBBR),4times higher for methylene blue (MB)and 1.6times higher for orange G (OG),compared to Degussa P-25TiO 2.Their discovery inspired us to further develop combustion synthesis method to prepare carbon-doped TiO 2.
In the present study,we focused on the synthesis of carbon-doped TiO 2nanoparticles using sol–gel auto-combustion technique with a unique combination of the chemical sol–gel process and the combustion process [13].In addition,the excess fuel could be used as carbon source for fuel/oxidizer >1in the reaction system.Therefore,crystallization of TiO 2as well as carbon dop-ing could take place at the same time during the calcinations.The prepared carbon-doped TiO 2nanoparticles were character-ized by X-ray diffraction (XRD),X-ray photoelectron spectra (XPS),Brunauer–Emmett–Teller method (BET),UV–vis diffuse re?ectance spectroscopy (DRS).The aim of this study was to investigate the effect of calcination temperature on both photocatalytic activity
and ?
OH radical’s formation over carbon-doped TiO 2samples under visible light irradiation and correlate the photocatalytic degra-dation of MB with ?
OH radicals formed over carbon-doped TiO 2samples.
1385-8947/$–see front matter ?2008Elsevier B.V.All rights reserved.doi:10.1016/j.cej.2008.08.024
Q.Xiao,L.Ouyang/Chemical Engineering Journal148(2009)248–253249
2.Experimental
2.1.Preparation of carbon-doped TiO2nanocrystalline
Carbon-doped TiO2nanocrystalline was synthesized by sol–gel auto-combustion technique.The detailed process can be described as follows.The analytical grade titanium isopropoxide (Ti(OC2H5)4),C2H6O2(ethylene glycol,abbreviated as EG),C6H8O7 (citric acid,abbreviated as CA),ammonia(25%)and nitride acid (65–68%)were used as raw materials.Appropriate amount of Ti(OC2H5)4was added to CA and EG mixture under constant stirring condition.The molar ratios of CA/Ti,NO3?/CA,and CA/EG were kept constant at2:1,1:3,and1:1,respectively.After adjusting the pH value with ammonia to6–7,the mixture solution was evaporated at90?C to gradually form a clear precursor gel.The precursor gel was baked at150?C in muf?e furnace and expanded, then was auto-ignited at about250?C.The puffy,porous gray pow-ders as-combusted was calcined at the temperature of400–800?C for2h in air,and quenched in air to room temperature.
2.2.Characterization of carbon-doped TiO2nanocrystalline
The crystalline structure of the samples was determined by a D/max-?A diffractometer(Cu K?radiation, =0.154056nm)stud-ies.The averaged grain sizes D were determined from the XRD pattern according to the Scherrer equation D=k /ˇcos?,where k was a constant(shape factor,about0.9), is the X-ray wave-length(0.15418nm),ˇthe full width at half maximum(FWHM) of the diffraction line,and?the diffraction angle.The values ofˇand?of anatase and rutile were taken from anatase(101)and rutile(110)diffraction line,respectively.The amount of rutile in the samples was calculated using the following equation[14]: X R=(1+0.8I A/I R)?1,where X R was rutile weight percent,I A and I R were the integrated diffraction peak intensities from anatase(101) and rutile(110)peak intensity,respectively.
The speci?c surface area of the powders was measured by the dynamic BET method,in which a N2gas was adsorbed at77K using a Micromeritics ASAP2000system.To study the light absorption of the photocatalyst sample,DRS of the photocatalyst sample in the wavelength range of200–800nm were obtained using a UV–vis scanning spectrophotometer(Shimadzu UV-3101),while BaSO4 was as a reference.XPS measurements were performed in a VG Scienti?c ESCALAB Mark II spectrometer equipped with two ultra-high vacuum(UHV)chambers using Al K?radiation(1486.6eV). The XPS binding energies were calibrated with respect to the C1s peak from the carbon tape at284.6eV.
2.3.Determination of?OH radicals
The analysis of?OH radical’s formation on the sample sur-face under visible light irradiation was performed by?uorescence technique with using terephthalic acid,which readily reacted with?OH radicals to produce highly?uorescent product,2-hydroxyterephthalic acid15].The intensity of the peak attributed to2-hydroxyterephtalic acid was known to be proportional to the amount of?OH radicals formed[15].The selected concentration of terephthalic acid solution was5×10?4M in a diluted NaOH aque-ous solution with a concentration of2×10?3M.It has been proved that at these experimental conditions(low concentration of tereph-thalic acid,less than10?3M,room temperature),the hydroxylation reaction of terephthalic acid proceeds mainly by?OH radicals[15].
200mg of the prepared carbon-doped TiO2samples was added to200mL of the5×10?4M terephthalic acid solution in2×10?3M NaOH,and then visible light irradiation of the solution was started. For visible light irradiation,a150-W halogen tungsten lamp with a UV and IR cut-off?lter acted as a visible light source to provide light emission at400–800nm.Sampling was performed in every15min. Solution after?ltration through0.45?m membrane?lter was ana-lyzed on a Hitachi F-4500?uorescence spectrophotometer.The product of terephthalic acid hydroxylation,2-hydroxyterephthalic acid,gave a peak at the wavelength of about425nm by the excita-tion with the wavelength of315nm.
2.4.Photocatalytic activity
In order to evaluate photoactivity of the prepared samples, photocatalytic decomposition of MB was performed.For a typical photocatalytic experiment,200mg of the as-prepared carbon-doped TiO2nanocrystalline was added to200mL of the100-ppm MB aqueous solution.The as-prepared carbon-doped TiO2sam-ples were dispersed under ultrasonic vibration for10min.The suspension was kept in the dark under stirring to measure the adsorption of MB into each sample.After keeping at least20min, MB concentration in the solution was found to be constant on all samples.Therefore,the solution in which the sample powders were dispersed was kept in the dark for30min and then visible light irra-diation of the solution was started.For visible light irradiation,a 150-W halogen tungsten lamp with a UV and IR cut-off?lter acted as a visible light source to provide light emission at400–800nm. The lamp was positioned inside a cylindrical vessel and surrounded by a circulating water jacket to cool it.After recovering the cata-lyst by centrifugation,the light absorption of the clear solution was measured at660nm( max for MB)at a set time.The absorbance of the MB solution was measured with a UV–vis spectrophotometer (Shimadzu UV-3101).
3.Results and discussion
3.1.XRD analysis
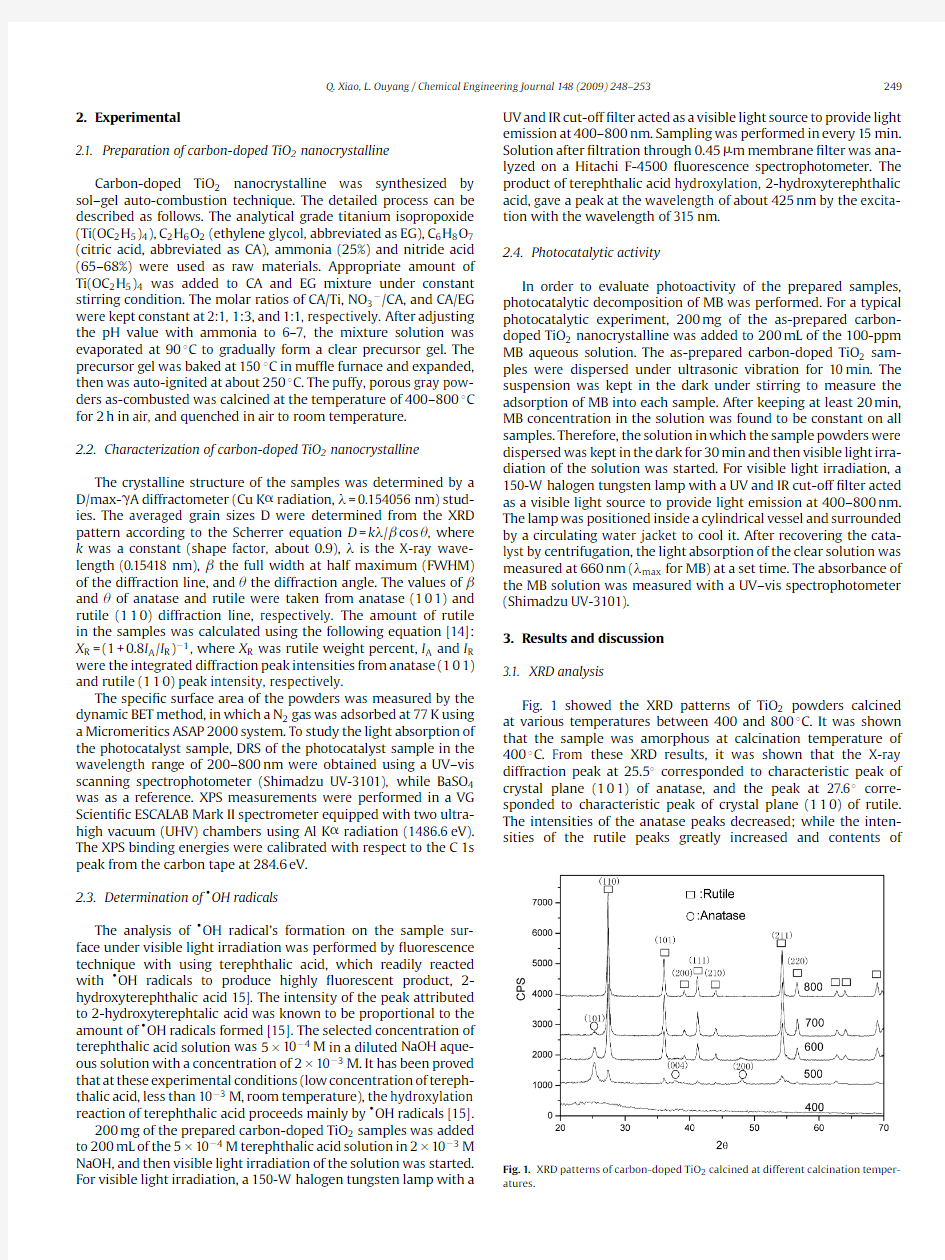
Fig.1showed the XRD patterns of TiO2powders calcined at various temperatures between400and800?C.It was shown that the sample was amorphous at calcination temperature of 400?C.From these XRD results,it was shown that the X-ray diffraction peak at25.5?corresponded to characteristic peak of crystal plane(101)of anatase,and the peak at27.6?corre-sponded to characteristic peak of crystal plane(110)of rutile. The intensities of the anatase peaks decreased;while the inten-sities of the rutile peaks greatly increased and contents
of
Fig.1.XRD patterns of carbon-doped TiO2calcined at different calcination temper-atures.
250Q.Xiao,L.Ouyang /Chemical Engineering Journal 148(2009)248–253
Table 1
The characteristics of carbon-doped TiO 2prepared at various calcinations temperatures Calcinations temperature(?C)
Anatase Rutile Speci?c surface area (m 2/g)
Decolourization of MB at 120min (%)
Crystal size,D (101)(nm)
X A (%)Crystal size,D (110)(nm)X R (%)50013.554.7616.0045.2420.0049.16600–10.7617.7389.2418.852.58700–0.4123.6497.5916.6543.48800
–
24.22
100
15.50
39.16
rutile phase increased as the calcination temperature was raised (shown in Table 1).When calcined at 800?C,the pattern exhib-ited a complete rutile TiO 2structure,indicating that the phase transformation from anatase to rutile has completed at this tem-perature.3.2.XPS studies
According to the XPS survey spectrum (Fig.2A)of carbon-doped TiO 2calcined at 600?C for 2h,the sample contained only Ti,O,and C.And binding energies for Ti 2p 3/2,O 1s,and C 1s were 458.1,529.9and 288.2eV,respectively.
To investigate the carbon states in the photocatalyst,we mea-sured C 1s core levels,as shown in Fig.2B.Deconvolution of the C 1s spectrum (Fig.2B)revealed three components at 284.5,288.0and 290.3eV.The smaller component at a binding energy of 284.5eV could be attributed to C 1s electrons from the carbon tape.Sakthivel and Kwasch [10]observed the two kinds of carbonate species with binding energies of 287.5and 288.5eV.Ohno et al.[16]observed only one kind of carbonate species with binding energies of 288.0eV,and they thought that C 4+ions were incorporated into the bulk phase of TiO 2.Li et al.[17]also observed only one kind of carbonate species with binding energies of 288.2eV.Recently,Ren et al.[18]observed only one kind of carbonate species with bind-ing energies of 288.6eV and revealed that carbon may substitute for some of the lattice titanium atoms and form
a Ti–O–C structure.These results indicated this main C 1s XPS peak (288.0eV)could be assigned to Ti–O–C structure in carbon-doped titania by substi-tuting some of the lattice titanium atoms by carbon in this work.In addition,the smaller component at a binding energy of 290.3eV could be attributed to O C–O components,which was similar to that of Tseng et al.[19].
Fig.2.XPS spectra of (A)survey spectrum,(B)C 1s,(C)Ti 2p,and (D)O 1s for carbon-doped TiO 2calcined at 600?C for 2h.
Q.Xiao,L.Ouyang /Chemical Engineering Journal 148(2009)248–253251
XPS signals of Ti 2p were observed at binding energies at around 458.1eV (Ti 2p 3/2)and 463.9eV (Ti 2p 1/2),as shown in Fig.2C.The typical binding energy of Ti 2p 3/2peak in TiO 2crystals was 458.5–459.7eV [20,21].Typically,the binding energy of Ti 2p 3/2peak for P25powder was https://www.360docs.net/doc/c45851722.html,pared to the binding energy of Ti 4+in pure titania (458.5–459.7eV),there was a red shift of binding energy of Ti 2p 3/2peak for the carbon-doped titania,which suggests that Ti 3+species was formed in the carbon-doped titania [16].This result was in accordance with our preparation condi-tions,in which fuel/oxidizer >1implied fuel-rich condition,and Ti 4+species could be reduced into Ti 3+species.
Deconvolution of the O 1s spectrum was shown in Fig.2D.The BE values of the individual components were 530.0(Ti 4+–O)and 533eV (OH ?),in agreement with previous work [22,23].The BE components at 531.5eV were unambiguously assigned to oxygen bonded to Ti 3+[24].3.3.UV–vis spectra
Fig.3showed the UV–vis diffuse re?ectance spectra of carbon-doped TiO 2nanoparticles calcined at different calcinations temperatures.The absorption edge of the carbon-doped TiO 2sam-ples calcined at 400,500,600,700,and 800?C occurred at 418,422,433,428,and 425nm,respectively,and accordingly the band gap energy was estimated to be about 2.97,2.94,2.86,2.90,and 2.92eV,respectively.This showed that the band gap of the carbon-doped TiO 2samples monotonically became narrower with the increase of calcinations temperatures,and the band gap of carbon-doped TiO 2samples calcined at 873K became the narrowest among all the carbon-doped TiO 2samples.Herein,two reasons might account for high visible light activity of the as-synthesized carbon-doped TiO 2:(1)Ti–O–C structure in carbon-doped titania might be one of the reasons for the visible light photocatalytic activity,which was in accordance with previous results reported by Ren et al.[18].(2)The presence of Ti 3+species produced in the process of carbon dop-ing of the TiO 2led to the formation of oxygen vacancy state in the as-synthesized carbon-doped TiO 2between the valence and the conduction bands in the TiO 2band structure.It was reported that reducing TiO 2introduces localized oxygen vacancy states located at 0.75–1.18eV below the conduction band edge of TiO 2[25].So,for TiO 2containing localized oxygen vacancy,the band gap
between
Fig.3.UV–vis absorption spectra of carbon-doped TiO 2calcined at different calci-nation
temperatures.
Fig.4.Fluorescence spectral changes observed during illumination of carbon-doped TiO 2calcined at 600?C for 2h in 4×10?4M NaOH solution of terephthalic acid (excitation at 315nm).Each ?uorescence spectrum was recorded every 15min of UV illumination.
valence band and localized oxygen vacancy state was 2.45–2.02eV,which corresponded to a wavelength of 506–614nm.Our DRS showed that the carbon-doped TiO 2had an obvious absorption up to 600nm (mainly in the region of 450–600nm)as shown in Fig.3.Therefore,the formation of Ti 3+species in the as-synthesized carbon-doped TiO 2was another reason for the visible light photo-catalytic activity.
3.4.Formation of ?
OH radicals
The ?uorescence emission spectrum (excitation at 315nm)of terephthalic acid solution was measured every 15min during illumination.Fig.4showed the induction of ?uorescence from 5×10?4M terephthalic acid solution in 2×10?3M NaOH.As shown in the ?gures,gradual increase in the ?uorescence intensity at about 425nm was observed with increasing illumination time.Based on the reports in radiation chemistry [26]and sonochem-istry [27–29],it was reasonable to assume that photogenerated
O 2?,HO 2?
and H 2O 2did not interfere with the reaction between ?
OH and terephthalic acid.Moreover,the generated spectrum had the identical shape and maximum wavelength with that of 2-hydroxyterephthalic acid.These results suggested that ?u-orescent products formed during carbon-doped TiO 2were due
to the speci?c reaction between ?
OH radicals and terephthalic acid.
Fig.5showed the plots of increase in ?uorescence intensity against illumination time at 425nm.The ?uorescence intensity by visible light illumination in terephthalic acid solutions increased almost linearly against time.Consequently,we could conclude that ?
OH radicals formed at the carbon-doped TiO 2interface were in proportional to the light illumination time obeying zero-order reac-tion rate kinetics.The formation rate of ?
OH radicals could be expressed by the slop of these lines shown in Fig.5.In Fig.6,the
formation rate of ?
OH radical’s k OH was plotted against calcination
temperature.The formation rate of ?
OH radicals k OH increased with increasing the calcination temperatures and gave a maximum at 600?C,then decreased with increasing calcination temperatures above 600?C.It could be related to the absorption spectra pre-sented in Fig.3,because carbon-doped TiO 2calcined at 600?C showed stronger absorption not only in the 400–500nm but also in the 300–400nm range compared to the other carbon-doped TiO 2samples.
252Q.Xiao,L.Ouyang /Chemical Engineering Journal 148(2009)
248–253
Fig.5.Plots of the induced ?uorescence intensity at 426nm against irradiation time for terephthalic acid on carbon-doped TiO 2calcined at different calcination
temperatures.
Fig.6.The effect of calcination temperatures on formation rate of ?
OH radical’s k OH .
3.5.Photocatalytic activity of carbon-doped TiO 2
Fig.7showed the results of photocatalytic decomposition of MB over carbon-doped TiO 2prepared at various calcination
temper-
Fig.7.Photocatalytic decomposition pro?les of methylene blue over carbon-doped TiO 2nanocrystalline calcined at different calcination
temperatures.
Fig.8.The effect of calcinations temperatures on (a)the photocatalytic activity per
unit surface area and (b)formation rate of ?
OH radicals k OH per unit surface area.
atures.It was found that the photocatalytic activity increased up to the sample calcined at 600?C for 2h with increasing calcina-tion temperatures,and the photocatalytic activity decreased with increasing calcination temperatures above 600?C,which indicated that the optimum calcination temperature was 600?C.
According to Figs.6and 7,it was found that both there existed a optimum calcination temperature 600?C for the photocatalytic
activity and formation rate of ?
OH radicals k OH .However,accord-ing to the BET analysis (shown in Table 1),the increase of calcination temperature reduced the surface area that was 20,18.8,16.65,and 15.50m 2/g at 500,600,700,and 800?C,respectively.The reduction of surface area would lead to the decrease of active sites on which the reactants could adsorb.So,the increase of calcination temper-ature seemed to be not helpful for the photocatalytic activity and
formation rate of ?
OH radical’s k OH .In order to remove the in?uence of the surface-area reduction on the photocatalytic activity and for-mation rate of ?
OH radicals k OH,both the photocatalytic activity per
unit surface area and formation rate of ?
OH radicals k OH per unit surface area were used in Fig.8.It was found that the order of pho-tocatalytic activity per unit surface area was the same as that of the
formation rate of ?
OH radicals unit surface area,namely,the greater
the formation rate of ?
OH radicals unit surface area was,the higher photocatalytic activity unit surface area was achieved,indicating that the photocatalytic activity unit surface area was positive cor-relation to the formation rate of ?
OH radicals unit surface area over the catalysts.During the photocatalytic process,the absorption of photons by the photocatalysts led to the excitation of electrons from the valence band to the conduction band,thus generating electron-hole pairs.Oxygen molecules dissolved in the suspension captured the electron in the conduction band,and the hole in the valence band was captured by H 2O species adsorbed on the surface of the
catalysts,to produce the ?
OH radicals,which subsequently oxidized an adsorbed pollutants.According to Ammar et al.[30],?rstly the ?
OH radical generated through the oxidation of water molecules
adsorbed on TiO 2,and then ?
OH radical oxidized the adsorbed MB
molecules.For that reason,the greater the formation rate of ?
OH radicals was,the higher photocatalytic activity was achieved.4.Conclusion
It was found that the order of photocatalytic activity per unit
surface area was the same as that of the formation rate of ?
OH radicals unit surface area,namely,the greater the formation rate of ?
OH radicals unit surface area was,the higher photocatalytic activity unit surface area was achieved,indicating that the pho-
Q.Xiao,L.Ouyang/Chemical Engineering Journal148(2009)248–253253
tocatalytic activity unit surface area was positive correlation to the formation rate of?OH radicals unit surface area over the cat-alysts.In this study,the optimum calcination temperature was 600?C,at which the highest formation rate of?OH radicals per unit surface area was,and thereby the highest photocatalytic activ-ity per unit surface area was achieved.In addition,it could be found that the order of photocatalytic activity correlated very well with the amount of visible light absorption,namely,the stronger the visible light absorption,the higher the photocatalytic activ-ity.
Acknowledgements
This work was supported by the Provincial Excellent PhD Thesis Research Program of Hunan(No.2004-141)and the Postgraduate Educational Innovation Fund of Central South University(No.2006-48).
References
[1]B.Neppolian,H.C.Choi,S.Sakthivel,B.Arabindoo,V.Murugesan,Chemosphere
46(2002)1173.
[2]S.Sakthivel,B.Neppolian,M.V.Shankar,B.Arabindoo,M.Palanichamy,V.
Murugesan,Sol.Energy Mater.Sol.Cells77(2003)65.
[3]W.S.Kuo,P.H.Ho,Chemosphere45(2001)77.
[4]J.Tang,Z.Zou,J.Ye,Chem.Mater.16(2004)1644.
[5]R.Asashi,T.Morikawa,T.Ohwaki,K.Aoki,Y.Taga,Science293(2001)269.
[6]S.U.M.Khan,M.Al-shahry,W.B.Ingler Jr.,Science297(2002)2243.
[7]T.Umebayashi,T.Yamaki,H.Itoh,K.Asai,Appl.Phys.Lett.81(2002)454.
[8]X.T.Hong,Z.P.Wang,W.M.Cai,F.Lu,J.Zhang,Y.Z.Yang,N.Ma,Y.J.Liu,Chem.
Mater.17(2005)1548.
[9]H.Irie,Y.Watanabe,K.Hashimoto,Chem.Lett.32(2003)772.
[10]S.Sakthivel,H.Kwasch,Angew.Chem.Int.Ed.42(2003)4908.
[11]K.Nagaveni,G.Sivalingam,M.S.Hegde,G.Madras,Appl.Catal.B:Environ.48
(2004)83.
[12]K.Nagaveni,M.S.Hegde,N.RaVishankar,G.N.Subbanna,G.Madras,Langmuir
20(2004)2900.
[13]R.K.Selvan,C.O.Augustin,L.J.Berchmans,R.Saraswathi,Mater.Res.Bull.38
(2003)41.
[14]R.A.Spurr,H.Myers,Anal.Chem.29(1957)760.
[15]K.Ishibashi,A.Fujishima,T.Watanabe,K.Hashimoto,https://www.360docs.net/doc/c45851722.html,mun.
2(2000)207.
[16]T.Ohno,T.Tsubota,M.Toyofuku,R.Inaba,Catal.Lett.98(2004)255.
[17]Y.Li,D.-S.Hwang,N.H.Lee,S.-J.Kim,Chem.Phys.Lett.404(2005)25.
[18]W.Ren,Z.Ai,F.Jia,L.Zhang,X.Fan,Z.Zou,Appl.Catal.B:Environ.69(2007)
138.
[19]Y.-H.Tseng,C.-S.Kuo,C.-H.Huang,Y.-Y.Li,P.-W.Li,C.-L.Cheng,M.-S.Wong,
Nanotechnology17(2006)2490.
[20]M.Yoshitake,A.Thananan,T.Aizawaki,K.Yoshihara,Surf.Interface Anal.34
(2002)698.
[21]Y.L.Wang,Surf.Coat.Technol.150(2002)257.
[22]A.F.Carley,G.Spoto,P.R.Chalker,J.C.Riviere,M.W.Roberts,J.Chem.Soc.,Faraday
Trans.I83(1987)351.
[23]J.Pouilleau,D.Devilliers,H.Groult,P.Marcus,J.Mater.Sci.32(1998)5645.
[24]P.Madhu Kumar,S.Badrinarayanan,M.Sastry,Thin Solid Films358(2000)122.
[25]N.Isao,N.Nobuaki,K.Shuzo,I.Tatsuhiko,S.Shinichi,T.Koji,J.Mol.Catal.A:
Chem.161(2000)205.
[26]H.M.Khan,M.Anwar,G.Ahmad,J.Radioanal.Nucl.Chem.Lett.200(1995)521.
[27]T.J.Mason,J.P.Lorimer,D.M.Bates,Y.Zhao,Ultrasonics Sonochem.1(1994)S91.
[28]X.Fang,M.Gertraud,C.von Sonntag,Ultrasonics Sonochem.3(1996)57.
[29]J.C.Barreto,G.S.Smith,N.H.P.Strobel,P.A.McQuillin,https://www.360docs.net/doc/c45851722.html,ler,Life Sci.56
(1994)L89.
[30]H.Ammar,L.Hinda,K.Mohamed,E.Elimame,G.Chantal,H.Jean-Marie,Appl.
Catal.B:Environ.31(2001)145.