microRNA expression profiles classify human cancers
MicroRNA expression pro?les classify human cancers
Jun Lu 1,4*,Gad Getz 1*,Eric A.Miska 2*?,Ezequiel Alvarez-Saavedra 2,Justin Lamb 1,David Peck 1,
Alejandro Sweet-Cordero 3,4,Benjamin L.Ebert 1,4,Raymond H.Mak 1,4,Adolfo A.Ferrando 4,James R.Downing 5,Tyler Jacks 2,3,H.Robert Horvitz 2&Todd R.Golub 1,4,6
Recent work has revealed the existence of a class of small non-coding RNA species,known as microRNAs (miRNAs),which have critical functions across various biological processes 1,2.Here we use a new,bead-based ?ow cytometric miRNA expression pro?ling method to present a systematic expression analysis of 217mammalian miRNAs from 334samples,including multiple human cancers.The miRNA pro?les are surprisingly informative,re?ecting the developmental lineage and differentiation state of the tumours.We observe a general downregulation of miRNAs in tumours compared with normal tissues.Furthermore,we were able to successfully classify poorly differentiated tumours using miRNA expression pro?les,whereas messenger RNA pro?les were highly inaccurate when applied to the same samples.These ?ndings highlight the potential of miRNA pro?ling in cancer diagnosis.
Much progress has been made over the last decade in developing a molecular taxonomy of cancer (see ref.3).In particular,it has become clear that among the ,22,000protein-coding transcripts are mRNAs that can be used to classify a wide variety of human cancers 4.Recently,hundreds of small,non-coding miRNAs have been discovered (see ref.1).The ?rst identi?ed miRNAs,the products of the C.elegans genes lin-4and let-7,have important roles in controlling developmental timing and probably act by regulating mRNA translation 5–7.When lin-4or let-7is inactivated,speci?c epithelial cells undergo additional cell divisions instead of their normal differentiation.Because abnormal cell proliferation is a hallmark of human cancers,it seems possible that miRNA expression patterns might denote the malignant state.Indeed,altered expression of a few miRNAs has been found in some tumour types 8–11.However,the potential for miRNA expression to inform cancer diagnosis has not been systematically explored.
To determine the expression pattern of all known miRNAs,we ?rst needed to develop an accurate and inexpensive pro?ling method.This goal is challenging,because of the short size of miRNAs (about 21nucleotides)and the sequence similarity between miRNA family members.Glass-slide microarrays have been used for miRNA pro?ling 12–18,but cross-hybridization of related miRNAs has been problematic.We therefore developed a bead-based pro?ling method.Oligonucleotide-capture probes complementary to miRNAs of interest were coupled to carboxylated 5-micron poly-styrene beads impregnated with variable mixtures of two ?uorescent dyes (that can yield up to 100colours),each representing a single miRNA.Following adaptor ligations which use both the
50-phosphate and the 30-hydroxyl groups of miRNAs 13,reverse-transcribed miRNAs were (1)ampli?ed by polymerase chain reac-tion (PCR)using a common biotinylated primer,(2)hybridized to the capture beads,and (3)stained with streptavidin-phycoerythrin.The beads were then analysed using a ?ow cytometer capable of measuring bead colour (denoting miRNA identity)and phycoery-thrin intensity (denoting miRNA abundance)(see Supplementary Fig.1).
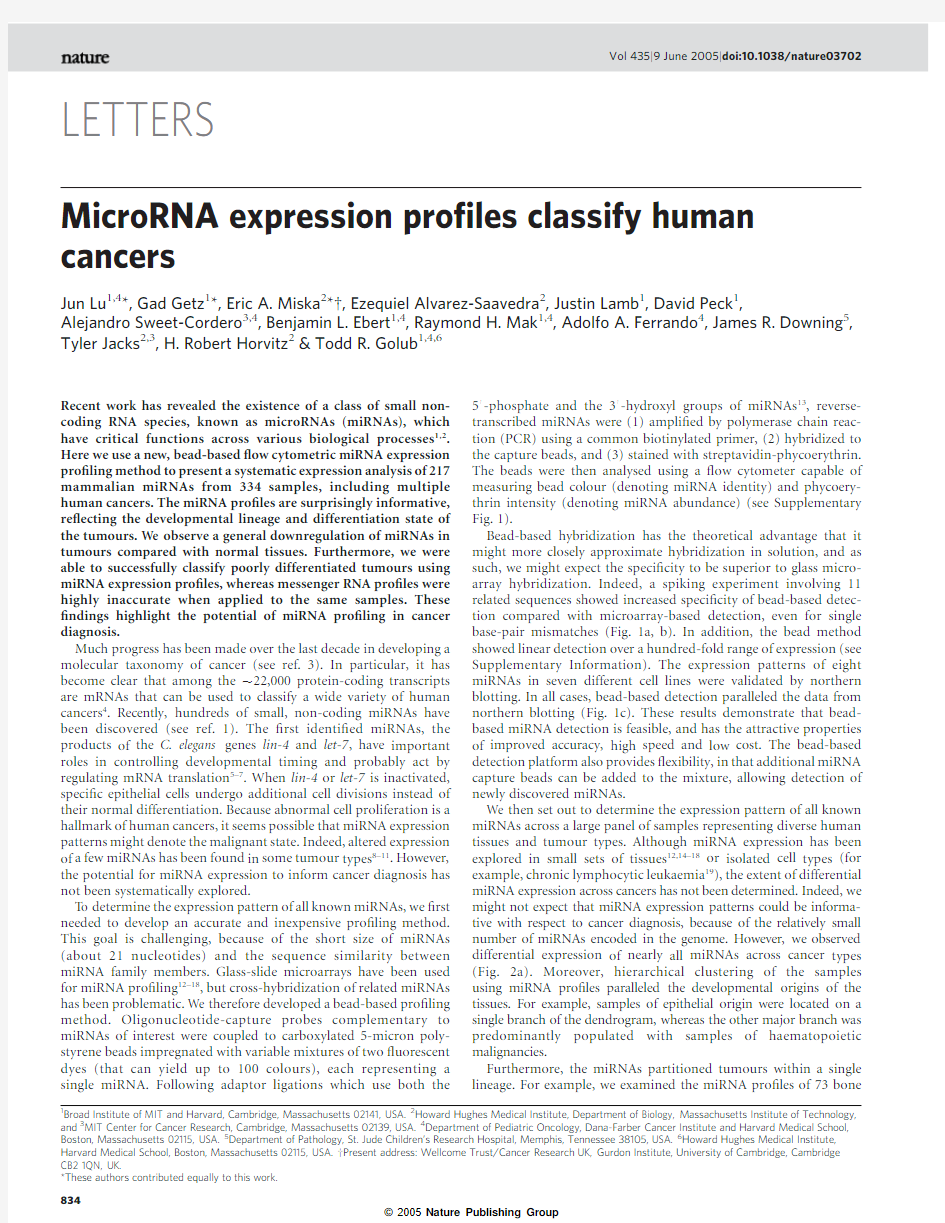
Bead-based hybridization has the theoretical advantage that it might more closely approximate hybridization in solution,and as such,we might expect the speci?city to be superior to glass micro-array hybridization.Indeed,a spiking experiment involving 11related sequences showed increased speci?city of bead-based detec-tion compared with microarray-based detection,even for single base-pair mismatches (Fig.1a,b).In addition,the bead method showed linear detection over a hundred-fold range of expression (see Supplementary Information).The expression patterns of eight miRNAs in seven different cell lines were validated by northern blotting.In all cases,bead-based detection paralleled the data from northern blotting (Fig.1c).These results demonstrate that bead-based miRNA detection is feasible,and has the attractive properties of improved accuracy,high speed and low cost.The bead-based detection platform also provides ?exibility,in that additional miRNA capture beads can be added to the mixture,allowing detection of newly discovered miRNAs.
We then set out to determine the expression pattern of all known miRNAs across a large panel of samples representing diverse human tissues and tumour types.Although miRNA expression has been explored in small sets of tissues 12,14–18or isolated cell types (for example,chronic lymphocytic leukaemia 19),the extent of differential miRNA expression across cancers has not been determined.Indeed,we might not expect that miRNA expression patterns could be informa-tive with respect to cancer diagnosis,because of the relatively small number of miRNAs encoded in the genome.However,we observed differential expression of nearly all miRNAs across cancer types (Fig.2a).Moreover,hierarchical clustering of the samples using miRNA pro?les paralleled the developmental origins of the tissues.For example,samples of epithelial origin were located on a single branch of the dendrogram,whereas the other major branch was predominantly populated with samples of haematopoietic malignancies.
Furthermore,the miRNAs partitioned tumours within a single lineage.For example,we examined the miRNA pro?les of 73bone
LETTERS
1
Broad Institute of MIT and Harvard,Cambridge,Massachusetts 02141,USA.2Howard Hughes Medical Institute,Department of Biology,Massachusetts Institute of Technology,and 3MIT Center for Cancer Research,Cambridge,Massachusetts 02139,USA.4Department of Pediatric Oncology,Dana-Farber Cancer Institute and Harvard Medical School,Boston,Massachusetts 02115,USA.5Department of Pathology,St.Jude Children’s Research Hospital,Memphis,Tennessee 38105,USA.6Howard Hughes Medical Institute,Harvard Medical School,Boston,Massachusetts 02115,USA.?Present address:Wellcome Trust/Cancer Research UK,Gurdon Institute,University of Cambridge,Cambridge CB21QN,UK.
*These authors contributed equally to this
work.
marrow samples obtained from patients with acute lymphoblastic leukaemia(ALL).As shown in Fig.2b,hierarchical clustering revealed non-random partitioning of the samples into three major branches:one containing all?ve t(9;22)BCR/ABL-positive samples and10out of11t(12;21)TEL/AML1samples;a second branch containing15out of19T-cell ALL samples;and a third branch containing all but one of the samples with an MLL gene rearrange-ment.These experiments demonstrate that even within a single developmental lineage,distinct patterns of miRNA expression can be observed that re?ect mechanisms of transformation,and further support the idea that miRNA expression patterns encode the developmental history of human cancers.
Among the epithelial samples,those of the gastrointestinal tract were of particular interest.Samples from colon,liver,pancreas and stomach all clustered together(Fig.2a),re?ecting their common derivation from tissues of embryonic endoderm.We suggest that sample clustering in miRNA space is predominantly driven by developmental history.In contrast,when the same samples were pro?led in the space of,16,000mRNAs,the coherence of gut-derived samples was not observed in hierarchical clustering(Fig.2c). This observation might result from the large amount of noise and unrelated signals that are embedded in the high-dimensional mRNA data.Whether or not the miRNAs that are highly expressed in the gut-associated cluster(miR-192,miR-194and miR-215)have a functional role in the speci?cation of gut development or gut-derived tumours remains to be investigated.
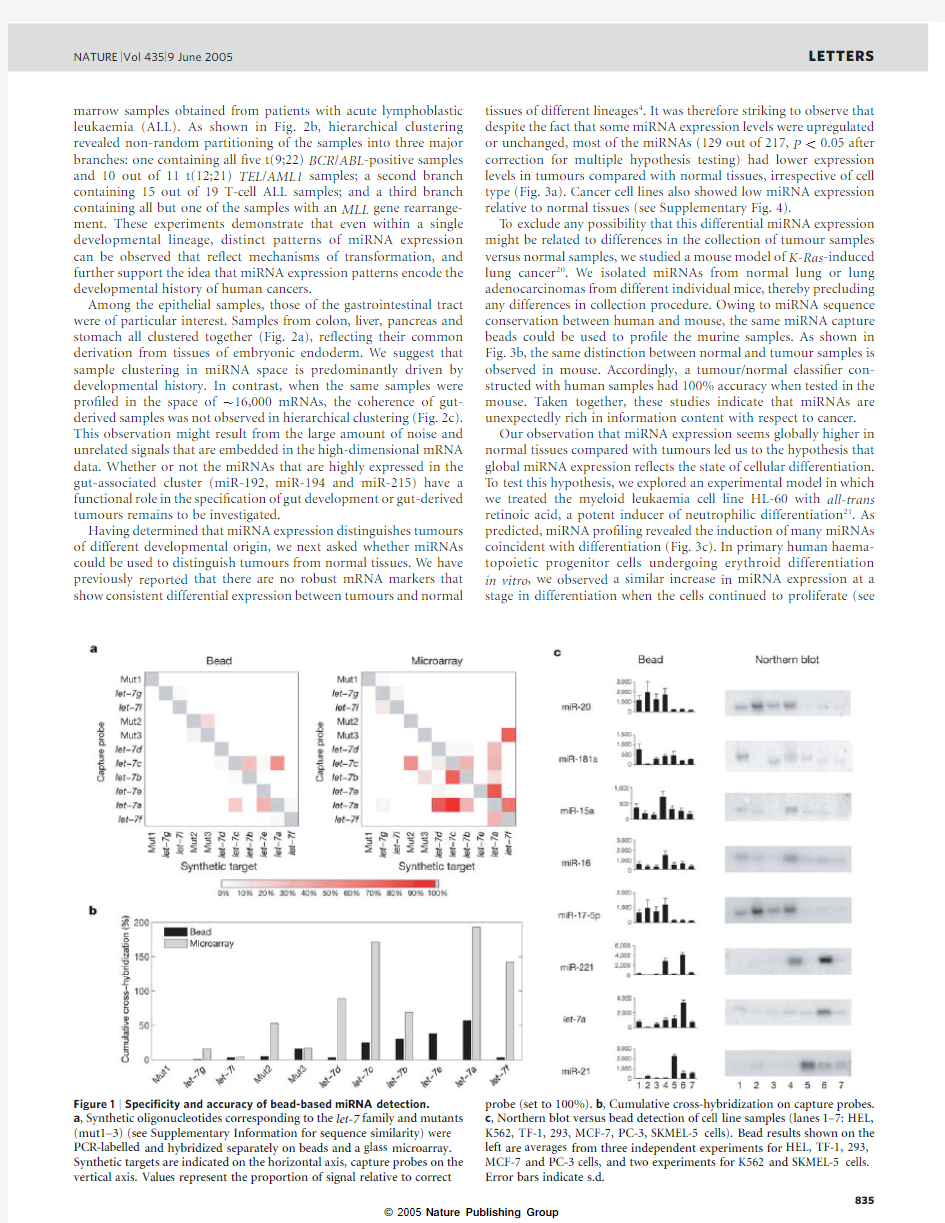
Having determined that miRNA expression distinguishes tumours of different developmental origin,we next asked whether miRNAs could be used to distinguish tumours from normal tissues.We have previously reported that there are no robust mRNA markers that show consistent differential expression between tumours and normal tissues of different lineages4.It was therefore striking to observe that despite the fact that some miRNA expression levels were upregulated or unchanged,most of the miRNAs(129out of217,P,0.05after correction for multiple hypothesis testing)had lower expression levels in tumours compared with normal tissues,irrespective of cell type(Fig.3a).Cancer cell lines also showed low miRNA expression relative to normal tissues(see Supplementary Fig.4).
To exclude any possibility that this differential miRNA expression might be related to differences in the collection of tumour samples versus normal samples,we studied a mouse model of K-Ras-induced lung cancer20.We isolated miRNAs from normal lung or lung adenocarcinomas from different individual mice,thereby precluding any differences in collection procedure.Owing to miRNA sequence conservation between human and mouse,the same miRNA capture beads could be used to pro?le the murine samples.As shown in Fig.3b,the same distinction between normal and tumour samples is observed in mouse.Accordingly,a tumour/normal classi?er con-structed with human samples had100%accuracy when tested in the mouse.Taken together,these studies indicate that miRNAs are unexpectedly rich in information content with respect to cancer. Our observation that miRNA expression seems globally higher in normal tissues compared with tumours led us to the hypothesis that global miRNA expression re?ects the state of cellular differentiation. To test this hypothesis,we explored an experimental model in which we treated the myeloid leukaemia cell line HL-60with all-trans retinoic acid,a potent inducer of neutrophilic differentiation21.As predicted,miRNA pro?ling revealed the induction of many miRNAs coincident with differentiation(Fig.3c).In primary human haema-topoietic progenitor cells undergoing erythroid differentiation in vitro,we observed a similar increase in miRNA expression at a stage in differentiation when the cells continued to proliferate (see
Figure1|Speci?city and accuracy of bead-based miRNA detection.
a,Synthetic oligonucleotides corresponding to the let-7family and mutants (mut1–3)(see Supplementary Information for sequence similarity)were PCR-labelled and hybridized separately on beads and a glass microarray. Synthetic targets are indicated on the horizontal axis,capture probes on the vertical axis.Values represent the proportion of signal relative to correct probe(set to100%).b,Cumulative cross-hybridization on capture probes. c,Northern blot versus bead detection of cell line samples(lanes1–7:HEL, K562,TF-1,293,MCF-7,PC-3,SKMEL-5cells).Bead results shown on the left are averages from three independent experiments for HEL,TF-1,293, MCF-7and PC-3cells,and two experiments for K562and SKMEL-5cells. Error bars indicate s.d.
NATURE|Vol435|9June2005LETTERS
Supplementary Information).These experiments support the hypothesis that global changes in miRNA expression are associated with differentiation,the abrogation of which is a hallmark of all human cancers.These ?ndings are also consistent with the recent observation that mouse embryonic stem cells lacking Dicer,an enzyme required for miRNA maturation,fail to differentiate normally 22.
We next turned to a more challenging diagnostic distinction:that of tumours of histologically uncertain cellular origin.It is estimated that 2–4%of all cancer diagnoses represent cancers of unknown origin or diagnostic uncertainty (see ref.23).To address this,we analysed 17poorly differentiated tumours,the histological appear-ance of which was non-diagnostic,but for which clinical diagnosis was established by anatomical context,either directly (for example,a primary tumour arising in the colon)or indirectly (a metastasis of a previously identi?ed primary tumour).A training set of 68more-differentiated tumours,representing 11tumour types and for which both mRNA and miRNA pro?les were available,was used to generate a classi?er.This classi?er was then used without modi?cation to classify the 17poorly differentiated test samples.As a group,poorly differentiated tumours had lower global levels of miRNA expression compared with the more-differentiated training
set
Figure 2|Hierarchical clustering of miRNA expression.a ,miRNA pro?les of 218samples from several different tissues were clustered (average linkage,correlation similarity).Samples are in columns,miRNAs in rows.Samples of epithelial (EP)origin or derived from the gastrointestinal tract (GI)are indicated.More detail is shown in Supplementary Fig.4.b ,Clustering of 73bone marrow samples from patients with acute lymphoblastic leukaemia (ALL).Coloured bars indicate the different ALL subtypes.c ,Comparison of miRNA data and mRNA data.For 89epithelial samples from a that had mRNA expression data,hierarchical clustering was performed.Samples of GI origin are shown in blue.GI-derived samples largely cluster together in miRNA expression space,but not in mRNA expression space.Abbreviations used:Bldr,bladder;Brst,breast;Fcc,follicular lymphoma;Kid,kidney;Lvr,liver;Mela,melanoma;Meso,mesothelioma;Pan,pancreas;Prost,prostate;Stom:stomach;Ut,uterus;AML:acute myelogenous leukaemia;BALL,B-cell ALL;LBL,diffuse large-B cell lymphoma;MF,mycosis fungoides;MLL,mixed lineage leukaemia;TALL,T-cell ALL;Hyper 47–50,
hyperdiploid with 47–50chromosomes;Hyper .50,hyperdiploid with over 50chromosomes;Normp,normal ploidy.Further details can be found in Supplementary Information.
LETTERS
NATURE |Vol 435|9June 2005
samples (see Supplementary Fig.5),consistent with the notion that miRNA expression is closely linked to differentiation.Despite the overall low level of miRNA expression,the miRNA-based classi?er established the correct diagnosis of the poorly differentiated samples with far greater accuracy than would be expected by chance for an 11-class classi?er (12out of 17correct;P ,5£10211).In contrast,the mRNA-based classi?er was highly inaccurate (1out of 17correct;P ?0.47),as we previously reported 4.
The experiments reported here demonstrate the feasibility and utility of monitoring the expression of miRNAs in human cancer.Our unexpected ?ndings are the extraordinary level of diversity in miRNA expression across cancers,and the large amount of diag-nostic information encoded in a relatively small number of miRNAs.The implication is that,unlike with mRNA expression,a modest number of miRNAs (,200in total)might be suf?cient to classify human cancers.Moreover,the bead-based miRNA detection method has the attractive property of being not only accurate and speci?c,but also easy to implement in a routine clinical setting.In addition,unlike mRNAs,miRNAs remain largely intact in routinely collected,formalin-?xed,paraf?n-embedded clinical tissues 15.More work is required to establish the clinical utility of miRNA expression in cancer diagnosis,but the work described here indicates that miRNA pro?ling has unexpected diagnostic potential.The mechanism by which miRNAs are under-expressed in cancer remains unknown.We did not observe substantial decreases in the mRNAs encoding components of the miRNA processing machinery (Dicer,Drosha,Argonaute2or DGCR8(ref.24);see Supplementary Information),but clearly other mechanisms of miRNA regulation are possible.The ?ndings reported here are consistent with the hypothesis that in mammals,as in C.elegans ,miRNAs can function to prevent cell division and drive terminal differentiation.An implication of this hypothesis is that downregulation of some miRNAs might play a causal role in the generation or maintenance of tumours.Epithelial cells affected in C.elegans lin-4and let-7miRNA mutants generate a stem-cell-like lineage,dividing to produce daughters that,like themselves,divide rather than differentiate 5,7.We speculate that abnormalities in miRNA expression might similarly contribute to the generation or maintenance of ‘cancer stem cells’,recently proposed to be responsible for cancerous growth in both leukaemias and solid tumours 25–28.
METHODS
https://www.360docs.net/doc/c28547947.html,rmation regarding samples is available in Supplementary Table 2.Total RNAs were prepared from tissues or cell lines using TRIzol (Invitrogen),as described 4,and in compliance with IRB protocols.Leukaemia bone marrow mononuclear cells were collected from patients treated at St.Jude Children’s Research Hospital and at the Dana-Farber Cancer Institute,and their immuno-phenotype and genotype were determined as previously described 29,30.Normal mouse lung and mouse lung cancer samples were collected from K-Ras LA1mice and genotyped as described 20.Lungs from four-to ?ve-month-old mice were in?ated with phosphate-buffered saline before removal.Individual lung tumours and normal lungs were dissected and immediately frozen on dry ice before RNA preparation.HL-60cells were plated at 1.5£105cells ml 21and induced to differentiate using 1m M all-trans retinoic acid (Sigma;in ethanol).Cells were harvested after 1,3and 5days.Culturing conditions for other cells are detailed in the Supplementary Information.
miRNA labelling.Target preparation from total RNA followed the described procedure 13,with modi?cations.Brie?y,two synthetic pre-labelling-control RNA oligonucleotides (50-pCAGUCAGUCAGUCAGUCAGUCAG-30,and 50-pGACCUCCAUGUAAACGUACAA-30,Dharmacon)were used to control for target preparation ef?ciency.They were each spiked at 3fmoles per m g total RNA.Small RNAs (18–26nucleotides)were recovered from 1–10m g total RNA through denaturing polyacrylamide gel puri?cation.Small RNAs were adaptor-ligated sequentially on the 30-end and 50-end using T4RNA ligase (Amersham Biosciences).After reverse-transcription using adaptor-speci?c primers,products were PCR-ampli?ed (958C for 40s;508C for 30s;728C for 30s;18cycles for 10m g starting total RNA)using a 30-primer 50-TACTGG AATTCGCGGTTA-30and 50primer 50-biotin-CAACGGAATTCCTCACTAAA-30(IDT).For side-by-side comparison of bead detection and the glass micro-array,a 50-Alexa-532-modi?ed primer was used for compatibility with the glass microarray.PCR products were precipitated and dissolved in 66m l TE buffer (10mM TrisHCl pH 8.0,1mM EDTA)containing two biotinylated post-labelling-control oligonucleotides (100fmoles of FVR506,25fmoles PTG20210;see Supplementary Table 1).
Bead-based detection.miRNA capture probes were 50-amino-modi?ed oligo-nucleotides with a 6-carbon linker (IDT).Capture probes for miRNAs and controls were divided into three sets (see Supplementary Table 1).T o pro?le a sample with all probes,three assays were performed on the sample,each using one of the three probe sets.Probes were conjugated to carboxylated xMAP beads (Luminex Corporation)in 96-well plates,following the manufacturer’s protocol.For each probe set,3m l of every probe–bead conjugate was mixed into 1ml of 1.5£TMAC (4.5M tetramethylammonium chloride,0.15%sarkosyl,75mM Tris-HCl pH 8.0,6mM EDTA).Samples were hybridized in a 96-well plate,with two mock PCR samples (using water as template)in each plate as a background control.Hybridization was carried out overnight at 508C with 33m l of the
bead
Figure 3|Comparison between normal and tumour samples reveals global changes in miRNA expression.a ,Markers were selected to correlate with the normal versus tumour distinction.A heatmap of miRNA expression is shown,with miRNAs sorted according to the variance-thresholded t -test score.b ,miRNA markers of normal versus tumour distinction in human tissues from a ,applied to normal lungs and lung adenocarcinomas of K-Ras LA1mice.A k -nearest neighbour (k NN)classi?er based on human
sample-derived markers yielded a perfect classi?cation of the mouse samples (euclidean distance,k ?3).Mouse tumour T_MLUNG_5(third column from right)was occasionally classi?ed as normal using other k NN
parameters (see Supplementary Information).c ,HL-60cells were treated with all-trans retinoic acid (ATRA t)or vehicle (2)for the indicated number of days.A heatmap of miRNA expression from a representative experiment is shown.
NATURE |Vol 435|9June 2005
LETTERS
mixture and15m l of labelled material.Beads were spun down,resuspended in 1£TMAC containing10m g ml21streptavidin-phycoerythrin(Molecular Probes)and incubated at508C for10min before data acquisition on a Luminex 100IS machine.Median?uorescence intensity values were measured. Computational analyses.Pro?ling data were?rst scaled according to the post-labelling-controls and then the pre-labelling-controls,in order to normalize readings from different probe/bead sets for the same sample,and to normalize for the labelling ef?ciency,respectively,as detailed in Supplementary Methods. Data were thresholded at32and log2-transformed.Hierarchical clustering was performed with average linkage and Pearson correlation.Before clustering,data were?ltered to eliminate genes with expression lower than7.25(on a log2scale) in all samples.Next,all features were centred and normalized to a mean of0and a standard deviation of1.k-nearest-neighbour classi?cation of normal versus tumour samples was performed with k?3in the selected feature space using euclidean distance measure.Note that different metrics were used for clustering and normal/tumour classi?cation.Features were selected for the distinction between all normal samples versus all tumours(for colon,kidney,prostate, uterus,lung and breast;P,0.05after Bonferroni correction).P values were calculated using a variance-thresholded t-test with a minimal standard deviation of0.75,while treating the tissue type as a confounding variable.Multi-class predictions of poorly differentiated tumours were performed using the prob-abilistic neural network algorithm,a gaussian-weighted nearest neighbour method.For each test sample,the tissue type that had the highest probability in multiple one-tissue-versus-the-rest predictions was assigned.Feature number and the gaussian width were optimized on the basis of leave-one-out cross-validations on the training data set.Features were selected on the basis of the variance-thresholded t-test score,requiring equal numbers of up-and down-regulated features.Distances were based on the cosine in the selected feature space.
Expression data.miRNA expression data have been submitted to the Gene Expression Omnibus(GEO;https://www.360docs.net/doc/c28547947.html,/geo)with the series accession number GSE2564.mRNA expression data were published previously4,and are available together with miRNA expression data at http:// https://www.360docs.net/doc/c28547947.html,/cancer/pub/miGCM.
Received2February;accepted5May2005.
1.Bartel,D.P.MicroRNAs:genomics,biogenesis,mechanism,and function.Cell
116,281–-297(2004).
2.Ambros,V.The functions of animal microRNAs.Nature431,350–-355(2004).
3.Chung,C.H.,Bernard,P.S.&Perou,C.M.Molecular portraits and the family
tree of cancer.Nature Genet.32,533–-540(2002).
4.Ramaswamy,S.et al.Multiclass cancer diagnosis using tumor gene expression
signatures.Proc.Natl https://www.360docs.net/doc/c28547947.html,A98,15149–-15154(2001).
5.Ambros,V.&Horvitz,H.R.Heterochronic mutants of the nematode
Caenorhabditis elegans.Science226,409–-416(1984).
6.Lee,R.C.,Feinbaum,R.L.&Ambros,V.The C.elegans heterochronic gene lin-
4encodes small RNAs with antisense complementarity to lin-14.Cell75,
843–-854(1993).
7.Reinhart,B.J.et al.The21-nucleotide let-7RNA regulates developmental
timing in Caenorhabditis elegans.Nature403,901–-906(2000).
8.Michael,M.Z.,O’Connor,S.M.,van Holst Pellekaan,N.G.,Young,G.P.&
James,R.J.Reduced accumulation of speci?c microRNAs in colorectal
neoplasia.Mol.Cancer Res.1,882–-891(2003).
9.Calin,G.A.et al.Frequent deletions and down-regulation of micro-RNA genes
miR15and miR16at13q14in chronic lymphocytic leukemia.Proc.Natl Acad.Sci.
USA99,15524–-15529(2002).
10.Eis,P.S.et al.Accumulation of miR-155and BIC RNA in human B cell
lymphomas.Proc.Natl https://www.360docs.net/doc/c28547947.html,A102,3627–-3632(2005).
11.Johnson,S.M.et al.RAS is regulated by the let-7microRNA family.Cell120,
635–-647(2005).12.Liu,C.G.et al.An oligonucleotide microchip for genome-wide microRNA
pro?ling in human and mouse tissues.Proc.Natl https://www.360docs.net/doc/c28547947.html,A101,
9740–-9744(2004).
13.Miska,E.A.et al.Microarray analysis of microRNA expression in the
developing mammalian brain.Genome Biol.5,R68(2004).
14.Thomson,J.M.,Parker,J.,Perou,C.M.&Hammond,S.M.A custom
microarray platform for analysis of microRNA gene expression.Nature Methods 1,47–-53(2004).
15.Nelson,P.T.et al.Microarray-based,high-throughput gene expression pro?ling
of microRNAs.Nature Methods1,155–-161(2004).
16.Babak,T.,Zhang,W.,Morris,Q.,Blencowe,B.J.&Hughes,T.R.Probing
microRNAs with microarrays:tissue speci?city and functional inference.RNA 10,1813–-1819(2004).
17.Sun,Y.et al.Development of a micro-array to detect human and mouse
microRNAs and characterization of expression in human organs.Nucleic Acids Res.32,e188(2004).
18.Barad,O.et al.MicroRNA expression detected by oligonucleotide microarrays:
system establishment and expression pro?ling in human tissues.Genome Res.
14,2486–-2494(2004).
19.Calin,G.A.et al.MicroRNA pro?ling reveals distinct signatures in B cell
chronic lymphocytic leukemias.Proc.Natl https://www.360docs.net/doc/c28547947.html,A101,11755–-11760
(2004).
20.Johnson,L.et al.Somatic activation of the K-ras oncogene causes early onset
lung cancer in mice.Nature410,1111–-1116(2001).
21.Stegmaier,K.et al.Gene expression-based high-throughput screening
(GE-HTS)and application to leukemia differentiation.Nature Genet.36,
257–-263(2004).
22.Kanellopoulou,C.et al.Dicer-de?cient mouse embryonic stem cells are
defective in differentiation and centromeric silencing.Genes Dev.19,489–-501 (2005).
23.Pavlidis,N.,Briasoulis,E.,Hainsworth,J.&Greco,F.A.Diagnostic and
therapeutic management of cancer of an unknown primary.Eur.J.Cancer39, 1990–-2005(2003).
24.Cullen,B.R.Transcription and processing of human microRNA precursors.Mol.
Cell16,861–-865(2004).
https://www.360docs.net/doc/c28547947.html,pidot,T.et al.A cell initiating human acute myeloid leukaemia after
transplantation into SCID mice.Nature367,645–-648(1994).
26.Reya,T.,Morrison,S.J.,Clarke,M.F.&Weissman,I.L.Stem cells,cancer,and
cancer stem cells.Nature414,105–-111(2001).
27.Al-Hajj,M.,Wicha,M.S.,Benito-Hernandez,A.,Morrison,S.J.&Clarke,M.F.
Prospective identi?cation of tumorigenic breast cancer cells.Proc.Natl Acad.
https://www.360docs.net/doc/c28547947.html,A100,3983–-3988(2003).
28.Singh,S.K.et al.Identi?cation of human brain tumour initiating cells.Nature
432,396–-401(2004).
29.Yeoh,E.J.et al.Classi?cation,subtype discovery,and prediction of outcome in
pediatric acute lymphoblastic leukemia by gene expression pro?ling.Cancer
Cell1,133–-143(2002).
30.Ferrando,A.A.et al.Gene expression signatures de?ne novel oncogenic
pathways in T cell acute lymphoblastic leukemia.Cancer Cell1,75–-87(2002). Supplementary Information is linked to the online version of the paper at https://www.360docs.net/doc/c28547947.html,/nature.
Acknowledgements We thank https://www.360docs.net/doc/c28547947.html,nder for critical review of the manuscript, S.Ramaswamy for discussions,and J.-P.Brunet,S.Monti,https://www.360docs.net/doc/c28547947.html,dd-Acosta and S.Shurtleff for computational help and technical assistance.We also thank
J.Jacobson and Luminex Corporation for advice and technical support.E.A.M. was supported by the Howard Hughes Medical Institute.H.R.H.,T.J.and T.R.G. are Investigators of the Howard Hughes Medical Institute.
Author Information miRNA expression data have been submitted to the Gene Expression Omnibus under the series accession number GSE2564.Reprints and permissions information is available at https://www.360docs.net/doc/c28547947.html,/reprintsandpermissions. The authors declare no competing?nancial interests.Correspondence and requests for materials should be addressed to T.R.G.(golub@https://www.360docs.net/doc/c28547947.html,).
LETTERS NATURE|Vol435|9June2005
荧光素酶报告基因实验自我总结
荧光素酶报告基因实验自我总结 实验原理: 目前由两个主要的应用方向: 第一是检测转录因子与目的基因启动子区DNA相互作用,转录因子是一种具有特殊结构、行使调控基因表达功能的蛋白质分子,也称为反式作用因子。某些转录因子仅与其靶启动子中的特异顺序结合,这些特异性的序列被称为顺式因子,转录因子的DNA结合域和顺式因子实现共价结合,从而对基因的表达起抑制或增强的作用。荧光素酶报告基因实验(luciferase Assay)是检测这类转录因子和其靶启动子中的特异顺序结合的重要手段。 第二是研究微小RNA(microRNA)对于靶基因的调控,通过生物信息学方法预测microRNA潜在的靶基因以及干预位点序列,并设计合适的microRNA质粒或干预片段,同时构建靶基因的报告基因质粒,二者同时转染细胞,这是确定microRNA是否能影响(上调或下调)靶基因的首选研究方法。 实验流程: 1)构建一个将靶启动子的特定片段插入到荧光素酶表达序列前方的报告基因质粒,如pGL3-basic(转录因子与靶基因)或pMIR-REPORT Luciferase质粒(微小RNA与靶基因)2)将要检测的转录因子表达质粒(或microRNA质粒)与报告基因质粒共转染293细胞或目的细胞。如果此转录因子(或microRNA)能够激活靶启动子,则荧光素酶基因就会表达,荧光素酶的表达量与转录因子的作用强度成正比。 3)加入特定的荧光素酶底物,荧光素酶与底物反应,产生荧光素,通过检测荧光的强度可以测定荧光素酶的活性,从而判断转录因子是否能与此靶启动子片段有作用。 实验目的:研究转录因子和MicRNA对于靶基因调控的首先方法 实验步骤: (1)用生物信息学方法分析并预测启动子区可能的转录因子结合位点。 (2)设计引物用PCR法从基因组DNA中克隆所需的靶启动子片段,将此片段插入到荧光素酶报告基因质粒中。 (3)筛选阳性克隆,测序,扩增克隆并提纯质粒备用。 (4)扩增转录因子质粒(或microRNA质粒),提纯备用,同时准备相应的空载质粒对照。(5)培养293细胞(或其它目的细胞),并接种于12孔板中,生长24小时(80%汇合度)。(6)将报告基因质粒与转录因子表达质粒共转染细胞。 (7)用适当的方法提取蛋白并用于荧光素酶检测。 (8)加入酶作用底物,于荧光计数仪上测定荧光素酶的活性。 (9)计算相对荧光强度,并与空载对照比较,判断影响因子是否有效的作用于靶基因。
荧光素酶常见问题与解答
1) 什么是双荧光素酶报告基因测试系统(DLR) DLR 测试系统灵敏,方便,在一个系统中用于测量两个单独的荧光素酶报告基因,萤火虫荧光素酶及海洋海肾荧光素酶 (Renilla reniformis) ,DLR测试系统可用于细胞裂解物及无细胞的翻译系统。 2) 有哪些海肾荧光素酶载体 海肾荧光素酶载体pRL用于在转染的哺乳细胞中组成性地表达海肾荧光素酶。这类载体还有T7启动子,可用 T7RNA 聚合物在体外合成海肾荧光素酶,有4个不同的载体: pRL-SV40 载体 pRL-SV40 载体含 SV40 增强子及早期启动子区域,可在多种细胞中组成性地高表达海肾荧光素酶。 pRL-SV40 载体还含有 SV40 的复制起始区,可在表达 SV40 大 T 抗原的细胞中,如 COS-1 , COS-7 细胞中,瞬时及附加体似地复制。 pRL-CMV 载体 pRL-CMV 载体含有 CMV 极早增强子及启动子,可在多种细胞中组成性地高表达海肾荧光素酶。 pRL-TK 载体 pRL-TK 载体含 HSV 胞嘧啶激酶启动子区域,在多种细胞中组成性地弱表达海肾荧光素酶。pRL-null 载体 pRL-null 载体缺真核启动子及增强子,在海肾荧光素酶基因的上游含有多克隆位点。 3) 用双报告基因有何优点 一般地说,实验报告基因用于测试实验条件下基因的表达,而另一个报告基因作为内对照,以提供实验报告基因测试的归一化。将实验报告基因的活力与内对照报告基因的活力作归一化可消除实验中不同测试间所固有的变化,这些变化减弱实验准确度,其中包括培养细胞的数目及活力的差异,细胞转染及裂解的效率。海肾荧光素酶可用作对照报告基因及实验报告基因。在双荧光素酶报告基因测试中,将萤火虫荧光素酶作为实验报告基因,海肾荧光素酶作为对照报告基因。
引物设计基本方法
Primer 5.0搜索引物: 1.Primer Length我常设置在18-30bp,短了特异性不好,长了没有必要。当然有特殊要求的除外,如加个酶切位点什么的。 2.PCR Product size最好是100-500bp之间,小于100bp的PCR产物琼脂糖凝胶电泳出来,条带很模糊,不好看。至于上限倒也不必要求苛刻。 3.Search parameters还是选Manual吧,Search stringency应选High,GC含量一般是40-60%。其它参数默认就可以了。 4.搜索出来的引物,按Rating排序,逐个送Oligo软件里评估。当然,搜索出的引物,其扩增产物很短,你可以不选择它,或是引物3端≥2个A或T,或引物内部连续的G或C太多,或引物3端≥2个G或C,这样的引物应作为次选,没得选了就选它。对于这样的引物,如果其它各项指标还可以,我喜欢在引物末端去掉一个不满意的或加上一个碱基,看看引物的评估参数有没有变好点。 Oligo 6.0评估引物: 1.在analyze里,Duplex Formation不管是上游引物、下游引物还是上下游引物之间,The most stable 3’-Dimer绝对值应小于4.5kcal/mol, The most stable Dimer overall绝对值一般应小于多少kcal/mol跟PCR退火温度有关,我几次实验感觉在PCR退火温度在65°的时候,The most stable Dimer ove rall 6.7kcal/mol没有问题。 2.Hairpin Formation根据黄金法则 3.False priming sites: Primer的priming efficiency应该是错配地方的4倍左右,更多当然更好。 4.在PCR栏,个人感觉其所显示的optimal annealing temperature数值值得参考。在PCR摸索条件的时候,退火温度为其数值加减2的范围就可以了。 5.Internal stability很重要:我们希望引物的内部稳定性是中间高、两边低的弧形,最起码保证3端不要过于稳定。下图1引物3端过于稳定,很容易导致不适当扩增。△G参照黄金法则,这其实很好理解:把一滴水放到大海里,这滴水就会不停的扩散分布,扩散的越厉害越稳定,所以△G绝对值越大结构越稳定。 最后说一句,敢于尝试就会成功。 第二贴 --科室工作很多,小医生了,没有办法,所以肯怕不能满足很多战友的要求(qq聊或帮助设计),在此表示抱歉。就楼上的问题我试着回答一下,不一定正确,供参考吧。 --1、两个评价系统不一样,个人感觉oligo评价引物好点,primer出来的引物,我一般按效率排序,再结合退火温度和引物长度,选择引物到oligo测试。这是初步的选择,其实引物到了oligo里,退火温度也不一样。 --2、3端的二聚体应该避免,这个要看你的退火温度决定,一个50°的退火温度肯定和65°对二聚体的影响不一样了,一般来讲尽量控制在-4.5kcal/mol以下(个人观点,很多东西真得还是需要自己摸索)。 --3、个人感觉3端有A无A影响不大,3端有T的没有经验。有T是不是一定不行,个人感觉不见得。软件是评估,法则也不是没有例外,不是1+1=2那么确定。 --4、错配和二聚体谁轻谁重,个人觉得“到致命的程度”谁都重要,我也说不好。我设计的时候,尽量两个都不得罪。 --5、GC含量并非不重要,它直接影响引物各端稳定性,3端来两个G或C,稳定性就上去了,粘在模板上很牢。所以我设计的时候,尽量避免这样的情况出现。 谈一下我学这个引物设计的过程吧:
熊去氧胆酸片说明书
熊去氧胆酸片说明书 熊去氧胆酸片(人福)用于胆固醇型胆结石,形成及胆汁缺乏性脂肪泻,也可用于预防药物性结石形成及治疗脂肪痢(回肠切除术后)。下面是小编整理的熊去氧胆酸片说明书,欢迎阅读。 熊去氧胆酸片商品介绍 通用名:熊去氧胆酸片 生产厂家: 宜昌人福药业有限责任公司 批准文号:国药准字H42022097 药品规格:50mg*30片 药品价格:¥8.8元 熊去氧胆酸片说明书 【通用名称】熊去氧胆酸片 【商品名称】熊去氧胆酸片 【拼音全码】XiongQuYangDanSuanPian 【主要成份】熊去氧胆酸片主要成份为熊去氧胆酸。化学名:3a,7b-二羟基-5b-胆甾烷-24-酸分子式:C24H40O4分子量:392.58 【性状】熊去氧胆酸片为白色片。 【适应症/功能主治】熊去氧胆酸片用于胆固醇型胆结石,形成及胆汁缺乏性脂肪泻,也可用于预防药物性结石形成及治疗脂肪痢(回肠切除术后)。 【规格型号】50mg*30s
【用法用量】成人口服:每日8~10mg/kg,早、晚进餐时分次给予。疗程短为6个月,6个月后超声波检查及胆囊造影无改善者可停药;如结石已有部分溶解则继续服药直至结石完全溶解。 【不良反应】熊去氧胆酸片的毒性和副作用比鹅去氧胆酸小,一般不引起腹泻,其他偶见的不良反应有便秘、过敏、头痛、头晕、胰腺炎和心动过速等。 【禁忌】胆道完全梗阻和严重肝功能减退者禁用。 【注意事项】1.长期使用熊去氧胆酸片可增加外周血小板的数量。 2.如治疗胆固醇结石中出现反复胆绞痛发作,症状无改善甚至加重,或出现明显结石钙化时,则宜中止治疗,并进行外科手术。 3.熊去氧胆酸片不能溶解胆色素结石、混合结石及不透X线的结石。 【儿童用药】遵医嘱。 【老年患者用药】老年患者慎用。 【孕妇及哺乳期妇女用药】熊去氧胆酸片FDA分类属B类药物,孕妇及哺乳期妇女慎用。 【药物相互作用】1.避孕药可增加胆汁饱和度,用熊去氧胆酸片治疗时应尽量采取其他节育措施以免影响疗效。2.考来烯胺(Cholestyramine,消胆胺)、考来替泊(Colestipol,降胆宁)和含铝制酸剂都能与CDCA结合,减少其吸收,不宜同用。 【药物过量】若服用过量,立即以不少于1L的考来烯胺或活性炭(每100ml水中2g)洗胃,再口服氢氧化铝悬液50ml。 【药理毒理】熊去氧胆酸片可增加胆汁酸的分泌,同时导致胆汁
双荧光素酶测试系统及海肾类对照报告基因载体
双荧光素酶测试系统及海肾类对照报告基因载体 1.什么是双荧光素酶报告基因测试系统(DLR)? DLR测试系统灵敏,方便,在一个系统中用于测量两个单独的荧光素酶报告基因,萤火虫荧光素酶及海洋海肾荧光素酶(Renilla reniformis),DLR测试系统可用于细胞裂解物及无细胞的翻译系统。 2.有哪些海肾荧光素酶载体? 海肾荧光素酶载体pRL用于在转染的哺乳细胞中组成性地表达海肾荧光素酶。这类载体还有T7启动子,可用T7RNA聚合物在体外合成海肾荧光素酶,有4个不同的载体: A pRL-SV40载体??? pRL-SV40载体含SV40增强子及早期启动子区域,可在多种细胞中组成性地高表达海肾荧光素酶。pRL-SV40载体还含有SV40的复制起始区,可在表达SV40大T抗原的细胞中,如COS-1,COS-7细胞中,瞬时及附加体似地复制。 B pRL-CMV载体pRL-CMV载体含有CMV极早增强子及启动子,可在多种细胞中组成性地高表达海肾荧光素酶。 a pRL-TK载体 pRL-TK载体含HSV胞嘧啶激酶启动子区域,在多种细胞中组成性地弱表达海肾荧光素酶。 b pRL-null载体 pRL-null载体缺真核启动子及增强子,在海肾荧光素酶基因的上游含有多克隆位点。 3.用双报告基因有何优点? 一般地说,实验报告基因用于测试实验条件下基因的表达,而另一个报告基因作为内对照,以提供实验报告基因测试的归一化。将实验报告基因的活力与内对照报告基因的活力作归一化可消除实验中不同测试间所固有的变化,这些变化减弱实验准确度,其中包括培养细胞的数目及活力的差异,细胞转染及裂解的效率。海肾荧光素酶可用作对照报告基因及实验报告基因。在双荧光素酶报告基因测试中,将萤火虫荧光素酶作为实验报告基因,海肾荧光素酶作为对照报告基因。 4.相比用CAT或β-半乳糖苷酶对表达数据作归一化,双荧光素酶报告基因测试系统有何优点?
引物设计原则
1. 引物的长度一般为15-30 bp,常用的是18-27 bp,但不应大于38,因为过长会导致其延伸温度大于74℃,不适于Taq DNA聚合酶进行反应。 2. 引物序列在模板内应当没有相似性较高,尤其是3’端相似性较高的序列,否则容易导致错配。引物3’端出现3个以上的连续碱基,如GGG或CCC,也会使错误引发机率增加。 3. 引物3’端的末位碱基对Taq酶的DNA合成效率有较大的影响。不同的末位碱基在错配位置导致不同的扩增效率,末位碱基为A的错配效率明显高于其他3个碱基,因此应当避免在引物的3’端使用碱基A。另外,引物二聚体或发夹结构也可能导致PCR反应失败。5’端序列对PCR影响不太大,因此常用来引进修饰位点或标记物。 4. 引物序列的GC含量一般为40-60%,过高或过低都不利于引发反应。上下游引物的GC含量不能相差太大。 5. 引物所对应模板位置序列的Tm值在72℃左右可使复性条件最佳。Tm值的计算有多种方法,如按公式Tm=4(G+C)+2(A+T),在Oligo软件中使用的是最邻近法(the nearest neighbor method)。 6. ΔG值是指DNA双链形成所需的自由能,该值反映了双链结构内部碱基对的相对稳定性。应当选用3’端ΔG值较低(绝对值不超过9),而5’端和中间ΔG值相对较高的引物。引物的3’端的ΔG值过高,容易在错配位点形成双链结构并引发DNA聚合反应。 7. 引物二聚体及发夹结构的能值过高(超过mol)易导致产生引物二聚体带,并且降低引物有效浓度而使PCR反应不能正常进行。 8. 对引物的修饰一般是在5’端增加酶切位点,应根据下一步实验中要插入PCR 产物的载体的相应序列而确定。 引物序列应该都是写成5-3方向的, Tm之间的差异最好控制在1度之内, 另外我觉得扩增长度大一些比较好,500bp左右。 要设计引物首先要找到DNA序列的保守区。同时应预测将要扩增的片段单链是否形成二级结构。如这个区域单链能形成二级结构,就要避开它。如这一段不能形成二级结构,那就可以在这一区域设计引物。
胆汁淤积的治疗方法及药物的概述
胆汁淤积的治疗方法及药物的概述 来源:《肝脏》作者:张大志浏览:2567 发布时间:2008-10-13 9:39:00 胆汁淤积不是单一的疾病, 而是一组临床综合征, 且其病因及发病机制十分复杂。因此胆汁淤积的治疗应 包括病因及相关并发症的治疗。 一、病因治疗 1/3的致病原因不明,对基本病因明确的胆汁淤积,如有可能均应力争根治或控制基础疾病。 1. 肝外胆汁淤积的手术治疗:手术治疗主要用于肝外胆汁淤积。肝外胆汁淤积是肝外或近肝门处大胆管的机械梗阻所致, 主要为胆管结石、寄生虫、肿瘤以及感染、发育异常、手术后并发症等引起的肝外胆管阻塞。因此采用手术治疗解除梗阻, 一般能取得较好疗效。目前能采用的手术方式有经内镜介入胆道引流术、经皮肝胆道引流术(PTCD)和开腹手术。(1)经内镜介入胆道引流术: 以其创伤小、病死率低、住院周期短等优点而成为解除肝外梗阻的首选方式。自1973年经内镜十二指肠乳头括约肌切开治疗胆总管结石以来, 经内镜鼻胆管引流术及经内镜胆管支架引流术已广泛用于治疗良、恶性胆道梗阻, 取得较好的效果。但ERCP 术可能因幽门或十二指肠狭窄、先前的胃肠手术、导管无法插入等因素的影响而不能获得成功。近年有报 道ERCP和PTCD失败的患者可在EUS引导下经食管、胃、小肠胆道引流术取得成功, 拓宽了内镜的治疗范围。(2)PTCD:自1974年Molnar和Stocknm首先报道采用PTCD缓解恶性梗阻性黄疸以来, PTCD技术上有很大的改善和发展。但PTCD有一定的并发症, 如胆汁外漏、腹膜炎、大量胆汁流失引起电解质的紊乱、胆道出血、疼痛和患者生活不便,以致许多患者不愿接受。现已成为胆道梗阻经逆行性胆管造影术治疗失 败后的一种选择。(3)开腹手术:因创伤大、并发症多、住院时间长、费用高等弊端而成为胆汁淤积手术治疗的次要选择。但肝移植术仍不失为治愈复发性、顽固性胆汁淤积瘙痒及某些潜在肝脏疾病的最终方法。 2. 胆小管的免疫性损伤:免疫抑制剂可抑制免疫反应和炎症反应、促进胆汁分泌等作用, 能有效改善患者临床症状和肝功能, 可用于治疗多种病因的肝内胆汁淤积。但免疫抑制剂由于选择性和特异性的限制, 在 治疗的同时不可避免地会损害造血系统、免疫系统及肝、肾功能, 可能引发更为严重的损害,如硫唑嘌呤 的使用可能导致胆汁淤积和肝细胞损害。
荧光素酶报告基因检测
荧光素酶报告基因检测 ●原则 荧光素酶检测系统,可用裂解液来温和而快速地提取真核细胞中的荧光素酶,用其底物来检测荧光素酶活性。检测步骤如下: 1)加裂解缓冲液裂解转染的细胞。 2)将上述裂解物转移入微孔板或者试管中(根据检测的需要选择所用器材类型)。 3)加入含有所有酶反应成分(必须包括底物荧光素),使化学发光反应开始。 4)用荧光仪或者液闪计数仪检测所发射的荧光。 ●特点 ◆敏感度和检测范围:5 fg荧光素酶 ◆发射光的线性范围:10 fg—10 ng ◆确切的检测限依检测仪器而定。 ◆特异性:本文介绍的荧光素酶报告基因系统的操作步骤,通常用来检测转染了萤火虫荧光素酶 基因的真核细胞中荧光素酶表达的活性。不适用于对细菌荧光素酶进行检测。 ●器材和试剂 ◆器材 在微孔板或试管中,用自动或手动荧光仪、液闪计数仪或者摄影胶片都可以检测到荧光素酶活性,而且高度敏感。当用微孔板时可以是白色,也可为黑色。 ◆试剂 1)荧光素酶检测试剂:荧光素酶检测试剂包括荧光素、ATP、CoA、以及一些添加剂,这些 试剂可以启动酶反应。这种荧光酶检测试剂的混合物可稳定保存在在-60℃以下12个月,- 15℃~- 25℃一个月,2℃~8℃只能保存一周。避免反复冻融。应避光保存,因为荧光素在 光照下会发生氧化。 2)裂解缓冲液:下面将加以介绍。 ●基本操作步骤 下面的操作步骤适用于培养的真核细胞。提取物必须立刻检测,否则必须在-15~-25℃储存大约一个月。不要反复冻融以避免酶活性的降低。 1)将荧光素酶报告基因与β-gal对细胞进行共转染,按实验计划进行处理。 2)彻底吸去培养皿(60mm)中的细胞培养液,用冰预冷的磷酸盐缓冲液(PBS,无钙和镁离子) 小心冲洗细胞3次,彻底去除剩余的PBS。10×PBS缓冲液:NaCl 100g,KCl 2.5g,Na2HPO4 14.4g,KH2PO42.5g,用三蒸水定容至1000 ml。 3)加入最小体积的Triton/甘氨酰甘氨酸裂解缓冲液盖过细胞,例如60 mm的培养皿用360 μl裂 解液,35毫米的培养板用150 μl裂解液。用橡皮刮将细胞刮离培养皿。将裂解物转移到微量离 心管中。Triton/甘氨酰甘氨酸裂解缓冲液:1%(v/v)Triton X-100,25mmol/L甘氨酰甘氨酸(p H7.8),15mmol/L MgSO4,4mmol/L EGTA,1mmol/L DTT(临用前加入) 4)在漩涡混合器上轻轻振荡细胞裂解液,以最大速度4℃离心以去除细胞碎片。将上清转移到另 一个微量离心管中,置于冰上以备分析。 5)在开始化学发光反应之前,将100 μl的细胞提取物转移到荧光仪或者液闪计数仪所用的检测 器皿中(我们建议用96孔板)。加入360 μl荧光素酶分析缓冲液。荧光素酶分析缓冲液:25m
引物设计步骤与要点
引物设计step by step 1、在NCBI上搜索到目的基因,找到该基因的mRNA,在CDS选项中,找到编码区所在位置,在下面的origin中,Copy该编码序列作为软件查询序列的候选对象。 2、用Primer Premier5搜索引物 ①打开Primer Premier5,点击File-New-DNA sequence, 出现输入序列窗口,Copy目的序列在输入框内(选择As),此窗口内,序列也可以直接翻译成蛋白。点击Primer,进入引物窗口。 ②此窗口可以链接到“引物搜索”、“引物编辑”以及“搜索结果”选项,点击Search按钮,进入引物搜索框,选择“PCR primers”,“Pairs”,设定搜索区域和引物长度和产物长度。在Search Parameters里面,可以设定相应参数。一般若无特殊需要,参数选择默认即可,但产物长度可以适当变化,因为100~200bp的产物电泳跑得较散,所以可以选择300~500bp. ③点击OK,软件即开始自动搜索引物,搜索完成后,会自动跳出结果窗口,搜索结果默认按照评分(Rating)排序,点击其中任一个搜索结果,可以在“引物窗口”中,显示出该引物的综合情况,包括上游引物和下游引物的序列和位置,引物的各种信息等。 ④对于引物的序列,可以简单查看一下,避免出现下列情况:3’不要出现连续的3个碱基相连的情况,比如GGG或CCC,否则容易引起错配。此窗口中需要着重查看的包括:Tm 应该在55~70度之间,GC%应该在45%~55%间,上游引物和下游引物的Tm值最好不要相差太多,大概在2度以下较好。该窗口的最下面列出了两条引物的二级结构信息,包括,发卡,二聚体,引物间交叉二聚体和错误引发位置。若按钮显示为红色,表示存在该二级结构,点击该红色按钮,即可看到相应二级结构位置图示。最理想的引物,应该都不存在这些二级结构,即这几个按钮都显示为“None”为好。但有时很难找到各个条件都满足的引物,所以要求可以适当放宽,比如引物存在错配的话,可以就具体情况考察该错配的效率如何,是否会明显影响产物。对于引物具体详细的评价需要借助于Oligo来完成,Oligo自身虽然带有引物搜索功能,但其搜索出的引物质量感觉不如Primer5. ⑤在Primer5窗口中,若觉得某一对引物合适,可以在搜索结果窗口中,点击该引物,然后在菜单栏,选择File-Print-Current pair,使用PDF虚拟打印机,即可转换为Pdf文档,里面有该引物的详细信息。 3、用Oligo验证评估引物 ①在Oligo软件界面,File菜单下,选择Open,定位到目的cDNA序列(在primer中,该序列已经被保存为Seq文件),会跳出来两个窗口,分别为Internal Stability(Delta G)窗口和Tm窗口。在Tm窗口中,点击最左下角的按钮,会出来引物定位对话框,输入候选的上游引物序列位置(Primer5已经给出)即可,而引物长度可以通过点击Change-Current oligo length来改变。定位后,点击Tm窗口的Upper按钮,确定上游引物,同样方法定位下游引物位置,点击Lower按钮,确定下游引物。引物确定后,即可以充分利用Analyze 菜单中各种强大的引物分析功能了。
荧光素酶报告系统
亦称发光酶。是催化生物发光的酶系的总称。它是光物质的冷水抽提物在氧中发光时,底物虫荧光素被消耗以后残余的对热不稳定的高分子成分。现在对萤虫相海萤以及发光细菌的虫荧光素酶结晶物的研究得最多。它们属于加氧酶(oxygenase),不含金属和辅酶。对于发光,有的酶必须以ATP等作为辅助 因子,有的则不需要。其发光机制等已了解到可因种的不同而有很大的差异,虫萤光素酶具有高度的特异性,一般仅作用于来自近缘种的虫荧光素。当然,萤虫、海萤的酶是不能互相代替引起发光的。海萤的虫荧光素酶在干燥状态下相当稳定,可以保存 双荧光素酶报告基因测试∶结合萤火虫和海洋腔肠荧光素酶先进的共报告基因测试技术 在用萤火虫荧光素酶定量基因表达时,通常采用第二个报告基因来减少实验的 变化因素。但传统的共报告基因(比如CAT,β-Gal,GUS)不够便利,因为各自的测 试化学,处理要求,检测特点存在差异。Promega提供一种先进的双报告基因技术,结合了萤火虫荧光素酶测试和海洋腔肠荧光素酶测试。双荧光素酶报告基因测试系统,结合pRL载体系统,表达第二个报告基因海洋腔肠荧光素酶,在单管中进行 双荧光素酶报告基因测试,快速,灵敏,简便。系统还提供PLB裂解液,用来裂解在多孔板中培养的哺乳细胞,不需操作单个样品。对于正在使用萤火虫荧光素酶报 告基因载体的研究人员。双荧光素酶报告基因测试系统将使他们立即体会到该系统的便利。 介绍 双报告基因用于实验系统中作相关的或成比例的检测, 通常一个报告基因 作为内对照, 使另一个报告基因的检测均一化。检测基因表达时双报告基因通常用来瞬时转染培养细胞,带有实验报告基因的载体共转染带有不同的报告基因作为对照的第二个载体。通常实验报告基因偶联到调控的启动子, 研究调控基因的结构和生理基础。报告基因表达活力的相对改变与偶联调控启动子转录活力的改变相关,偶联到组成型启动子的第二个报告基因,提供转录活力的内对照, 使测试不被实验条件变化所干扰。 通过这种方法, 可减少内在的变化因素所削弱的实验准确性, 比如, 培养细 胞的数目和活力的差别, 细胞转染和裂解的效率。 使用萤火虫荧光素酶,结合氯霉素乙酰转移酶(CAT), β-半乳糖苷酶(β-Gal), 或葡萄醛酸糖苷酶(GUS)的双报告基因,近几年已普遍使用。但这些双报告基因 组合削弱了荧光素酶操作的优势, 比如荧光素酶测试和定量可在几秒钟内进行, 但CAT, β-Gal和GUS测试法, 则在定量前需要长时间的保温。另外,这些报告 基因受限于它们的灵敏度和线性应答范围, 必须注意不要超过这些范围, 内源性
荧光素酶及其报告基因的应用和检测
荧光素酶及其报告基因的应用和检测 一生物发光 生物发光(bioluminescence)是指生物体发光或生物体提取物在实验室中发光的现象。它不依赖于有机体对光的吸收,而是一种特殊类型的化学发光,化学能转变为光能的效率几乎为100%。也是氧化发光的一种。生物发光的一般机制是:由细胞合成的化学物质,在一种特殊酶的作用下,使化学能转化为光能。 与荧光的区别在于 荧光:荧光检测需要激发光源,发射光的能量来源于激发光,荧光反应为瞬时反应。 发光:生物发光、化学发光,发光反应无需激发光源,发射光的能量来源于化学反应,发光有一定的持续时间。 二荧光素酶 荧光素酶(Luciferase)是生物体内催化荧光素(luciferin)或脂肪醛(firefly aldehyde)氧化发光的一类酶的总称,来自于自然界能够发光的生物。 自然界存在的荧光素酶来自萤火虫、发光细菌、发光海星、发光节虫、发光鱼、发光甲虫等。细菌荧光素酶对热敏感,因此在哺乳细胞的应用中受到限制。目前,以北美萤火虫虫(Photinus pyralis)来源的荧光素酶基因应用的最为广泛,该基因可编码550个氨基酸的荧光素酶蛋白,是一个61kDa的单体酶,无需表达后修饰,直接具有完全酶活。 发光机制 生物荧光实质是一种化学荧光。萤火虫荧光素酶在Mg2+、ATP、O2的参与下,催化D2荧光素(D2luciferin) 氧化脱羧,产生激活态的氧化荧光素,并放出光子,产生550~ 580 nm 的荧光,其化学反应式如下。 这种无需激发光就可发出偏红色的生物荧光,其组织穿透能力明显强于绿色荧光蛋白( GFP) 。荧光素酶是靠酶和底物的相互反应发光,特异性很强,灵敏度高,由于没有激发光的非特异性干扰, 信噪比也比较高。 三荧光素酶报告基因 报告基因(report gene)是一种易于检测蛋白质或酶等表达产物的基因,可通过报告基因产物的表达来“报告”目的基因的表达调控。通常把报告基因的编码序列和基因表达调节序列融合形成嵌合基因,或与其他目的基因融合,在调控序列控制下进行表达,
引物设计的原理与方法
引物设计的原理与方法 This model paper was revised by the Standardization Office on December 10, 2020
PCR引物设计的原理及方法 阎振鑫S111666(四川大学生命科学学院细胞生物学成都 610014) 摘要:自20世纪后期发展了PCR技术以来,PCR已经改变了整个生物学研究的进程。而PCR反应的第一步就是设计引物,引物设计的好坏直接关系到PCR的成败。PCR引物设计有许多的原则必须要遵循:引物与引物之间避免形成稳定的二聚体或发夹结构,引物与模板的序列要紧密互补。引物不能在模板的非目的位点引发DNA聚合反应等。另外,引物的设计方法也越来越多,出现了许多专门的设计软件和网站,如:PrimerPremier5.0等。 关键词:PCR 引物原理方法 NCBI PrimerPremier5.0 PCR primer design principle and method YanZhenxin (sichuan Univercity, Life science college cell biology chengdu 610014 ) Abstract: When PCR technology was find, PCR has changed all of the program in research of biology. The design of primer is the frist step of PCR. It is relation to the fate of PCR. There are some principals must be obey: dipolymer and hairpin structure must be avoid between different primers. The DNA polymerization reaction should not be triggered at the wrong site. Therefore, there are more and more methods of design primer, include the professional softwares and professional web site. Key word: PCR primer principle NCBI PrimerPremier5.0 聚合酶链式反应(Polymerase chain reaction。PCR)是20世纪后期发展起来的 一种体外扩增特异DNA片断的技术。具有快速、简便及高度敏感等优点,能极大地缩短目的基因扩增时间[1]。因此,其一直是生物学者们致力于构建cDNA文库、基因克隆以及表达调控研究的必要前提和基础[2]。PCR的第一步就是引物设计。引物设计的好坏,直接影响了PCR的结果,因此这一步很关键。成功的PCR反应既要高效,又要特异性扩增产物,因此对引物设计提出了较高的要求。引物设计需要注意的地方很多,在大多数情况下,我们都是在知道已知模板序列时进行PCR扩增的。在某些情况比如构建文库的时候也会在不知道模板序列的情况下进行设计。这个时候随机核苷酸序列
熊去氧胆酸片
熊去氧胆酸片 【药品名称】 通用名称:熊去氧胆酸片 英文名称:Ursodeoxycholic Acid 【成份】 本品主要成份为:熊去氧胆酸。其化学名称为:3a,7b-二羟基-5b-胆甾烷-24-酸。 【适应症】 本品用于胆固醇型胆结石,形成及胆汁缺乏性脂肪泻,也可用于预防药物性结石形成及治疗脂肪痢(回肠切除术后)。 【用法用量】 口服,利胆:一次50mg(1片),一日150mg(3片); 溶胆石:一日450-600mg(9-12片),分2次服用; 或每日按体重8-10mg/kg,肥胖者需每日15mg/kg,进食时分2次给予。 【不良反应】 本品的毒性和副作用比鹅去氧胆酸小,一般不引起腹泻,其他偶见的不良反应有便秘、过敏、头痛、头晕、胰腺炎和心动过速等。治疗期可引起胆结石钙化,软便。 【禁忌】 急性胆系感染、胆道梗阻、孕妇及哺乳期妇女。 【注意事项】 (1)长期使用本品可增加外周血小板的数量。(2)如治疗胆固醇结石中出现反复胆绞痛发作,症状无改善甚至加重,或出现明显结石钙化时,则宜中止治疗,并进行外科手术。(3)本品不能溶解胆色素结石、混合结石及不透X线的结石。【孕妇及哺乳期妇女用药】
本品FDA分类属B类药物,孕妇及哺乳期妇女慎用。【老年患者用药】老年患者慎用。 【特殊人群用药】 儿童注意事项: 妊娠与哺乳期注意事项: 孕妇及哺乳期妇女禁用。 老人注意事项: 老年患者慎用。 【药物相互作用】 熊去氧胆酸胶囊不应与考来烯胺(消胆胺)、考来替泊(降胆宁)、氢氧化铝和/或氢氧化铝-三硅酸镁等药同时服用,因为这些药可以在肠中和熊去氧胆酸结合,从而阻碍吸收,影响疗效。如果必须服用上述药品,应在服用该药前两小时或在服药后两小时服用熊去氧胆酸胶囊。熊去氧胆酸胶囊可以增加环孢素在肠道的吸收,服用环孢素的患者应做环孢素血清浓度的监测,必要时要调整服用环孢素的剂量。个别病例服用熊去氧胆酸胶囊会降低环丙沙星的吸收。 【药理作用】 本品可增加胆汁酸的分泌,同时导致胆汁酸成分的变化,使本品在胆汁中的含量增加。 本品还能显著降低人胆汁中胆固醇及胆固醇酯的摩尔浓度和胆固醇的饱和指数,从而有利于结石中胆固醇逐渐溶解 【贮藏】 遮光,密封保存。 【批准文号】
荧光素酶报告实验
荧光素酶报告实验 1 扩增目的片段 扩增包含靶基因与miRNA互补位点的3’UTR序列以及mutant序列,上下游引物5’端各含有不同的酶切位点和保护碱基(如Pme I,Spe I);电泳检测目的条带,看大小是否正确,然后用试剂盒纯化PCR产物备用。主要采用了2 种方法进行序列突变及扩增,如下图所示:第一种方法: 第二种方法: 1.2 取1-2 μg纯化的目的片段或pMIR-REPORT载体,按酶切反应体系配制混合液进行酶切(加0.01% BSA),酶切3h后,80℃灭活5 min,冰上降温。酶切产物进行胶回收。
酶切体系连接体系Component V olume (μl) Component V olume (μl) H2O 16-x H2O 8-m-n Vector or DNA x Vector m NEB Buffer I或IV 2 DNA n Spe I 1 10×T4 Ligase Buffer 1 Pme I 1 T4 DNA Ligase 1 Total voloume 20 Total voloume 10 1.3 配制连接反应混合液(DNA和Plasmid的molar ratio为3:1到6:1),16℃连接过夜或室温连接10 min。连接完毕后,将连接产物转化入感受态大肠杆菌(热激法)。Amp(100 μg/ml)抗性培养板筛选阳性克隆,菌落PCR鉴定目的片段,送3个样本测序,提取质粒酶切鉴定等。并扩繁阳性克隆。重组Luc-3’UTR 质粒主要元件和组成如下图所示(重组Luc-3’UTR-Mut 原理相同): pLuc-MET 3'UTR 荧光素酶报告基因载体的构建 4.接种对数生长期的HEK293细胞(10% FBS+90% DMEM培养)于96孔板,3×103个/孔,每个实验组设置6个复孔,37℃,5% CO2培养箱中培养24h; 5.根据Lipofectamine 2000转染试剂说明书,配制转染液,转染HEK293细胞; A 液B液 pLuc-3’UTR 0.1 μg Lipofectamine 2000 0.5 μl pRL-SV40 0.05 μg OPTI-MEM 25 μl Mimic/NC 100 nM终浓度 OPTI-MEM 25 μl 6 转染48 h后,吸除96孔板中的培养液,用ddH2O稀释Passive Lysis Buffer至1×浓度,在96孔板中加入1×Passive Lysis Buffer,20 μl/孔,用移液枪反复吸打裂解细胞; 7 在白色不透明的96孔板中加入100 μl/孔的Luciferase Assay Substrate; 8 从每孔裂解好的细胞悬液中吸出11.5 μl加入Luciferase Assay Substrate中混匀; 9 在酶标仪500 ms条件下检测,并记录数据; 10 用Stop & Glo? Buffer稀释Stop & Glo? Substrate至1×使用浓度; 11 在第7步完成后,加入Stop & Glo? Substrate 100 μl/孔,混匀; 12 在酶标仪500 ms条件下检测,并记录数据,两次测得数据的比值代表各孔样本的相对荧光强度。
双荧光素酶报告基因检测试剂盒使用说明
双荧光素酶报告基因检测试剂盒使用说明 产品说明: 报告基因检测,是真核基因表达调控研究的常用方法。由于检测光量子的方法非常敏感,采用生物发光(bioluminescent)法,是报告基因检测最常用的有效手段。荧光素酶(luciferase)催化底物荧光素的转化,发射出光子。萤火虫荧光素酶(Firefly luciferase)和海肾荧光素酶(Ranilla luciferase)催化的发光反应,具有相似的光学特征和很好的浓度线性范围(7~8个数量级的线性范围),酶的检测灵敏度达10-18mol到10-20mol,但两者催化的化学反应底物和最适反应条件完全不同。这两种荧光素酶配合形成了十分有效的双荧光素酶报告基因系统,其中Ranilla luciferase通常作为内参照。 本试剂盒提供了一体化形式的双荧光素酶检测系统。采用通用裂解缓冲液,适合于两种荧光素酶活性的保持,且与其他类型的报告基因检测和蛋白含量检测兼容;优化的两种酶反应体系,使每种发光反应持续数十分钟,以便于手工操作多个样品;并保证Firefly luciferase发光及时淬灭,不影响后续Ranilla luciferase的测定;优化的反应体系还使两种荧光素酶活性比值趋于合理的敏感范围,更有利于后续数据的比较。 产品内容: 名称数量保存条件5x Universal Lysis Buffer(通用裂解液)25ml-20℃ Fassay Buffer I(虫酶缓冲液)10ml-20℃ Fassay Substrate I(虫酶底物)0.5ml-20℃ Rassay Buffer II(海酶缓冲液)10ml-20℃ Rassay Substrate II(海酶底物)0.2ml-20℃可作100次双荧光素酶检测。低温运输,-20℃或-80℃避光保存。有效期6个月。
双荧光素酶测试系统及海肾类对照报告基因载体
双荧光素酶测试系统及海肾类对照报告基因载 体 Company Document number:WTUT-WT88Y-W8BBGB-BWYTT-19998
双荧光素酶测试系统及海肾类对照报告基因载体 1.什么是双荧光素酶报告基因测试系统(DLR)? DLR测试系统灵敏,方便,在一个系统中用于测量两个单独的荧光素酶报告基因,萤火虫荧光素酶及海洋海肾荧光素酶(Renilla reniformis),DLR测试系统可用于细胞裂解物及无细胞的翻译系统。 2.有哪些海肾荧光素酶载体? 海肾荧光素酶载体pRL用于在转染的哺乳细胞中组成性地表达海肾荧光素酶。这类载体还有T7启动子,可用T7RNA聚合物在体外合成海肾荧光素酶,有4个不同的载体: A pRL-SV40载体pRL-SV40载体含SV40增强子及早期启动子区域,可在多种细胞中组成性地高表达海肾荧光素酶。pRL-SV40载体还含有SV40的复制起始区,可在表达SV40大T抗原的细胞中,如COS-1,COS-7细胞中,瞬时及附加体似地复制。 B pRL-CMV载体pRL-CMV载体含有CMV极早增强子及启动子,可在多种细胞中组成性地高表达海肾荧光素酶。 a pRL-TK载体 pRL-TK载体含HSV胞嘧啶激酶启动子区域,在多种细胞中组成性地弱表达海肾荧光素酶。 b pRL-null载体 pRL-null载体缺真核启动子及增强子,在海肾荧光素酶基因的上游含有多克隆位点。 3.用双报告基因有何优点? 一般地说,实验报告基因用于测试实验条件下基因的表达,而另一个报告基因作为内对照,以提供实验报告基因测试的归一化。将实验报告基因的活力与内对照报告基因的活力作归一化可消除实验中不同测试间所固有的变化,这些变化减弱实验准确度,其中包括培养细胞的数目及活力的差异,细胞转染及裂解的效率。海肾荧光素酶可用作对照报告基因及实验报告基因。在双荧光素酶报告基因测试中,将萤火虫荧光素酶作为实验报告基因,海肾荧光素酶作为对照报告基因。 4.相比用CAT或β-半乳糖苷酶对表达数据作归一化,双荧光素酶报告基因测试系统有何优点
引物设计的原理与方法
PCR引物设计的原理及方法 阎振鑫S111666(四川大学生命科学学院细胞生物学成都610014) 摘要:自20世纪后期发展了PCR技术以来,PCR已经改变了整个生物学研究的进程。而PCR反应的第一步就是设计引物,引物设计的好坏直接关系到PCR的成败。PCR引物设计有许多的原则必须要遵循:引物与引物之间避免形成稳定的二聚体或发夹结构,引物与模板的序列要紧密互补。引物不能在模板的非目的位点引发DNA聚合反应等。另外,引物的设计方法也越来越多,出现了许多专门的设计软件和网站,如:PrimerPremier5.0等。 关键词:PCR 引物原理方法NCBI PrimerPremier5.0 PCR primer design principle and method YanZhenxin (sichuan Univercity, Life science college cell biology chengdu 610014 ) Abstract: When PCR technology was find, PCR has changed all of the program in research of biology. The design of primer is the frist step of PCR. It is relation to the fate of PCR. There are some principals must be obey: dipolymer and hairpin structure must be avoid between different primers. The DNA polymerization reaction should not be triggered at the wrong site. Therefore, there are more and more methods of design primer, include the professional softwares and professional web site. Key word: PCR primer principle NCBI PrimerPremier5.0 聚合酶链式反应(Polymerase chain reaction。PCR)是20世纪后期发展起来的一种体外扩增特异DNA片断的技术。具有快速、简便及高度敏感等优点,能极大地缩短目的基因扩增时间[1]。因此,其一直是生物学者们致力于构建cDNA文库、基因克隆以及表达调控研究的必要前提和基础[2]。PCR的第一步就是引物设计。引物设计的好坏,直接影响了PCR的结果,因此这一步很关键。成功的PCR反应既要高效,又要特异性扩增产物,因此对引物设计提出了较高的要求。引物设计需要注意的地方很多,在大多数情况下,我们都是在知道已知模板序列时进行PCR扩增的。在某些情况比如构建文库的时候也会在不知道模板序列的情况下进行设计。这个时候随机核苷酸序列就与模板不是完全匹配。我们通常指的设计引物都是在已知模板序列的情况下进行。设计的目的是在两个目标间取得平衡:扩增特异性和扩增效率。