ielts wiriting -Task1
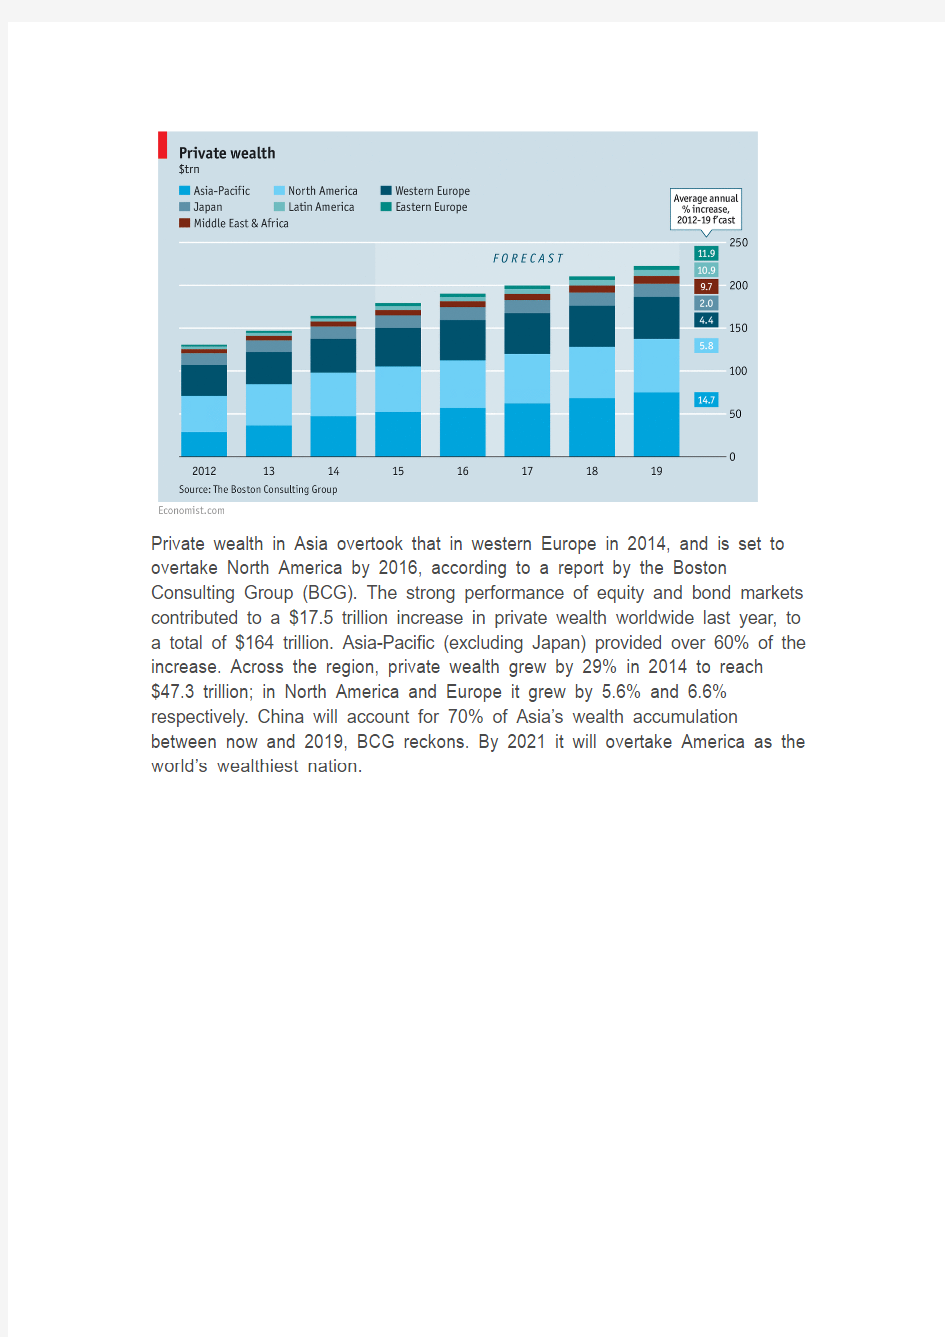
Private wealth in Asia overtook that in western Europe in 2014, and is set to overtake North America by 2016, according to a report by the Boston Consulting Group (BCG). The strong performance of equity and bond markets contributed to a $17.5 trillion increase in private wealth worldwide last year, to a total of $164 trillion. Asia-Pacific (excluding Japan) provided over 60% of the increase. Across the region, private wealth grew by 29% in 2014 to reach $47.3 trillion; in North America and Europe it grew by 5.6% and 6.6% respectively. China will account for 70% of Asia’s wealth accumulation between now and 2019, BCG reckons. By 2021 it will overtake America as the
world’s wealthiest nation.
8. Common Words in Conversations That Make People Sound Less Confident
One way confidence is judged is by an individual’s behavior, especially verbal behavior. That’s according to Deborah Tannen, professor of linguistics at Georgetown University in Washington, D.C. Professor Tannen has been researching the influence of linguistic style on conversations and human relationships since 1974. She has also studied how ways of speaking learned in childhood affect judgments of competence and confidence in the workplace for several years.
How we speak, she says, determines who gets heard, who gets credit, and what gets done. Tannen gives the following example: one publishing company executive said, “I’m hiring a new manager. I’m going to put him in charge of my marketing division,” as if he owned the corporation. In stark contrast, women were saying “we” when referring to work they alone had done. One woman explained that it would sound too
self-promoting to claim credit in an obvious way by saying, “I did this.” Yet she expected—sometimes vainly—that others would know it was her work and would give her the credit.
You might think that your way of speaking is natural, but the words you use and how you use them can determine how your confidence is judged. While there is no such thing as right or wrong words—results vary depending on the context—some common words we use in conversation really just put us at a disadvantage because they are weak and make us seem less confident.
1. “Um” and “Ah”
Many people throw in an “um” whenever they are temporarily lost for words. But there is a reason you won’t hear
these crutch words, as they are known in public speaking, in news bulletins and TV shows. “Um”s and “Ah”s make people seem not only less confident, but also dumb. If you are guilty of this habit, stop it. Instead, take a brief pause when you are temporarily lost for words.
2. “Like” and “You know”
Some other people can’t go three sentences without appending a “like” to th e beginning of a sentence. This is not a good if you want people to take what you say seriously. “Like” and “You
know” are close cousins to crutch words. They make you look silly and incompetent when overused.
3. “Just”
Saying things like, “Just wanted to ask a question” or “Just checking in” weakens your statements and waters down your requests. You seem less sure of yourself and less confident than you probably are. Drop the extra word and speak like a boss. Talk like you know what you want.
4. “Kind Of”
The words “kind of” or “sort of” used in conversations make you come across as vague and ambiguous. You look like you have no idea what’s going on or are afraid of committing. Unless you want people to think you are timid or clueless of what’s going on, do n’t misuse these words.
5. “Hopefully”
If you are always saying “hopefully” to everything in conversation or that you’ll hopefully get something done, you’re actually telling people that you don’t have control over situations.
This can backfire on you because it can communicate that you are weak, powerless or even unreliable.
6. “Actually”
“Actually” has become the new “basically” or “literally.” People use it even where it doesn’t stylistically make sense. For example, the phrase “but actually” is terribly misused. This particular usage is often unnecessary (fluff) and can make you seem uninformed and pitiful.
7. “Sorry”
99% of the times people use the word “sorry” in conversations where no apology is necessary. Saying things like, “Sorry, can you come visi t me?” or “Sorry, can I take you out?” can be misinterpreted to mean you’re not confident. Drop the “sorry” and say what you mean confidently. If you want to apologize for something, say sorry like you really mean it.
8. F-bomb
Dropping the occasional f-bomb (curse words) can add emphasis to what you are saying. But, often curse words are unnecessary
and plain offensive. They suggest you are insecure about what is being discussed or are simply a rude and brutish individual. Cut curse words from your conversations.
Possible solution for glitches in conversation
Admittedly, getting rid of these communication glitches is not easy. The mistakes creep into your conversations before you realize it. However, a technique you can use to curb these errors (suggested by improvement thinkers like Tim Ferriss and Tony Robbins, and also bloggers like Scott H. Young) is to keep a rubber band around your wrist. Every time you make a communication blunder (say, using um’s and ah’s), switch the rubber band onto your opposite wrist. If you can go seven days with the band staying on the same wrist, you’re making progress.
Judge nothing you will feel happy, forgive everything you will be happier, love all you will be the happiest.
互联网女皇”一幅图预言纸媒未来
I t’s always fun when Kleiner Perkins Caulfield Byers analyst Mary Meeker comes out with her annual “State of the Internet” slide deck. There often isn’t all that much that is shocking or surprising about her conclusions, but the slideshow condenses and aggregates information about the state of affairs in tech and media in a very useful way. For example, she has one chart that likely strikes terror (or at least should strike terror) into the heart of print publishers everywhere. 美国最大风投公司凯鹏华盈(KPCB)的分析师玛丽?米克尔每年都会发布年度报告《互联网趋势报告》,内容都颇为有趣。报告中的观点倒不见得多么出人意表,也没有太大轰动性,但当中浓缩整合了科技业与传媒业的现状,读来得益匪浅。例如,她今年的报告中有一幅图表,就有可能让全球纸媒坐立不安。
The chart shows the percentage of time that U.S. adults spend on various forms of media—print, radio, television, etc.—compared to the amount of advertising spending that is devoted to that medium. And when it comes to print, the slide shows a yawning gap between the amount of attention devoted to that medium and the amount of advertising money that gets spent on it: a gap of 14 percentage points, in fact.
图表以百分比形式显示了美国成年人花在纸媒、广播、电视等不同媒体上的时间分布,以及相应媒体获得的广告投放,并将二者进行了对比。在纸媒行业,这张图表显示出一个巨大的鸿沟:其受关注度比其获得的广告投放实际上要低14个百分点。
As Josh Benton points out at the Nieman Journalism Lab, this slide shows up every year in Meeker’s presentation. The latest version is actually s omewhat better in terms of the gap between attention and spending: in the 2011 version, print got 25% of the spending and just 7% of the attention, for a gap of 18 percentage points. Now the gap has shrunk, but it continues to be larger than any other media with the exception of mobile, which is a relatively new category (and its gap is in the other direction).
哈佛大学尼曼新闻实验室主管乔舒亚?本顿指出,米克尔每年的报告中都包含这一对比图。事实上,就受关注度和广告投放之间的悬殊来说,今年的情况有所好转:2011
年同类对比显示,纸媒获得了25%的广告投放,但只有7%的受关注度,相差18
个百分点。虽然差距有所缩小,但纸媒的这一数据鸿沟仍比其他媒体都要大——移动媒体例外,作为一种相对较新的媒体类别,它的差值也很大,但和纸媒背道而驰:其受关注度远超广告投放量。
Just because print gets a smaller amount of attention do esn’t necessarily mean that the proportion of ad spending should be identical,of course. There are plenty of complicating factors—including the fact that many print-based media outlets offer deals to brands that tie sales of online ads to the print version. Print is also arguably better for some forms of “brand building” advertising, or at least a number of advertising agencies and brands continue to believe this.
当然,不能仅仅因为纸媒的受关注度在减少,就认定其广告投放必然下滑。其中牵涉许多复杂的因素,比如许多以纸媒业务为主的媒体集团都与品牌达成协议,将平面与线上广告打包出售。再者也可以说,纸媒更适合某些以“打造品牌”为目标的广告,至少许多广告代理商和品牌方仍然认同这个观点。
But that said, the likelihood of that gap remaining where it is seems vanishingly small. And as media theorist Clay Shirky has argued, there could even be a second “cliff” coming for advertising sales, in which print reach drops below a certain point and ad agencies and brands suddenly decide it is no longer worth it. If nothing else, media entities should remember that corre ctions don’t always happen in nice smooth curves.
即便如此,纸媒的受关注度与广告投放量之间的巨大差距也几乎难以为继。媒体理论家克莱?舍基认为,纸媒广告可能遭遇第二次“断崖式下跌”。届时,纸媒的广告到达率将跌破某一值点,广告公司和品牌会认定纸媒不再具有投放价值。即使退一万步,媒体也应该铭记,纠偏的过程不可能总是一帆风顺。
上图:
Twenty years ago, the Fortune 500 underwent a major relaunch. The original list, which was first published in 1955, only included industrial companies. In the middle of the 20th century, after all, the most important companies made things. The rest were relegated to the Fortune Service 500.
20年前,《财富》美国500强榜单(Fortune 500)经历了一次重大调整。这份榜单最早诞生于1955年,起初只包含工业公司。毕竟在20世纪中期,最重要的公司都是从事生产制造的。而其余公司则被列入了《财富》“美国服务企业500强排行榜”(Fortune Service 500)。
In 1995, Fortune’s editors decided to combine the two lists. And while industrial giants like General Motors
1995年,《财富》编辑决定整合这两份榜单。尽管通用汽车等传统工业巨头仍在榜上名列前茅,但当年排名第4的沃尔玛等新上榜成员也证明:出售产品或服务的公司重要性并不比制造公司低。
Of course, at any given point in time, the most valuable companies on the Fortune 500 can differ significantly from the companies bringing in the most revenue. A
measurement like market capitalization tells us more about what the market believes will be the future of American industry, rather than its present. Studying the most valuable companies on the Fortune 500 since it was reorganized 20 years ago offers a telling portrait of recent American economic history.
当然,无论在任何时候,美国500强中市值最高的公司和收入最高的公司都有很大差别。市值更多体现的是市场对美国产业的未来(而不是当下状况)的看法。研究美国500强榜单调整后这20年来市值最高的公司,可以让我们窥得美国近年来经济史的一角。
The most valuable company on the Fortune 500 20 years ago, General Electric , was a holdover from America’s conglomerate and industrial era. The company’s value was buoyed by the many acquisitions legendary Chairman and CEO Jack Welch made throughout his tenure, like NBC and Honeywell. But soon, Microsoft overtook GE, making clear the overwhelming influence that personal computers had over the U.S. economy. GE briefly reclaimed the top spot following the
dot-com crash.
20年前,《财富》美国500强中市值最高的公司是通用电气,这是美国多元化大公司和工业时代留存下来的巨头。在富有传奇色彩的董事长兼CEO杰克·韦尔奇任内,通用电气进行了多次收购,将美国全国广播公司和霍尼韦尔等纳入麾下,使得公司市值水涨船高。但很快,微软就赶超了通用电气,展现出个人电脑对美国经济的惊人影响力。而在互联网泡沫破灭之后,通用电气一度短暂地重返榜首。
But the oil boom of the last decade, fueled by dwindling supplies and huge growth in emerging markets, pushed Exxon Mobil into the top spot. The oil and gas giant stayed at the top of the heap for seven years, until Apple surged ahead to claim the title it still holds today. We still live in a world dominated by smartphones, apps, and other digital entertainment, all areas that Apple has firmly planted flags.
紧接着,过去十年,受石油供应减少、新兴市场飞速发展的推动,“石油热潮”将埃克森美孚推上了市值最高公司的宝座。这家油气巨头占据榜首达七年之久,随后被苹果赶超,后者开始占据这一王座直至今天。我们目前仍然生活在一个被智能手机、App和其他数字娱乐所主导的世界,而所有这些领域,苹果都牢牢地掌控着大权。
TO BE DELETE:
John Clion’s dismissive asscessment of David Camerion’s fixed EU migration proved the issue not being battle for prime minister. Yesterday, the incoming president said the rules surround people could not be changed. But the edmit lee said the EU was desperate to bring Britain in and it is a very good chance to negotiate. Responding to AA’s remark, Bsaid the proposal would be brought forward before Charismas, and deserved an get the fair hearing,. At today’s summit, EU leaders was trying to agree the target to cut green house gases by 40% by 2030, the prime minister also expect to raise the issue of expenditure, and the parliament asked for budget of 143 billion ero next year, six billion more than EU member’s earlier summit, the final deal would be hammered out next month, the government sourece said euo was too high and unrealistic
Jc J dismissive assessment of David Cameron’s promise to fix EU MIGRATION PROVD THE issue will be an uphill battle for the prime minister. Yesterday, the incoming commission president said rules around the free movement of people could not be change.
Jean-Claude Jun cker’s dismissive assessment of David Cameron’s promise to fix EU migration proved the issue will be an uphill battle for the prime minister. Yesterday, the incoming Commission president said rules around the free movement of people could not be changed.
But the Conservative MP Edward Leigh said he thought the EU is desperate to keep Britain in, and there was a very good chance EU migration could be renegotiated. Responding to Mr Juncker’s remarks, a Downing
Street source said proposals would be brought forward before Christmas and deserved and would get a fair hearing.
but the EL SAID THAT he thought the EU IS DESPERATE to keep Britain in, and there was a very good chance EU migration could be renegociated. Responding to Mj’s REMARKS , a downing street source said proposals would be brought forward before Christmas and deserved and would get a fair hearinG.
At today’s summit, EU leaders will try and agree a target of cutting greenhouse gases by 40% by 2030. The prime minister is also expected to raise the issue of EU expenditure.
At TODAY’S SUMMIT, EU LEADERS WILL TRY AND AGREE A TARGET OF CUTTIG GREEN HOUSE GASES BY 4%BU 2030, THE PRIME MINISTER IS ALSO EXPECTED TO RAISE THE ISSUE OF eu EXPENDITURE.
This week, the European Parliament asked for a budget of 146bn euros next year, 6bn more than EU leaders agreed at an earlier summit. The final deal will be hammered out next month, but the government sources said the MEPs' bid was too high and unrealistic.
THE WEEK, THE EUROPEAN PALIAMENT ASKED FOR A BUDGET OF 146 EUROS NEXT YEAR, 6bn more than EU leaders AGREED AT AN EARLIER SUMMIT. THE FINLA DEAL WILL BE HAMMERED OUT NEXT MONTH, BUT THE GOERNMENT SOURCES SAID THE meps’ bid was too high and UNRELAISTIC.
What Are You Waiting For?
拖延症:你在磨蹭什么?
The Ninth Edition of The Concise Oxford Dictionary defines the word “procrastination” as to “defer action.” It further illuminates the semantic origins of the word as deriving from the Latin “crastinus”, meaning “tomorrow.” In other words, to defer taking timely action until tomorrow, or the day after, or next week, or just some later time.
第九版《简明牛津辞典》将“procrastination(拖延症)”定义为“延迟行动”,并进一步解释其语义词根来源于拉丁语“crastinus”,意为“明天”,即把应该及时采取的行动推迟到明天、后天、下周或者是之后的某一时刻。
Procrastination, we are taught from an early age, is a bad thing, and a habit to be steadfastly avoided. In school, it can lead to missing deadlines and lower marks, or worse. At work, it will make our boss and colleagues unhappy and could lose us a customer or promotion. At home, we’ll be scolded for such things as not tidying up on time.
按我们小时候接受的教育,拖延症是不好的,我们要坚决避免养成这个坏习惯。在学校里,拖延症会导致错过各种最后期限,成绩低下,甚至更糟的情况。上班后,拖延症会让老板和同事不爽,让我们丢掉客户或者晋升的机会。即使在家里,拖延症也会让我们受尽没有按时收拾房间之类的数落。
Despite all this teaching and the clearly negative consequences of procrastinating, we do it every day. The mind is a wonderful source of excuses and rationalizations which grease the wheels of our in-built Procrastinator App, producing lots of
reasons why we just can’t get to this or that project right at this moment. Some of those reasons are even valid.
尽管受了这么多教育,拖延症的恶果也再明显不过,但我们还是每天都会“犯病”。我们的头脑盛产各种借口和合理原因,润滑着我们内置的“拖延症App”,编织出无数不能即刻推进某个项目的理由,而且其中某些理由甚至还不无道理。Procrastination doesn’t only derive from laziness. After all, we’re busy. And it seems like we’re a lot busier than we used to be. The earth may not be spinning any faster, but our lifestyles and pace of work are, for better or for worse.
拖延症不仅源于懒惰。毕竟,我们都很忙,而且程度似乎较以往更甚。地球的自转也许并没有加快,但我们的生活方式和工作节奏的确都变得更加紧凑了,不管是好是坏吧。
The same dictionary defines “deadline” firstly as “a time limit for the completion of an activity”. It also gives a more historic definition of “deadline” in the context of prisons as: “a line beyond which prisoners were not allowed to go.” Presumably, the concept of the “deadline” in the prisons of yore was that if a prisoner crossed the “deadline”, that prisoner was going to be a dead one in a hurry.
对“deadline(最后期限)”一词,该《辞典》的基本释义是“完成某一活动的时间限制”,同时也给出了在监狱背景下的历史释义,即“犯人不能越过的线”。据推测,早期监狱里的“deadline”是犯人一旦越过该线,就会立刻被处死。
Having spent my career in editing and media, I’ve had a lifetime of living with deadlines. I’ve missed a fair share. I only just discovered the historic meaning of “deadline” in the prison context today. It’s a relief tha t the death penalty is not assigned to those who miss deadlines in the media context. I would not relish delivering or receiving that penalty.
我从事编辑和媒体工作多年,一辈子都在和deadline打交道,也错过了不少deadline。直到今天,我才发现这个词原本在监狱背景下的含义。幸好在媒体业,即使误了交稿期也不至于要处死。我可不想当这种审判官或是自己被判死刑。
I can just imagine a scene like this:
想象一下这样的场景:
Me: “Sorry, Rupert, this story was due yesterday.”
我:“很遗憾,鲁伯特,这篇稿子昨天就该交。”
Employee: “But Tom, I was busy with…”
雇员:“可是汤姆,昨天我很忙……”
Me: “Too bad!” BOOM. “So long, Rupert.” Another procrastinator bites the dust.我:“太差劲了!永别了,鲁伯特。”砰的一声,又一个拖延症患者倒地身亡。There are a range of important priorities for self-improvement in our careers and lifestyles, but few are more important than improving our time management skills. It’s a constant, ongoing challenge, but making progress pays great dividends in work and personal relationships, managing stress, and self-esteem.
在工作和生活中,我们有很多完善自我的当务之急,但都没有提高时间管理水平来得重要。这是一个永恒的、不间断的挑战,一旦加以完善,必然会给工作表现、个人关系、压力管理和个人评价带来极大的回报。
If you want to surprise a customer with great service — an internal one, such as a colleague, or an external one — then deliver a job or task ahead of the time it was promised or expected. If you make a habit of doing this, you will build a reputation for excellent service that will enhance your relationships and earn respect in a lasting way.
如果你想用杰出的服务给客户(既可以是内部的同事,也可以是外部的客人)带来惊喜,那就在承诺或预期的期限前完成工作吧。如果将此化作常态,你就会树立优质服务的口碑,改善人际关系,并赢得长久的尊重。
Managing your time more carefully requires clear thinking, focus, planning, and flexibility. Above all it depends on prioritizing, and revisiting those priorities as circumstances change. But it’s not rocket science.
更精细地管理你的时间,需要清晰的思路、着眼点、规划和灵活性。最重要的是,一切取决于优先度,以及伴随情况变化要适时作出调整,但这并不难。
Give it a try. Progress in this area might just be a life-saver!
不妨尝试一下。这项技能说不定还能救你一命呢!
Within academia, there's a raging de bate about…
在学术界,关于….的争论一直都很激烈
It can be argued that
Thanks to the advancement of technology and economy tied to education, an increasing number of educational approaches have been developed. Facing such a great deal of progressive teaching methods, nowadays traditional education mode became suspicious. Examination, a traditional teaching method, is suffering from criticism as some people believe that it has negative effects on students; however, people hold divergent views regarding this issue. Examinations have downsides and function imperfectly. Understandably, sitting an exam is not an impeccable way for teachers to examine students’ performance, and for learners to acquire and apply knowledge effectively. Apart from enormous pressure brought by taking exams, it may confront students with the feeling of failure. If, for instance, a student does not perform well in exams, the poor result, which could not reflect his other abilities such as creativity, but only memory, would depress him, thus misleading him.Furthermore, concentrating too much on examination, students tend to memorize concepts only and would risk learning nothing of much use in addressing problems in this real world.
Conceding that exams are the most effective methods to check up the extent to which students memorize the new knowledge, many people, nonetheless,argue that exams benefit students. Before using new ideas and concepts to deal with problems in the real world, a student ought to memorize the new knowledge so that he can get a framework first. Only with the conceptual frameworks already in position, would he be better able to utilize what he has learnt. Meanwhile, examinations enable teachers to examine students’ memorization of new ideas and concepts, and to help students enhance their weak parts of memorization.
Since examinations are only tools that help students to form the knowledge frameworks, I am convinced that learners should take appropriate exams along with practice.
雅思A类Task1图表作文实例(上)
You should spend about 20 minutes on this task. The graph below compares the number of visits to two new music sites on the web. Write a report for a university lecturer describing the information shown below. You should write at least 150 words. model answer: The graph shows people using new music places on the Internet in fifteen days period of time namely personal choice and trendy pop music. The overall trend shows fluctuation with slight Increased towards the end of the period. Starting with Music Choice websites; 40,000 poeple went on this new site on first-day. Half of them backed out the next day. In Contrast to this Pop Parade net sites were visited by 120,000 music lovers on day one which decreased slightly on the next day thereafter regaining the same fame on 3rd day. After 3rd day the enthusiasm for both music lines on Internet dropped slowly- reaching maximum fall of 40,000 on 7th day. Whereas Music choice gained popularity, slightly Improoving to get the original strength of 30,000 viewers on screen, but was getting still less visiters than their opponent Pop group i.e. 40,000 on day 7. In the biegining of the next week both gained remarkable recovery after a few fluctuations for
雅思写作Task1曲线图考官范文(5)
雅思写作Task1曲线图考官范文(5) 本文为大家收集整理了雅思写作Task1曲线图考官范文(5)。认真研读一定的雅思范文及作文模板可以帮助我们检验自己的写作水平,并能很好地吸收和应用优秀范文里的优秀内容。 The chart and graph below give information about sales and share prices for Coca-Cola. Write a report for a university lecturer describing the information shown below. Sample Answer: The given pie chart and line graphs show the data on sales volume and share price of Coca-Cola. As is given in the illustration, in the year 2000, Coca-Cola was sold most in America where it had more than 55% sales volume. The share price of Coca-Cola was highest in 1998 and reached to around 55 in 2001 with some fluctuation.
As is presented in the pie chart, in 2000, Coca-Cola had more than 55% sales in Latin and North America. In Europe it had more than 20% sales volume, in Asia 16.45% and in Africa it had 7% sales volume. This indicates that American continent has the largest market for Coca-Cola while this market is least in African Continent. Again, the share price of Coca-Cola was only $ 33 in 1996 and this price increased to $ 68 in 1997. The price reached to the highest in 1998 when it was $ 80 per share. The price then started dropping and with some fluctuations it reached it around $ 60 in 2001. In summary, the American Continent was the largest market for Coca-Cola in 2000 and the average share price of it is $60 though this price varies year to year. (Approximately 202 words)
雅思小作文地图题讲解
一个地图题的开头: The map about the development of the village sufficiently illustrates the way of progress of this area. In this map, we can find four main sectors and two main roads intersected with one railway and one motor way. It seems the overall development of this village has strong connection with the construction of roads. 雅思小作文地图题词汇 Part 1:表时间 流程图和地图题中都可能涉及时间表达。流程题中,使用较多的是过程时长的表述,而地图题的时间使用则体现为地理变迁的时间变化。一般在方位选址图题中较少出现。确切的时间指引,既增加文章的自然和连贯度,也能体现行文的精确性。 常见表示时间的词: in few hours几小时 during the period of …在…期间after 10 days 10天后 from…to从…到… between …and在…之间 over the…year period在一个…年期间5 years before 5年前a decade earlier几十年前from that moment on从那时起after a while一会 since自从 since then自从 finally最后 over the subsequent …years近连续几年 例句:The process lasts for up to 7 day s and the products are finally distributed to customers. Part 2:表空间 空间表达地图题出现概率较高,但流程图也偶尔出现。空间应该是地图题解题关键和主要特点。许多考生容易误把地图题的空间位置写成上下左右位置,这是失分点非常大的地方。朗阁海外考试研究中心的专家们提示烤鸭,空间表达时需要注意区分:在空间状语里,in表内部,on表接壤,to表分开。 常用的空间词: lies 靠近
雅思图表作文TASK1精讲精练
雅思图表作文TASK1精讲精练
雅思图表作文TASK1精讲精练 A理论部分: 雅思小作文概论 1、文章结构:主要分三部分:i。introductory sentence;ii。body paragraph;iii。Concluding sentence 具体讲:第一段introductory sentence只要写一句话,交待图形(如the line graph, pie chart等等),描述对象(如图表描述的是the number of tourists visiting England),地点(如the US, the UK等)以及时间(如between 1988 and 1997等等);另外要注意的就是第一段不能和图表上方已给的句子太过相似!否则,会失分的! 第二部分一般写1~3段,这要视情况而定。这部分主要就是对比不同的数据,如相似或相同的数据;某个数据是另一个数据的2倍;某个数据所占比例最大或最小等等。 最后一段concluding sentence也只要写一句话,
主要是总结图表的整个趋势。 2。文章的效果。很多学生会发现小作文的例文特别简单(特别是剑桥书里提供的)。原因很简单,这个report的目的就是要让university lecturer了解某个事物的发展趋势,因此写出来的文章必须结构清晰、易懂,绝对不能太复杂,也不要把每个数据都描写出来,只要描写有代表性的,重要的数据即可。 以下为雅思小作文的四个基本步骤 第一步:改写题目 经过同义词转换在短短的1分钟内就写好作文的第一段。 举例:The graph below shows the percentage of people unable to find work in three major countries from 1983 to 1992. 题目中划线的单词都能够进行同义转换: graph—figure, show—illustrate, percentage—proportion, major—key, from…to…—between…and…, 第二步:分析时态
雅思写作Task 1数据类图表之六种常见变化趋势分析
雅思写作Task1数据类图表 之六种常见变化趋势分析 雅思写作考试分为Task1和Task2两个部分,其中Task1这个部分主要考察考生对各种图表的主要特征和情况的客观概述能力。这些图表主要分成两种类型:数据类和图画类。其中数据类图表(线形图、饼状图、柱状图、表格)是出现频率相对较高的一种类型,因此也就是Task1的考察重点。这种图表表现形式多样,尤其是数据类型及变化繁杂,常常让考生望图生畏。针对这一难题,本文中,留学无忧的老师将总结数据类图表中常见的六种数据变化的趋势,帮助广大考生拨开迷雾。 一、上升/增长 上图描绘了英国本地固话、国内及国际固话和移动通讯的通话时长从1995年到2002年的变化情况。观察其中“National and International-fixed line”即国内及国际固话通话时长从1995年至2002年的变化,发现其数据整体呈现稳步增长这一趋势,虽然在最后两年其增长幅度明显放缓: National and international fixed line calls grew steadily from1995to2002, though the growth slowed over the last two years.
除了例句中的grew(grow v.)表示增长,还有increase/climb/ascend/rise/mount/ go up等表达。在表达增长幅度放缓时用到了“稳步地”、“缓慢地”这一类副词,除了steadily,还有gradually,slowly,mildly,moderately等。 二、下降/减少 上图描绘了从1979年到2004年鱼肉、羊肉、牛肉和鸡肉的消耗情况。观察其中“Beef”、“Lamb”的销量变化,即从1979年至2004年它们数值的变化,发现其数据整体都呈现急剧下降这一趋势: Between1979and2004,the consumption of beef and lamb fell dramatically. 除了例句中的fell(fall v.)表示下降,还有decrease/go down/drop/fall/descend/ decline等表达。在表达急剧下降时用到了“急剧地”这一类副词,除了dramatically,还有drastically/steeply等。当然这种情况也可以用到“显著地”这类副词,有considerably/ significantly/remarkably/markedly/notably/noticeably等。 三、持平/不变
雅思写作Task1曲线图考官范文(1)
雅思写作Task1曲线图考官范文(1) 这是一篇雅思写作Task1曲线图考官范文。认真研读一定的雅思范文及作文模板可以帮助我们检验自己的写作水平,并能很好地吸收和应用优秀范文里的优秀内容。 The graphs below show the numbers of male and female workers in 1975 and 1995 in several employment sectors of the republic of Freedonia. Write a report for a university teacher describing the information shown.
Sample Answer: The provided line graphs compare the employment history of men and women in 1975 and 1995 dividing in six major sectors namely: manufacturing, communications, finance/ banking, wholesale & retail trade, non-defence public sectors and defence public sectors. As is observed from the given illustration, significant changes have been made in women's employment and women appear to have made remarkable improvements in almost the entire job sectors in Freedonia and in some sectors women went well ahead of men. Initially in 1975, men were notably ahead of women in every sector of employment. For example, in communication sector about 260 men worked against 220 women in every thousand employees. Twenty years later, though the number of men remained unchanged, the number of women rose to over 550 in one thousand. A similar trend can be seen in the wholesale and retail trade sector, where the number of women rose from about 550 to almost 800 in every 1000 employees of this sector two decades later. The number of men in this sector remained stable over the period, at around 700 / thousand.
雅思写作task1官方评分标准
IELTS Task 1 Writing band descriptors (public version) Band Task Achievement Coherence and Cohesion Lexical Resource Grammatical Range and Accuracy 9 fully satisfies all the requirements of the task clearly presents a fully developed response uses cohesion in such a way that it attracts no attention skilfully manages paragraphing uses a wide range of vocabulary with very natural and sophisticated control of lexical features; rare minor errors occur only as ‘slips’ uses a wide range of structures with full flexibility and accuracy; rare minor errors occur only as ‘slips’ 8 covers all requirements of the task sufficiently presents, highlights and illustrates key features / bullet points clearly and appropriately sequences information and ideas logically manages all aspects of cohesion well uses paragraphing sufficiently and appropriately uses a wide range of vocabulary fluently and flexibly to convey precise meanings skilfully uses uncommon lexical items but there may be occasional inaccuracies in word choice and collocation produces rare errors in spelling and/or word formation uses a wide range of structures the majority of sentences are error-free makes only very occasional errors or inappropriacies 7 covers the requirements of the task (Academic) presents a clear overview of main trends, differences or stages (General Training) presents a clear purpose, with the tone consistent and appropriate clearly presents and highlights key features / bullet points but could be more fully extended logically organises information and ideas; there is clear progression throughout uses a range of cohesive devices appropriately although there may be some under-/over-use uses a sufficient range of vocabulary to allow some flexibility and precision uses less common lexical items with some awareness of style and collocation may produce occasional errors in word choice, spelling and/or word formation uses a variety of complex structures produces frequent error-free sentences has good control of grammar and punctuation but may make a few errors 6 addresses the requirements of the task (Academic) presents an overview with information appropriately selected (General Training) presents a purpose that is generally clear; there may be inconsistencies in tone presents and adequately highlights key features / bullet points but details may be irrelevant, inappropriate or inaccurate arranges information and ideas coherently and there is a clear overall progression uses cohesive devices effectively, but cohesion within and/or between sentences may be faulty or mechanical may not always use referencing clearly or appropriately uses an adequate range of vocabulary for the task attempts to use less common vocabulary but with some inaccuracy makes some errors in spelling and/or word formation, but they do not impede communication uses a mix of simple and complex sentence forms makes some errors in grammar and punctuation but they rarely reduce communication
雅思流程图写作指引
流程图 流程图6点参考要领: 1. 找到流程图的过程,起点,终点。 2. 找到图上标出的已知动作,如果出现生词,尽量猜测。无词,用自己的语言。 3. 按照步骤,分段描述,千万不能省略任何一步。 4. 切记!加入流畅合理的表示顺序的关联词。 5. 句型以主动为主,搭配被动,以及主语从句(例如:It can be seen from the graph that…)。 6. 时态要使用一般现在时。 例文分析1: The diagram shows the stages in the process of making chocolate.(所有的小作文第一句话都要用一般现在时。流程图必备三个词:process整个过程;stage阶段;step步骤)
Chocolate comes from the cacao tree, which is grown in parts of South America, Africa and Indonesia.(开头不能一上来就直接介绍cacao tree,而是通过主题词chocolate 引出,否则显得太唐突)【流程图特点之一:介绍过程要使用一般现在时】【流程图特点之二:大量使用定语从句,将有关联的两句话连接。】【流程图特点之三:大量使用被动语态】The tree produces large red pods which contain white cocoa beans.【流程图特点之四:使用一些表示顺序的连接词】when the pods are ripe, they are harvested, the beans are removed and they are fermented for several days in large wooden boxes.(三个句子的并列:“句子A,句子B and 句子C”。)During the fermenting process, the beans turn brown.【流程图特点之五:要适当地添加个别图中没有交代但能从图片中直接读出来的一些内容,否则可能达不到字数要求。但是一定要把握尺度,千万不要加上自己的主观观点,否则会扣分】 Next, the brown beans are spread in the sun to dry. They are then put in large sacks and transported by train or lorry. After this, the beans are taken to a chocolate factory where they are roasted in an oven at temperatures of between 250 and 350 degree Celsius. After being roasted, the beans are crushed and the outer shell is removed. This part is not needed for making chocolate. Finally, the inner part of the bean is pressed and liquid chocolate is produced.【流程图特点之六:一般不需要写总结】 例文分析2:
雅思小作文折线图
Writing task one: single line graph You will be given a graph with a single line. Your task is to write a 150 word report to describe the information given in the graph. You are not asked to give your opinion. You should spend around twenty minutes on the task. Task one is not worth as many marks as task two and so you should make sure that you keep within the recommended twenty minute time frame. What is being tested is your ability to: ?objectively describe the information given to you ?report on a topic without the use of opinion ?use suitable language to describe the graph Sample task You should spend about 20 minutes on this task. Write a report for a university lecturer describing the information in the graph below. Write at least 150 words. When you’ve f inished the task How good is your answer? Check the guidelines bellow and read the sample answer. Guidelines for a good answer Does the report have a suitable structure? ?Does it have an introduction, body and conclusion? ?Does it include connective words to make the writing cohesive within sentences and paragraphs? Does the report use suitable grammar and vocabulary? ?Does it include a variety of sentence structures? ?Does it include a range of appropriate vocabulary? Does the report meet the requirements of the task? ?Does it meet the word limit requirements? ?Does it describe the whole graph adequately? ?Does it focus on the important trends presented in the graphic information? Sample answer The graph shows the number of cases of X disease in Someland between the years 1960 and 1995. As an overall trend, it is clear that the number of cases of the disease increased fairly rapidly until the mid seventies, remained constant for around a decade at 500 cases before dropping to zero in the late 80s.
IELTS—Writing第三课时—地图、流程图
IELTS图表作文讲解:地图、流程图 学生面授老师 时间本次课时IELTS写作第三课时 教学思路1. 作文简介、写作技巧 2. 实例讲解 3. 分析总结 4. 课后作业 教学目标1. 地图、流程图理论分析分析 2. 掌握两类图表作文的基本特征和写作方法 3. 学习写作思路 讲解重点地图、流程图写作方法范文学习 常用句式总结 备考资料剑桥基础资料 教学详细内容: 一、分析雅思图表作文—地图、流程图理论 1. 地图题特点 地图题分两种,一种为地理变迁题,一种为选址题。地理变迁题描述的是一个地方(多为一个城镇)在一段时间的发展变化。 时态:地图题反映的是一个地方在过去的一段时间的变化,文章用一般过去时。如果地图题反映的是一个地方在将来一段时间的变化趋势,文章用一般将来时或表“估计”的词汇。如果地图题反映的是一个地方从过去到现在的变化,可用现完成时。 细节变化:地图每个细节变化都要提到,不要忽视一个细节 语态:地图题用被动语态 2.流程图(flow chart)特点 其一,流程图的题目基本不会重复,因此复习已经考过的题目不会太大效果, 第二,流程图的词汇随着图表的对象而变化,很少出现重复的词汇。 流程图考察的次数不多,每年大概3-5次,集中出现在年初和年末的三个月。 一般来说,流程图和普通图表的区别主要在于:
流程图基本上不会出现数据,文字信息占主要地位 流程图以描述为主,比较的机会比图表题少 流程图中出现的信息都需要描述,而普通图表则不需要描述每一个数据 流程图的时态比较单一,主要是用一般现在时 流程图的分段比较灵活,只要不同阶段之间的差距很明显,就可以另起一段 3. 流程图备考注意事项: 1)注意掌握段落连接或者不同阶段之间的说法(sequence expression) 表示首阶段的一些说法 a)The process starts from b)At the first/initial stage, c)At the beginning of the cycle, d)During the initial phase, e)The beginning of the whole cycle is marked by f)(名词 or 动名词)is the first step in (+ 名词 or 动名词) 表示次段的一些说法: a)The second stage is b)The next step in the process is 表示最后阶段的一些说法 a)(名词 or 动名词) is the last step in the procedure. b)The final phase of the procedure is about c)In the final phase, d)Entering the final phase, e)(名词 or 动名词) is the final stage. 2)要注意各个阶段的比较,充实文章内容,避免平铺直叙 3)注意流程图的读图顺序: 找出流程图的始末点,并划分中间的步骤或阶段;掌握表示“顺序”的连接词(Sequencing Words),用来说明过程的各个步骤和先后顺序。
雅思小作文折线图
雅思小作文折线图
雅思小作文折线图 Pleasure Group Office【T985AB-B866SYT-B182C-BS682T-STT18】
Writing task one: single line graph You will be given a graph with a single line. Your task is to write a 150 word report to describe the information given in the graph. You are not asked to give your opinion. You should spend around twenty minutes on the task. Task one is not worth as many marks as task two and so you should make sure that you keep within the recommended twenty minute time frame. What is being tested is your ability to: ?objectively describe the information given to you ?report on a topic without the use of opinion ?use suitable language to describe the graph Sample task You should spend about 20 minutes on this task. Write a report for a university lecturer describing the information in the graph below. Write at least 150 words. When you’ve finished the task How good is your answer Check the guidelines bellow and read the sample answer. Guidelines for a good answer Does the report have a suitable structure ?Does it have an introduction, body and conclusion ?Does it include connective words to make the writing cohesive within sentences and paragraphs Does the report use suitable grammar and vocabulary ?Does it include a variety of sentence structures ?Does it include a range of appropriate vocabulary Does the report meet the requirements of the task ?Does it meet the word limit requirements ?Does it describe the whole graph adequately ?Does it focus on the important trends presented in the graphic information Sample answer The graph shows the number of cases of X disease in Someland between the years 1960 and 1995. As an overall trend, it is clear that the number of cases of the disease increased fairly rapidly until the mid seventies, remained constant for around a decade at 500 cases before dropping to zero in the late 80s.In 1960, the number of cases stood
雅思作文写作Task-1第二课时—柱状图和饼状图
图表作文讲解2:柱状图和饼状图
分析思路: 1.第一幅柱状图的描述单位是百万,即人数;第二幅则是百分比。 2.第二幅柱状图仅显示了1970年和2000年的信息,而第一幅柱状图显示了1970、1980、 1990、2000年的信息。 3.由第一幅柱状图可以看出,从1980年到2000年,结婚人数和离婚人数的变化趋势相似。 4.从第二幅图可以看出,在2000年,结婚和寡居的成年人的比例有所降低而从未结婚过 和离婚的比例则有所上升。 文分析 One chart①shows the number of marriages and divorces in the USA in 1970, 1980, 1990 and 2000.The other②shows the marital status of adult Americans in 1970 and 2000. 首段概述图表信息,对题目进行改写,注意动词的用法和时态。 ?描述类的常用词有:show/describe/illustrate/demonstrate/indicate;
分析思路 1.四个饼状图可以分为两组,一组是澳大利亚,一组是法国; 2.饼状图由五部分组成:coal, oil, natural gas, hydro power, nuclear power; 3.图中的时间是1980年和2000年 4.单位是units 文分析 The charts①compare the sources of electricity in Australia and France in the years 1980 and 2000. Between these years electricity production almost②doubled, ③rising from 100 units to 170 in Australia, and from 90 to 180 units in France. ①对比:compare ②翻番:double ③从多少增长到多少:rise from……to…… In 1980 Australia used coal as the main electricity source (50 units) and the①remainder was produced from natural gas, hydro power (each producing 20 units) and oil (which produced only 10 units). By 2000, coal had become the fuel for more than 75% of electricity produced and only hydro②continued to be another significant
雅思写作Task1的评分标准详解
雅思写作Task1的评分标准详解 雅思写作的TASK1的评分标准是什么?具体有什么要求?文都国际教育小编为大家整理了一些雅思备考的资料。想提高雅思考试成绩的同学一起来看看吧! 一、Task Achievement 1.Fully satisfies all the requirements of the task 标准解读: 考生在写作时首先要仔细阅读题干,读懂题目要求。小作文标题一般分两句话,第一句话介绍图表内容,第二句话提出要求。一般要求都是:Summarise the information by selecting and reporting the main features, and make comparisons where relevant. 也就是说,写作时要做到两点:选择并总结出表格的主要特征,同时进行适当的比较分析。考生如果只是列出一些图表信息,而不进行适当分析的话,则无法获得高分。 2. clearly presents a fully developed response 标准解读: (1)完整、有逻辑地谋篇布局。 (2)写作目的清晰。 (3)主要内容完整、切题、正确、有理有据: 考生要能自然地展开论述,善始善终地表达观点、陈述事实。所举论据能很好的支持论点。 二、Coherence and Cohesion 1. uses cohesion in such a way that it attracts no attention 标准解读: 好文章的最高境界就是:“连贯得让人没有感觉”。也就是说不刻意用连接词,不滥用模板句和过渡句, 而做到句与句之间逻辑清晰,语意连贯,连接词和短语的运用信手拈来,整个文章浑然一体。 文章的连贯要注意以下几个问题: (1)段落衔接自然。 (2)论证时注意思路清晰,过渡自然。好文章是由思想编织的。 (3)适当运用连接词。对于雅思小作文写作来说,使用连接词的目的是为了更强大的逻辑引导和语气强调。