2011i世界学人类发展指数排名
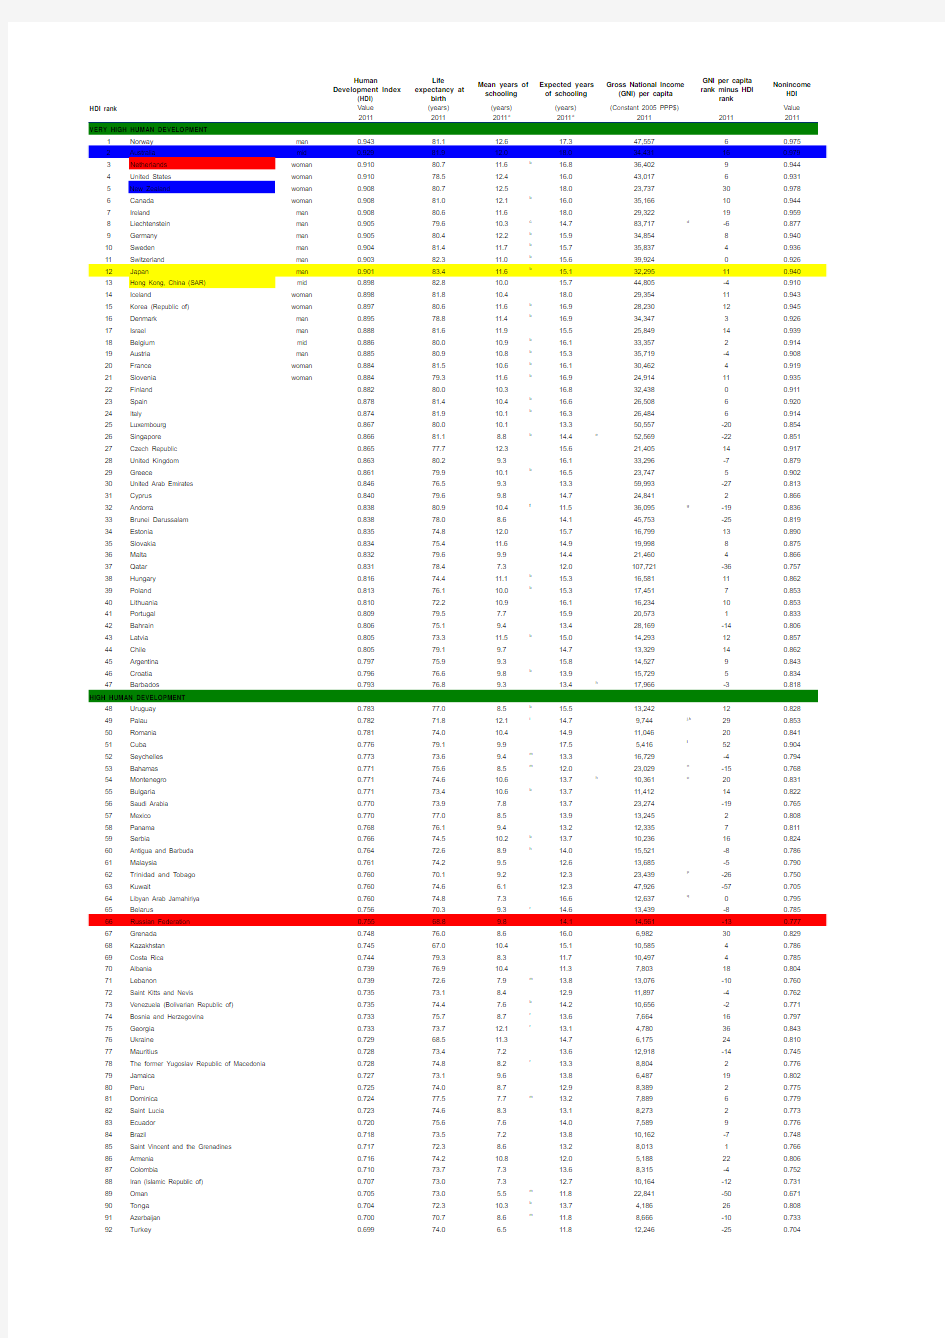

Human Development Index
(HDI)
Life
expectancy at
birth
Mean years of
schooling
Expected years
of schooling
Gross National Income
(GNI) per capita
GNI per capita
rank minus HDI
rank
Nonincome
HDI
HDI rank Value(years)(years)(years)(Constant 2005 PPP$)Value
a a
1Norway man0.94381.112.617.347,55760.975 2Australia mid0.92981.912.018.034,431160.979 3Netherlands woman0.91080.711.6b16.836,40290.944 4United States woman0.91078.512.416.043,01760.931 5New Zealand woman0.90880.712.518.023,737300.978 6Canada woman0.90881.012.1b16.035,166100.944 7Ireland man0.90880.611.618.029,322190.959 8Liechtenstein man0.90579.610.3c14.783,717d-60.877 9Germany man0.90580.412.2b15.934,85480.940 10Sweden man0.90481.411.7b15.735,83740.936 11Switzerland man0.90382.311.0b15.639,92400.926 12Japan man0.90183.411.6b15.132,295110.940 13Hong Kong, China (SAR)mid0.89882.810.015.744,805-40.910 14Iceland woman0.89881.810.418.029,354110.943 15Korea (Republic of)woman0.89780.611.6b16.928,230120.945 16Denmark man0.89578.811.4b16.934,34730.926 17Israel man0.88881.611.915.525,849140.939 18Belgium mid0.88680.010.9b16.133,35720.914 19Austria man0.88580.910.8b15.335,719-40.908 20France woman0.88481.510.6b16.130,46240.919 21Slovenia woman0.88479.311.6b16.924,914110.935 22Finland0.88280.010.316.832,43800.911 23Spain0.87881.410.4b16.626,50860.920 24Italy0.87481.910.1b16.326,48460.914 25Luxembourg0.86780.010.113.350,557-200.854 26Singapore0.86681.18.8b14.4e52,569-220.851 27Czech Republic0.86577.712.315.621,405140.917 28United Kingdom0.86380.29.316.133,296-70.879 29Greece0.86179.910.1b16.523,74750.902 30United Arab Emirates0.84676.59.313.359,993-270.813 31Cyprus0.84079.69.814.724,84120.866 32Andorra0.83880.910.4f11.536,095g-190.836 33Brunei Darussalam0.83878.08.614.145,753-250.819 34Estonia0.83574.812.015.716,799130.890 35Slovakia0.83475.411.614.919,99880.875 36Malta0.83279.69.914.421,46040.866 37Qatar0.83178.47.312.0107,721-360.757 38Hungary0.81674.411.1b15.316,581110.862 39Poland0.81376.110.0b15.317,45170.853 40Lithuania0.81072.210.916.116,234100.853 41Portugal0.80979.57.715.920,57310.833 42Bahrain0.80675.19.413.428,169-140.806 43Latvia0.80573.311.5b15.014,293120.857 44Chile0.80579.19.714.713,329140.862 45Argentina0.79775.99.315.814,52790.843 46Croatia0.79676.69.8b13.915,72950.834 47Barbados0.79376.89.313.4h17,966-30.818
48Uruguay0.78377.08.5b15.513,242120.828 49Palau0.78271.812.1i14.79,744j,k290.853 50Romania0.78174.010.414.911,046200.841 51Cuba0.77679.19.917.55,416l520.904 52Seychelles0.77373.69.4m13.316,729-40.794 53Bahamas0.77175.68.5m12.023,029n-150.768 54Montenegro0.77174.610.613.7h10,361o200.831 55Bulgaria0.77173.410.6b13.711,412140.822 56Saudi Arabia0.77073.97.813.723,274-190.765 57Mexico0.77077.08.513.913,24520.808 58Panama0.76876.19.413.212,33570.811 59Serbia0.76674.510.2b13.710,236160.824 60Antigua and Barbuda0.76472.68.9h14.015,521-80.786 61Malaysia0.76174.29.512.613,685-50.790 62Trinidad and Tobago0.76070.19.212.323,439p-260.750 63Kuwait0.76074.6 6.112.347,926-570.705 64Libyan Arab Jamahiriya0.76074.87.316.612,637q00.795 65Belarus0.75670.39.3r14.613,439-80.785 66Russian Federation0.75568.89.814.114,561-130.777 67Grenada0.74876.08.616.06,982300.829 68Kazakhstan0.74567.010.415.110,58540.786 69Costa Rica0.74479.38.311.710,49740.785 70Albania0.73976.910.411.37,803180.804 71Lebanon0.73972.67.9m13.813,076-100.760 72Saint Kitts and Nevis0.73573.18.412.911,897-40.762 73Venezuela (Bolivarian Republic of)0.73574.47.6b14.210,656-20.771 74Bosnia and Herzegovina0.73375.78.7r13.67,664160.797 75Georgia0.73373.712.1r13.14,780360.843 76Ukraine0.72968.511.314.76,175240.810 77Mauritius0.72873.47.213.612,918-140.745 78The former Yugoslav Republic of Macedonia0.72874.88.2r13.38,80420.776 79Jamaica0.72773.19.613.86,487190.802 80Peru0.72574.08.712.98,38920.775 81Dominica0.72477.57.7m13.27,88960.779 82Saint Lucia0.72374.68.313.18,27320.773 83Ecuador0.72075.67.614.07,58990.776 84Brazil0.71873.57.213.810,162-70.748 85Saint Vincent and the Grenadines0.71772.38.613.28,01310.766 86Armenia0.71674.210.812.05,188220.806 87Colombia0.71073.77.313.68,315-40.752 88Iran (Islamic Republic of)0.70773.07.312.710,164-120.731 89Oman0.70573.0 5.5m11.822,841-500.671 90Tonga0.70472.310.3b13.74,186260.808 91Azerbaijan0.70070.78.6m11.88,666-100.733 92Turkey0.69974.0 6.511.812,246-250.704 HIGH HUMAN DEVELOPMENT
93Belize0.69976.18.0b12.45,81290.766 94Tunisia0.69874.5 6.514.57,28120.745 MEDIUM HUMAN DEVELOPMENT
95Jordan0.69873.48.613.15,30090.773 96Algeria0.69873.17.013.67,658-50.739 97Sri Lanka0.69174.98.212.74,943120.768 98Dominican Republic0.68973.47.2b11.98,087-130.720 99Samoa0.68872.410.3m12.33,931s220.788 100Fiji0.68869.210.7b13.04,145180.781 101China0.68773.57.511.67,476-70.725 102Turkmenistan0.68665.09.9i12.5h7,306-70.724 103Thailand0.68274.1 6.612.37,694-140.714 104Suriname0.68070.67.2r12.67,538-110.712 105El Salvador0.67472.27.512.15,925-40.724 106Gabon0.67462.77.513.112,249-400.667 107Paraguay0.66572.57.712.14,72750.729 108Bolivia (Plurinational State of)0.66366.69.213.74,054110.742 109Maldives0.66176.8 5.8b12.45,276-30.714 110Mongolia0.65368.58.314.13,391170.743 111Moldova (Republic of)0.64969.39.711.93,058210.746 112Philippines0.64468.78.9b11.93,478110.725 113Egypt0.64473.2 6.411.05,269-60.686 114Occupied Palestinian Territory0.64172.88.0m12.72,656k,t230.750 115Uzbekistan0.64168.310.0r11.42,967190.736 116Micronesia (Federated States of)0.63669.08.8i12.1u2,935v190.729 117Guyana0.63369.98.011.93,192110.715 118Botswana0.63353.28.912.213,049-560.602 119Syrian Arab Republic0.63275.9 5.7b11.34,243-50.686 120Namibia0.62562.57.411.66,206-210.643 121Honduras0.62573.1 6.511.43,44340.694 122Kiribati0.62468.17.812.13,14080.701 123South Africa0.61952.88.5b13.19,469-440.604 124Indonesia0.61769.4 5.813.23,716-20.674 125Vanuatu0.61771.0 6.710.43,950-50.668 126Kyrgyzstan0.61567.79.312.52,036190.734 127Tajikistan0.60767.59.811.41,937200.726 128Viet Nam0.59375.2 5.510.42,80580.662 129Nicaragua0.58974.0 5.810.82,430100.669 130Morocco0.58272.2 4.410.34,196-150.606 131Guatemala0.57471.2 4.110.64,167-140.595 132Iraq0.57369.0 5.69.83,177-30.616 133Cape Verde0.56874.2 3.5i11.63,402-70.603 134India0.54765.4 4.410.33,468-100.568 135Ghana0.54164.27.110.51,584200.633 136Equatorial Guinea0.53751.1 5.4r7.717,608-910.458 137Congo0.53357.4 5.910.53,066-60.555 138Lao People's Democratic Republic0.52467.5 4.69.22,24240.569 139Cambodia0.52363.1 5.89.81,848110.584 140Swaziland0.52248.77.110.64,484-270.512 141Bhutan0.52267.2 2.3r11.05,293-360.500 LOW HUMAN DEVELOPMENT
142Solomon Islands0.51067.9 4.5i9.11,782100.567 143Kenya0.50957.17.011.01,492150.584 144Sao Tome and Principe0.50964.7 4.2i10.81,79270.564 145Pakistan0.50465.4 4.9 6.92,550-70.526 146Bangladesh0.50068.9 4.88.11,529110.566 147Timor-Leste0.49562.5 2.8i11.23,005-140.499 148Angola0.48651.1 4.4r9.14,874-380.455 149Myanmar0.48365.2 4.09.21,53570.536 150Cameroon0.48251.6 5.910.32,031-40.509 151Madagascar0.48066.7 5.2i10.7824260.605 152Tanzania (United Republic of)0.46658.2 5.19.11,328100.523 153Papua New Guinea0.46662.8 4.3 5.82,271-120.475 154Yemen0.46265.5 2.58.62,213-110.471 155Senegal0.45959.3 4.57.51,708-20.488 156Nigeria0.45951.9 5.0r8.92,069-120.471 157Nepal0.45868.8 3.28.81,16080.524 158Haiti0.45462.1 4.97.6u1,123120.520 159Mauritania0.45358.6 3.78.11,859-100.472 160Lesotho0.45048.2 5.9b9.91,664-60.475 161Uganda0.44654.1 4.710.81,12470.506 162Togo0.43557.1 5.39.6798160.526 163Comoros0.43361.1 2.8i10.71,07990.488 164Zambia0.43049.0 6.57.91,25400.469 165Djibouti0.43057.9 3.8r 5.12,335-250.420 166Rwanda0.42955.4 3.311.11,13310.477 167Benin0.42756.1 3.39.21,364-60.456 168Gambia0.42058.5 2.89.01,282-50.450 169Sudan0.40861.5 3.1 4.41,894-210.402 170C?te d'Ivoire0.40055.4 3.3 6.31,387p-100.412 171Malawi0.40054.2 4.28.975380.470 172Afghanistan0.39848.7 3.39.11,416-130.407 173Zimbabwe0.37651.47.29.9376n110.529 174Ethiopia0.36359.3 1.5i8.597100.383 175Mali0.35951.4 2.0b8.31,123-60.366 176Guinea-Bissau0.35348.1 2.3r9.1994-30.366 177Eritrea0.34961.6 3.4 4.853660.421 178Guinea0.34454.1 1.6w8.6863-20.364 179Central African Republic0.34348.4 3.5 6.670720.379 180Sierra Leone0.33647.8 2.97.273700.365 181Burkina Faso0.33155.4 1.3r 6.31,141-150.323 182Liberia0.32956.8 3.911.026550.504 183Chad0.32849.6 1.5i7.21,105-120.320 184Mozambique0.32250.2 1.29.2898-90.325 185Burundi0.31650.4 2.710.536800.412 186Niger0.29554.7 1.4 4.9641-40.311 187Congo (Democratic Republic of the)0.28648.4 3.58.2280-10.399 OTHER COUNTRIES OR TERRITORIES
..Korea (Democratic People's Rep. of)..68.8..........
..Marshall Islands..72.09.8i10.8....0.752 ..Monaco..82.2..17.5......
..Nauru..79.9..9.3......
..San Marino..81.8..........
..Somalia..51.2.. 2.4......
..Tuvalu..67.2..10.8......
HDI groupings
Very high human development0.88980.011.315.933,352—0.918 High human development0.74173.18.513.611,579—0.769 Medium human development0.63069.7 6.311.25,276—0.658 Low human development0.45658.7 4.28.31,585—0.478
Regions
Arab States0.64170.5 5.910.28,554—0.643 East Asia and the Pacific0.67172.47.211.76,466—0.709 Europe and Central Asia0.75171.39.713.412,004—0.785 Latin America and the Caribbean0.73174.47.813.610,119—0.767 South Asia0.54865.9 4.69.83,435—0.569 Sub-Saharan Africa0.46354.4 4.59.21,966—0.467
Least developed countries0.43959.1 3.78.31,327—0.467 Small island developing states0.64069.67.310.85,200—0.675
World0.68269.87.411.310,082—0.683
NOTES
a. Data refer to 2011 or the most recent year available.
b. Updated by HDRO based on UNESCO (2011) data.
c. Assumes the same adult mean years of schooling as Switzerland before the most recent update.
d. Estimated using the purchasing power parity (PPP) and projected growth rate of Switzerland.
e. Calculated by the Singapore Ministry of Education.
f. Assumes the same adult mean years of schooling as Spain before the most recent update.
g. Estimated using the PPP and projected growth rate of Spain.
h. Based on cross-country regression.
i. Based on data on years of schooling of adults from household surveys from World Bank (2010).
j. Based on UNESCAP (2011) and UNDESA (2011) projected growth rates.
k. Based on unpublished estimates from the World Bank.
l. PPP estimate based on cross-country regression; projected growth rate based on ECLAC (2011) and UNDESA (2011) projected growth rates.
m. Based on UNESCO (2011) estimates of education attainment distribution.
n. Based on PPP data from IMF (2011).
o. Based on EBRD (2011) and UNDESA (2011) projected growth rates.
p. Based on World Bank (2011b).
q. Based on OECD and others (2011) and UNDESA (2011) projected growth rates.
r. Based on data from UNICEF (2000–2010).
s. Based on ADB (2011) projected growth rate.
t. Based on UNESCWA (2011) and UNDESA (2011) projected growth rates.