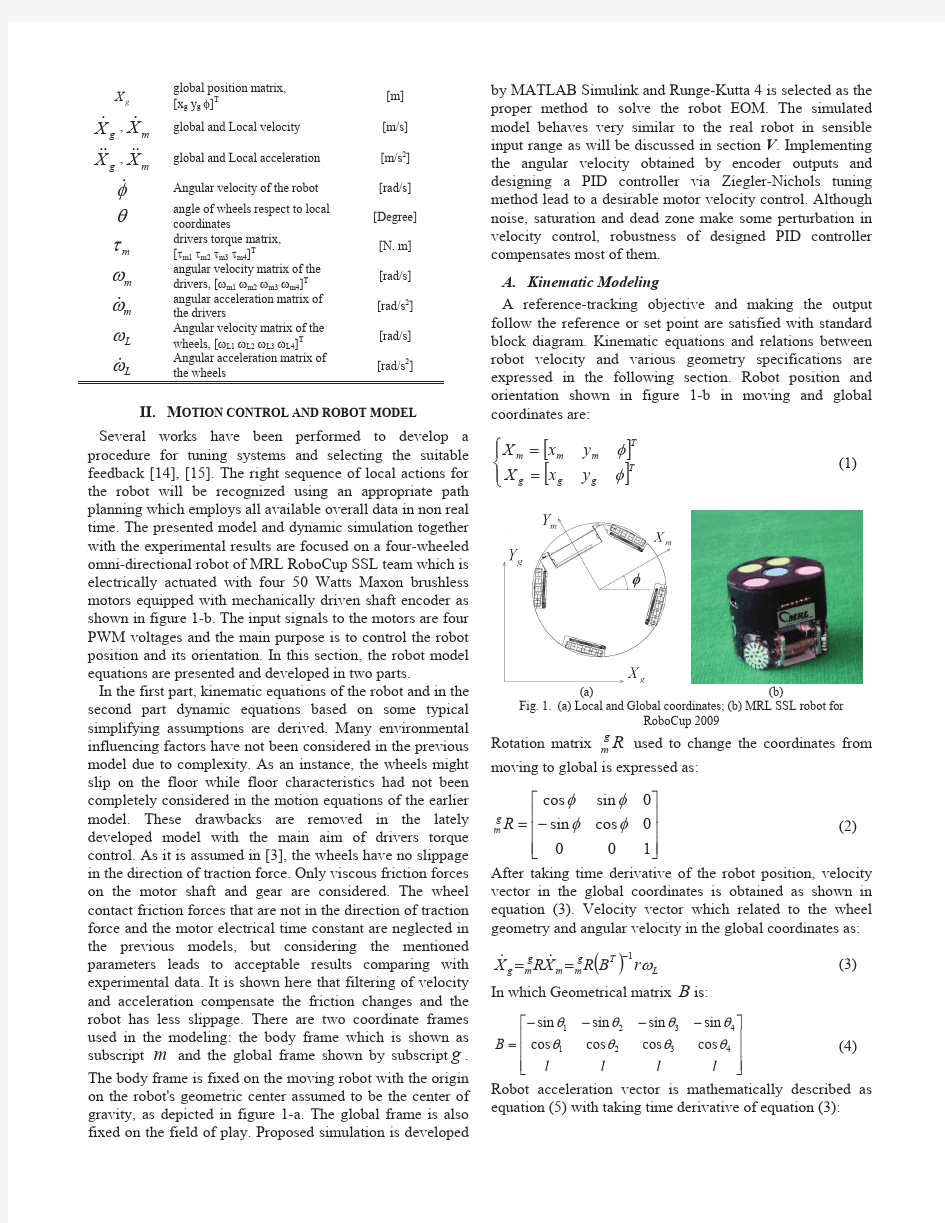
Trajectory Planning Optimization with Dynamic Modeling of Four Wheeled Omni-Directional Mobile Rob
RGB - D斯拉姆数据集和基准(RGB-D SLAM Dataset and Benchmark)
RGB - D斯拉姆数据集和基准(RGB-D SLAM Dataset and Benchmark) 数据介绍: We provide a large dataset containing RGB-D data and ground-truth data with the goal to establish a novel benchmark for the evaluation of visual odometry and visual SLAM systems. Our dataset contains the color and depth images of a Microsoft Kinect sensor along the ground-truth trajectory of the sensor. The data was recorded at full frame rate (30 Hz) and sensor resolution (640×480). The ground-truth trajectory was obtained from a high-accuracy motion-capture system with eight high-speed tracking cameras (100 Hz). Further, we provide the accelerometer data from the Kinect. Finally, we propose an evaluation criterion for measuring the quality of the estimated camera trajectory of visual SLAM systems. 关键词: RGB-D,地面实况,基准,测程,轨迹, RGB-D,ground-truth,benchmark,odometry,trajectory, 数据格式: IMAGE
基于采样的在轨服务航天器轨迹规划研究
Abstract The trajectory planning of spacecraft near-distance motion is a core technology of spacecraft's autonomous orbit service, its difficulty lies in its autonomy and real-time. Aiming at the trajectory planning of the small thrust spacecraft tracking the non -cooperative target, the autonomous trajectory planning of the spacecraft can be realized by using the sampling planning method. According to the order of the basic algorithm and the practical application, this paper studies the trajectory planning problem of the orbit service spacecraft for the impulse thrust and the continuous thrust respectively. Mainly includes the following research content: Firstly, the classical rapidly-exploring Random tree* (RRT*) algorithm has been introduced briefly, and its limitations have been analyzed. On this basis, through the improvement of the original algorithm in search mode, sampling strategy, measurement function and cost function, an improved RRT* algorithm with higher computational efficiency and better optimization has been presented, and the probability completeness, fast convergence and asymptotic optimality of the improved RRT* algorithm have been proved. Secondly, according to the trajectory planning problem of the spacecraft with small pulse thrust, the coplanar trajectory planning environment model is established through two kinds of different obstacle distributions. The simulation experiment of the RRT, RRT* and the improved RRT* algorithm has been carried out through the establishment of two two-dimensional programming environment model with different distribution of obstacles, and the improvement RRT* The algorithm can be applied to the trajectory planning problem of the orbit service spacecraft based on the pulse small thrust mode, and the basic properties of the RRT* have been improved. Finally, the improved RRT* algorithm cannot realize the asymptotic optimization problem of trajectory planning of the orbit service spacecraft based on the continuous small thrust mode, and improves the RRT* by simplifying the steer function, selecting the best selection point and pruning based on the local optimization of the new node. II
trajpar
trajpar 实体或曲面在做变截面扫描(Var Sec Swp )时,外型变化除了受到X-vector Trajectory的3D曲线控制之外也可用下列两种方式来控制: 1. 使用relation结合trajpar参数来控制截面参数的变化。Trajpar是Pro/E的内参(轨迹参数),它是从0到1的一个变量(呈线性变化)代表扫出特征的长度百分比。在扫出的开始时,trajpar的值是0;结束时为1。使用举例:在草绘的Relation中加入关系式sd#=trajpar+n,此时尺寸sd#受到trajpar+n控制。在sweep开始时值为n,结束时值为n+1。截面的高度尺寸呈线性变化。若截面的高度尺寸受sd#=sin(trajpar*360)+n控制,则呈现sin 曲线变化。 2. 使用relation结合基准图形(datum graph)及trajpar 参数来控制截面参数的变化。我们可利用datum graph来控制截面的变化,也可使用datum graph来控制三维实体或曲面的造型变化。先说明datum graph曲线的使用情况,创建位置为feature>create>datum>graph再给出graph 曲线的名称。绘制时给定坐标系,曲线的x轴方向会随着sweep变化,起点代表sweep开始,终点代表sweep结束。(说明:在控制方程中根据需要选取曲线的一段或全部)曲线在某点的y值即是变量值。使用datum graph控制截面的格式如下: SD#=evalgraph(“graph_name” , x_value) 式中SD#代表欲变化的参数(SD表示草绘尺寸), graph_name为datum graph的名称,x_value代表扫描的“行程”,evalgraph(Evaluate Graph)是Pro/E系统默认的基准控制曲线计算函数,其功能为当变量x_value变化
关系(trajpar)值得你一观的知识
关系(trajpar)值得你一观的知识 (2011-11-05 20:28:01) 标签: 文化 实体或曲面在做变截面扫描(Var Sec Swp )时,外型变化除了受到X-vector Trajectory 的3D曲线控制之外也可用下列两种方式来控制: 1. 使用relation结合trajpar参数来控制截面参数的变化。Trajpar是Pro/E的内参(轨迹参数),它是从0到1的一个变量(呈线性变化)代表扫出特征的长度百分比。在扫出的开始时,trajpar的值是0;结束时为1。使用举例:在草绘的Relation中加入关系式 sd#=trajpar+n,此时尺寸sd#受到trajpar+n控制。在sweep开始时值为n,结束时值为 n+1。截面的高度尺寸呈线性变化。若截面的高度尺寸受sd#=sin(trajpar*360)+n控制,则呈现sin曲线变化。 2. 使用relation结合基准图形(datum graph)及trajpar参数来控制截面参数的变化。我们可利用datum graph来控制截面的变化,也可使用datum graph来控制三维实体或曲面的造型变化。先说明datum graph曲线的使用情况,创建位置为 feature>create>datum>graph再给出graph曲线的名称。绘制时给定坐标系,曲线的x轴方向会随着sweep变化,起点代表sweep开始,终点代表sweep结束。(说明:在控制方程中根据需要选取曲线的一段或全部)曲线在某点的y值即是变量值。使用datum graph控制截面的格式如下: SD#=evalgraph(“graph_name” , x_value) 式中SD#代表欲变化的参数(SD表示草绘尺寸),graph_name为datum graph的名称,x_value 代表扫描的“行程”,evalgraph(Evaluate Graph)是Pro/E系统默认的基准控制曲线计算函数,其功能为当变量x_value变化时计算相应的y值,然后指定给SD#。X_value的值可以是实数或表达式,如果是表达式可含有trajpar参数(根据用户需求而定)。 注:datum graph必须在sweep特征之前创建,或使用reorder 将之置于sweep特征之前。sd=25+10*sin(trajpar*360*12) 这条公式怎样理解: sd代表的是你要控制的变化量,实际上也就是一个/几个尺寸,你可以通过标注得到你想要 控制的尺寸 sin(),是一个三角函数,这个函数只要有初中的几何知识就应该能充分理解他的含义,不论括号里面是什么内容,他的数值都是在-1-1之间变化;因此10*sin(),这个数值就是-10 -10之间变化;因此25+10*sin()代表的是15-35之间变化. 之所以通过关系式可以驱动变截面扫描,最重要是有trajpar这个变量,这是一个系统变量,他的意思是在整个扫描过程中,他的值是从0-1变化的.也就是说在扫描开始时,他的值是0 ,在扫描结束时,他的值是1,因此,我们也可以计算出,sd=25+10*sin(trajpar*360*12),在扫描开始时的起始值是25. 现在我们再来关注trajpar*360*12,trajpar*360,这个值就变成了0-360,那也可以看成是一个
Personalized Route Recommendation using Big Trajectory Data
Personalized Route Recommendation using Big Trajectory Data Jian Dai??,Bin Yang?,Chenjuan Guo§,Zhiming Ding? ?University of Chinese Academy of Sciences,Beijing,China ?Institute of Software,Chinese Academy of Sciences,Beijing,China daijian@https://www.360docs.net/doc/e28078614.html, ?Department of Computer Science,Aalborg University,Denmark byang@cs.aau.dk §Department of Computer Science,Aarhus University,Denmark cguo@cs.au.dk Abstract—When planning routes,drivers usually consider a multitude of different travel costs,e.g.,distances,travel times, and fuel consumption.Different drivers may choose different routes between the same source and destination because they may have different driving preferences(e.g.,time-ef?cient driving v.s. fuel-ef?cient driving).However,existing routing services support little in modeling multiple travel costs and personalization—they usually deliver the same routes that minimize a single travel cost (e.g.,the shortest routes or the fastest routes)to all drivers. We study the problem of how to recommend personalized routes to individual drivers using big trajectory data.First,we provide techniques capable of modeling and updating different drivers’driving preferences from the drivers’trajectories while considering multiple travel costs.To recommend personalized routes,we provide techniques that enable ef?cient selection of a subset of trajectories from all trajectories according to a driver’s preference and the source,destination,and departure time speci?ed by the driver.Next,we provide techniques that enable the construction of a small graph with appropriate edge weights re?ecting how the driver would like to use the edges based on the selected trajectories.Finally,we recommend the shortest route in the small graph as the personalized route to the driver.Empirical studies with a large,real trajectory data set from52,211taxis in Beijing offer insight into the design properties of the proposed techniques and suggest that they are ef?cient and effective. I.I NTRODUCTION Traveling plays an important role in our lives and more and more people choose to use vehicles for traveling.To facil-itate route selection,a variety of navigation services become available and are able to recommend routes when a source, a destination,and sometimes,a departure time,are given. However,the routes recommended by existing navigation services are not always preferred by all drivers.For example, a recent study suggests that the routes provided by a leading navigation service often fail to agree with the routes chosen by local drivers[5]. The reason of the disagreement may be two-fold.First, most of the existing navigation services only consider a limited number of travel costs,e.g.,distance or travel time,and return routes that minimize a single travel cost,e.g.,shortest routes or fastest routes.In contrast,drivers may consider a multitude of different travel costs.For instance,due to an increasing public awareness of environmental protection and high fuel pricing, many drivers increasingly consider fuel consumption[1],in addition to travel times and travel distances. Second,existing navigation services provide all drivers with the same routes(e.g.,shortest routes or fastest routes) and they do not take into account individual drivers’driving preferences(e.g.,time-ef?cient driving,fuel-ef?cient driving, or some trade-off between them). These motivate us to study how to model drivers’driving preferences and to provide personalized routes to different drivers,which can better satisfy drivers’needs. Fig.1shows two different drivers’s choices of routes from source s to destination d.Both routes have similar distances, however,route A takes less travel time and route B takes less fuel1.This clearly demonstrates that the two drivers have different driving preferences—one tries to save time and the other aims to save fuel.In many cases,drivers also choose routes according to trade-offs among multiple travel costs of interest.Since different drivers may have different trade-offs,a single,recommended route cannot be preferred by all drivers. Fig.1.Routes Used by Two Different Drivers With the rapid development and continuing use of vehicle tracking technologies(e.g.,GPS),big trajectory data becomes available[24],[16].The big trajectory data provides opportuni-ties to enable better navigation services that consider multiple travel costs and individual drivers’driving preferences.In particular,it is possible to learn and update individual drivers’1Travel time and fuel consumption can be computed based on speed information recorded in GPS trajectories.
Cultural Sociology and its Trajectory (zulpikar barat)
Rediscovering Culture: Cultural Sociology and its Trajectory Zulpikar Barat Introduction C. Wright Mills, one of the well-known American sociologists of the twentieth century, had once argued that social world requires sociological imagination, and a fully developed sociological imagination requires a deep analysis of culture (1959). For many of the most important social theorists of the twentieth century, the study of society has been carried out only through a full attention of the problem of culture. An attentive reader can realize this fact in the works of many key social theorists from Emile Durkheim (1965) to Jeffery Alexander (1990) including Max Weber (1930a), George Simmel (2001), Antonio Gramsci (1971), Theodor Adorno(1972 [2001]), Raymond Williams (1977[2001]), Pierre Bourdieu(1977,1984), Clifford Geertz (1973), Michael Foucault (1965, 1977), Mary Douglas (1966), Victor Turner (1969), Daniel Bell (1977[1996]) and Ann Swidler (1986). Defining Culture “The most significant intellectual movements of t he last three decades … have placed cultural analysis at the center of human and literary disciplines” (Seidman, 1990: 235). However, despite the importance of culture in social sciences and humanities, it has seemed to be both challenging and trivial to define this concept in a proper way. Because, according to Raymond Williams, “culture is one of the two or three most complicated words in the English language….because it has now come to be used for important concepts in several distinct intellectual disci plines and in several distinct systems of thought” (1976: 76-77). Those who write about culture mean very different things by the term, analyzing culture in alternative theories full of different, controversial concepts and approaches. While investigating the concept of culture, some scholars focus on the difference between culture and society; some emphasize the internal differentiations of culture: high culture versus mass culture, and material versus symbolic culture (Hall, Neitz and Battani 2003). The general debates around cultural analysis today make it impossible to work out an ironclad definition. While reading the important authors on my reading list, I have perceived that many scholars seem to advocate their own standpoints at the cost of some other aspects of culture. Although defining culture seems challenging, it is still necessary to identify the nature of culture. Classical sociologists had explained
动力学轨迹用VMD转Movie的方法
在安装之前先在电脑上安装一个视频制作软件VideoMach 下载地址 https://www.360docs.net/doc/e28078614.html,/main/download.php 先把蛋白质载入VMD,再把TRR轨迹载入VMD里, 更改一下试图为ribbons 再点击Extensions --- Visualization---- Movie Maker,如图所示
在Render 下拉菜单里面选择你需要的渲染工具,默认是screens capture,如果装有Ray tracer的话可以选; Movie setting 里选动画的模式,不用过多解释,一看就明白,一般选择Trajectory,当然你可以可以自己定义; Format 下拉菜单里可以选择AVI或者MPEG-1,默认MPEG-1,AVI太大了; Name of movie 动画的名称,随便设 Rotation angle 如果在Movie setting里选择了旋转,角度在这里控制 Trajectory step size 每隔多少个frame输出一帧,比如你的轨迹有10万个frame,可以10步输出一帧,也就是1万帧 Movie duration 会根据Trajectory step size的设置自行计算 设置好了点击 Make Movie 实际上vmd就是输入一帧帧的图片,然后你可以通过工具把这些图片整合成一个动画,常用的软件是videomach
vmd输出渲染好的图片后就会提示找不到videomach的路径,然后你手动给它指定好路径后,videomach就会自动打开
完成后生成的图片会自动删除(你可以在Movie setting设置不删除),目标目录下会生成一个MPG/AVI的动画,打开就能播放了。