Clustering by fast search and find of density peaks
intrinsic and extrinsic contributions depends on the sample quality (such as the doping density and the amount of disorder).Studies of the de-pendence on temperature and on disorder are therefore required to better understand the doping density dependence of the VHE.Furthermore,a more accurate determination of s H that takes into account the fringe fields in our Hall bar device may be needed for a better quantitative comparison.
REFERENCES AND NOTES
1. A.H.Castro Neto,F.Guinea,N.M.R.Peres,K.S.Novoselov,
A.K.Geim,Rev.Mod.Phys.81,109–162(2009).
2. A.Rycerz,J.Tworzydlo,C.W.J.Beenakker,Nat.Phys.3,
172–175(2007).
3. A.R.Akhmerov,C.W.J.Beenakker,Phys.Rev.Lett.98,
157003(2007).
4. D.Xiao,W.Yao,Q.Niu,Phys.Rev.Lett.99,236809(2007).
5.W.Yao,D.Xiao,Q.Niu,Phys.Rev.B 77,235406(2008).
6. D.Xiao,G.-B.Liu,W.Feng,X.Xu,W.Yao,Phys.Rev.Lett.108,
196802(2012).
7.Y.J.Zhang,T.Oka,R.Suzuki,J.T.Ye,Y.Iwasa,Science 344,
725–728(2014).
8.K.F.Mak,C.Lee,J.Hone,J.Shan,T.F.Heinz,Phys.Rev.Lett.
105,136805(2010).
9. A.Splendiani et al .,Nano Lett.10,1271–1275(2010).10.T.Cao et al .,https://www.360docs.net/doc/e410320640.html,mun.3,887(2012).
11.K.F.Mak,K.He,J.Shan,T.F.Heinz,Nat.Nanotechnol.7,
494–498(2012).
12.G.Sallen et al .,Phys.Rev.B 86,081301(2012).13.S.Wu et al .,Nat.Phys.9,149–153(2013).
14.H.Zeng,J.Dai,W.Yao,D.Xiao,X.Cui,Nat.Nanotechnol.7,
490–493(2012).
15.D.Xiao,M.-C.Chang,Q.Niu,Rev.Mod.Phys.82,1959–2007
(2010).
16.X.Li,F.Zhang,Q.Niu,Phys.Rev.Lett.110,066803(2013).17.S.Murakami,N.Nagaosa,S.-C.Zhang,Science 301,1348–1351
(2003).
18.J.Sinova et al .,Phys.Rev.Lett.92,126603(2004).19.Y.K.Kato,R.C.Myers,A.C.Gossard,D.D.Awschalom,
Science 306,1910–1913(2004).
20.J.Wunderlich,B.Kaestner,J.Sinova,T.Jungwirth,Phys.Rev.Lett.
94,047204(2005).
21.J.Wunderlich et al .,Science 330,1801–1804(2010).
22.N.Nagaosa,J.Sinova,S.Onoda,A.H.MacDonald,N.P.Ong,
Rev.Mod.Phys.82,1539–1592(2010).
23.Materials and methods are available as supplementary
materials on Science Online.
24.The skew scattering contribution,which is important only for
high-mobility devices (22),is neglected in MoS 2devices with relatively low mobility.
25.T.Cheiwchanchamnangij,https://www.360docs.net/doc/e410320640.html,mbrecht,Phys.Rev.B 85,
205302(2012).
26.B.Radisavljevic,A.Radenovic,J.Brivio,V.Giacometti,A.Kis,
Nat.Nanotechnol.6,147–150(2011).
27.L.J.van der Pauw,Philips Techn.Rev.20,220–224(1958).28.B.W.H.Baugher,H.O.H.Churchill,Y.Yang,P.Jarillo-Herrero,
Nano Lett.13,4212–4216(2013).
29.G.Kioseoglou et al .,Appl.Phys.Lett.101,221907
(2012).
30.O.Lopez-Sanchez,D.Lembke,M.Kayci,A.Radenovic, A.Kis,
Nat.Nanotechnol.8,497–501(2013).
31.Strictly speaking,a bilayer device with slightly broken inversion
symmetry by the substrate and/or by unintentional doping could also produce a finite VHE,but these effects are expected to be much smaller as compared with theVHE in monolayer devices (13).32.Here,our assumption that only the photoexcited electrons
contribute to the Hall response is reasonable because the holes are much more vulnerable to traps than are the
electrons,given our highly n-doped device.Unlike the electron side,the VHE and the SHE become equivalent on the hole side owing to the spin-valley coupled valence band.
33.H.-A.Engel,B.I.Halperin,E.I.Rashba,Phys.Rev.Lett.95,
166605(2005).
ACKNOWLEDGMENTS
We thank D.C.Ralph for his insightful suggestions and J.W.Kevek for technical support.We also thank J.Shan for many fruitful discussions and Y.You for private communications regarding the
optical data on monolayer MoS 2.This research was supported by the Kavli Institute at Cornell for Nanoscale Science and the Cornell Center for Materials Research [National Science Foundation (NSF)DMR-1120296].Additional funding was provided by the Air Force Office of Scientific Research (FA9550-10-1-0410)and the
Nano-Material Technology Development Program through the National Research Foundation of Korea funded by the Ministry of Science,ICT and Future Planning (2012M3A7B4049887).Device fabrication was performed at the Cornell NanoScale Science and Technology Facility,a member of the National Nanotechnology Infrastructure Network,which is supported by NSF (grant ECCS-0335765).K.L.M.
and Research Traineeship program (DGE-0654193)and the NSF Graduate Research Fellowship Program (DGE-1144153).
SUPPLEMENTARY MATERIALS
https://www.360docs.net/doc/e410320640.html,/content/344/6191/1489/suppl/DC1Materials and Methods Supplementary Text Figs.S1to S10References (34–37)
24December 2013;accepted 23May 2014elements into categories,or clusters,on the basis of their similarity.Several dif-ferent clustering strategies have been pro-posed (1),but no consensus has been reached even on the definition of a cluster.In K-means (2)and K-medoids (3)methods,clusters are groups of data characterized by a small distance to the cluster center.An objective function,typically the sum of the distance to a set of putative cluster centers,is optimized (3–6)until the best cluster centers candidates are found.However,because a data point is always assigned to the nearest center,these approaches are not able to detect nonspherical clusters (7).In distribution-based al-gorithms,one attempts to reproduce the observed realization of data points as a mix of predefined probability distribution functions (8);the accuracy of such methods depends on the capability of the trial probability to represent the data.
Clusters with an arbitrary shape are easily detected by approaches based on the local den-sity of data points.In density-based spatial clus-tering of applications with noise (DBSCAN)(9),one chooses a density threshold,discards as noise the points in regions with densities lower than this threshold,and assigns to different clusters disconnected regions of high density.However,choosing an appropriate threshold can be non-trivial,a drawback not present in the mean-shift clustering method (10,11).There a cluster is de-fined as a set of points that converge to the same local maximum of the density distribution func-cal clusters but works only for data defined by a set of coordinates and is computationally costly.Here,we propose an alternative approach.Similar to the K-medoids method,it has its basis only in the distance between data points.Like DBSCAN and the mean-shift method,it is able to detect nonspherical clusters and to auto-matically find the correct number of clusters.The cluster centers are defined,as in the mean-shift method,as local maxima in the density of data points.However,unlike the mean-shift meth-od,our procedure does not require embedding the data in a vector space and maximizing ex-plicitly the density field for each data point.The algorithm has its basis in the assumptions that cluster centers are surrounded by neighbors with lower local density and that they are at a relatively large distance from any points with a higher local density.For each data point i ,we compute two quantities:its local density r i and its distance d i from points of higher density.Both these quantities depend only on the distances d ij between data points,which are assumed to satis-fy the triangular inequality.The local density r i of data point i is defined as
r i ?∑j
c e
d ij ?d c T
e1T
where c ex T?1if x <0and c ex T?0otherwise,and d c is a cutoff distance.Basically,r i is equal to the number of points that are closer than d c to point i .The algorithm is sensitive only to the rel-ative magnitude of r i in different points,implying that,for large data sets,the results of the analysis are robust with respect to the choice of d c .
1492
27JUNE 2014?VOL 344ISSUE 6191
https://www.360docs.net/doc/e410320640.html, SCIENCE
RESEARCH |REPORTS
SISSA (Scuola Internazionale Superiore di Studi Avanzati),via Bonomea 265,I-34136Trieste,Italy.
E-mail:laio@sissa.it (A.L.);alexrod@sissa.it (A.R.)
o n A p r i l 23, 2016
h t t p ://s c i e n c e .s c i e n c e m a g .o r g /D o w n l o a d e d f r o m
d i is measured by computing th
e minimum distance between the point i and any other point with higher density:
d i ?min
ed ij T
e2T
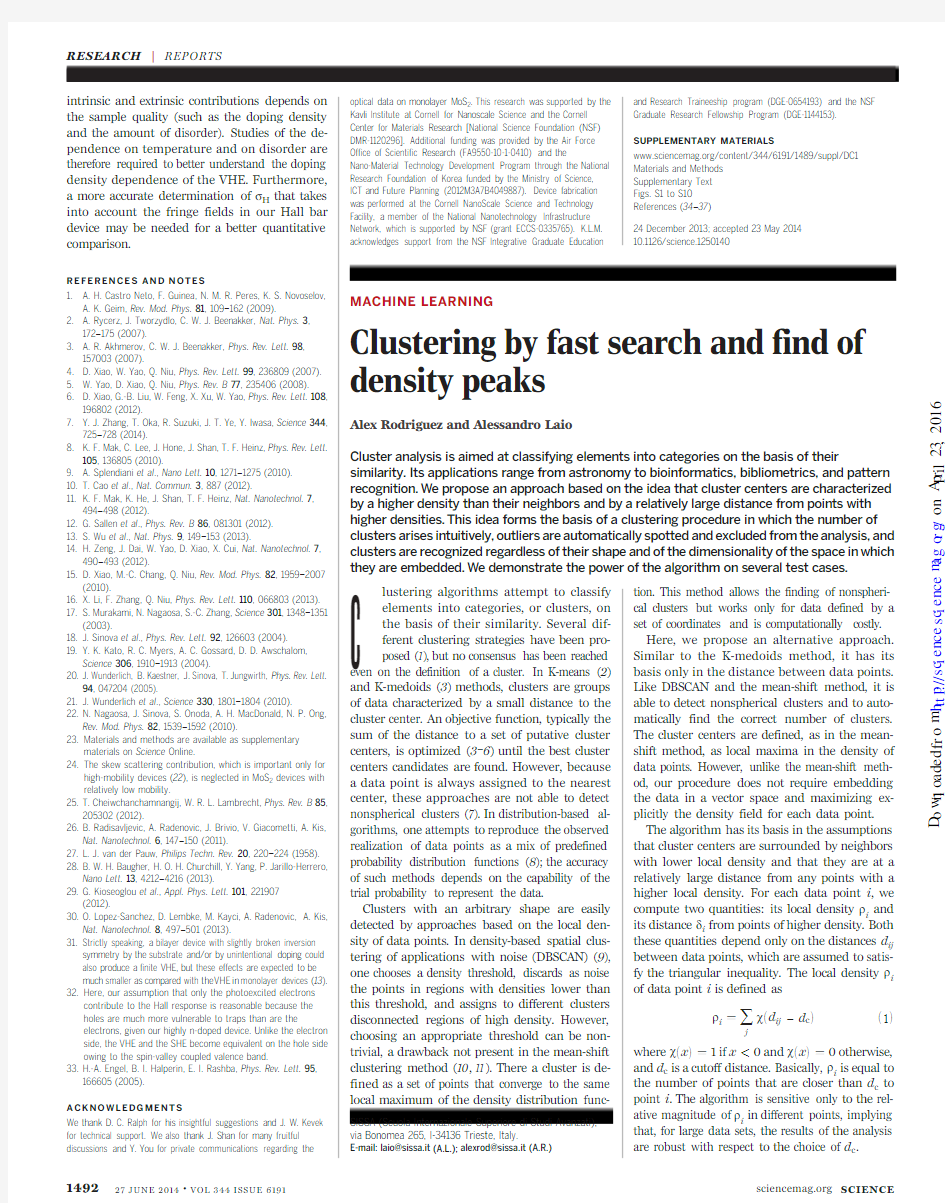
For the point with highest density,we con-ventionally take d i ?max j ed ij T.Note that d i is much larger than the typical nearest neighbor distance only for points that are local or global recognized as points for which the value of d i is anomalously large.
This observation,which is the core of the algorithm,is illustrated by the simple example SCIENCE https://www.360docs.net/doc/e410320640.html,
27JUNE 2014?VOL 344ISSUE 6191
1493
RESEARCH |REPORTS
o n A p r i l 23, 2016
h t t p ://s c i e n c e .s c i e n c e m a g .o r g /D o w n l o a d e d f r o m
in a two-dimensional space.We find that the density maxima are at points 1and 10,which we identify as cluster centers.Figure 1B shows the plot of d i as a function of r i for each point;we will call this representation the decision graph.The value of d for points 9and 10,with similar values of r ,is very different:Point 9belongs to the cluster of point 1,and several other points with a higher r are very close to it,whereas the nearest neighbor of higher density of point 10belongs to another cluster.Hence,as anticipated,the only points of high d and relatively high r are the cluster centers.Points 26,27,and 28have a relatively high d and a low r because they are isolated;they can be considered as clusters com-posed of a single point,namely,outliers.
After the cluster centers have been found,each remaining point is assigned to the same cluster as its nearest neighbor of higher density.The clus-ter assignment is performed in a single step,in contrast with other clustering algorithms where an objective function is optimized iteratively (2,8).In cluster analysis,it is often useful to measure quantitatively the reliability of an assignment.In approaches based on the optimization of a func-tion (2,8),its value at convergence is also a natural quality measure.In methods like DBSCAN
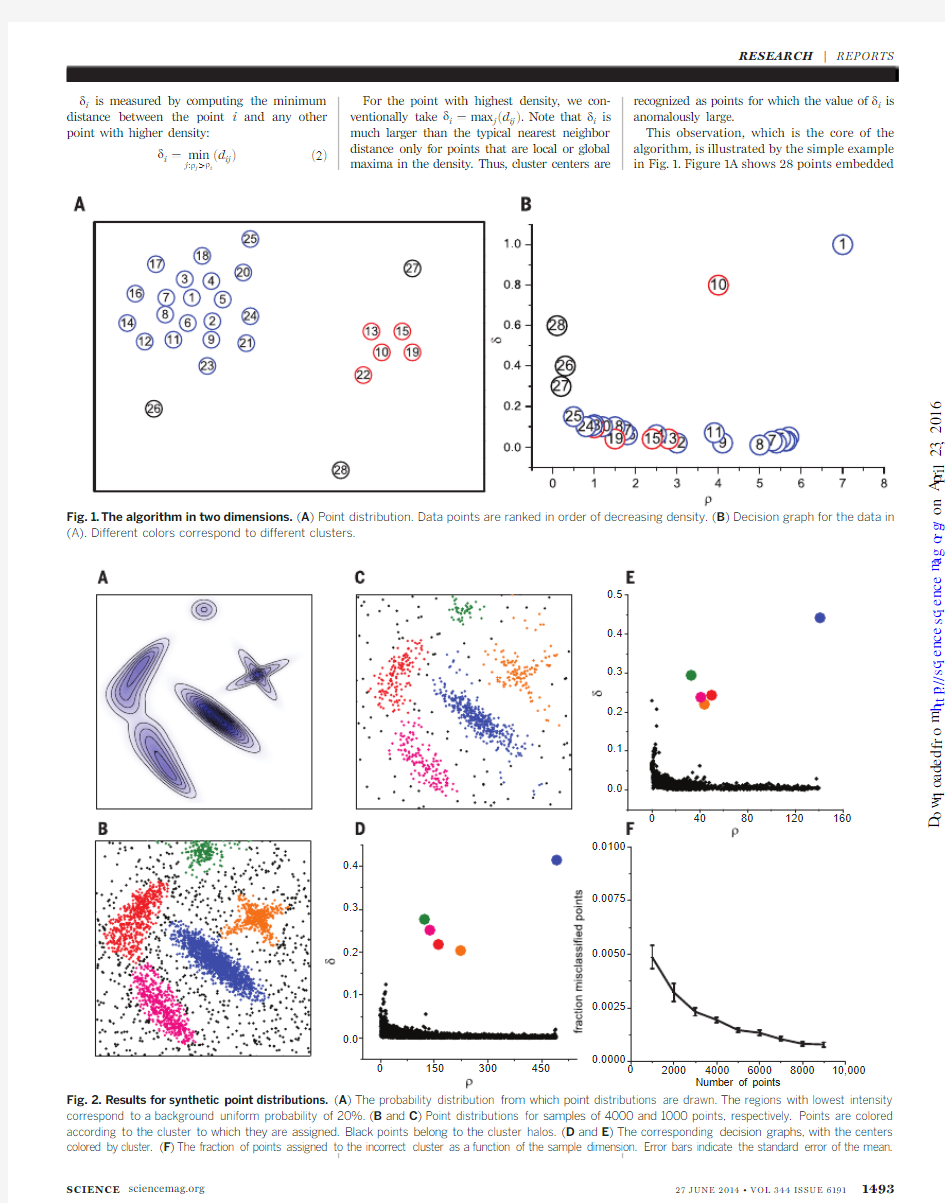
values above a threshold,which can lead to low-density clusters,such as those in Fig.2E,being classified as noise.In our algorithm,we do not introduce a noise-signal cutoff.Instead,we first find for each cluster a border region,defined as the set of points assigned to that cluster but being within a distance d c from data points belonging to other clusters.We then find,for each cluster,the point of highest density within its border region.We denote its density by r b .The points of the cluster whose density is higher than r b are consid-ered part of the cluster core (robust assignation).The others are considered part of the cluster halo (suitable to be considered as noise).
In order to benchmark our procedure,let us first consider the test case in Fig.2.The data points are drawn from a probability distribution with nonspherical and strongly overlapping peaks (Fig.2A);the probability values corresponding to the maxima differ by almost an order of mag-nitude.In Fig.2,B and C,4000and 1000points,respectively,are drawn from the distribution in Fig.2A.In the corresponding decision graphs (Fig.2,D and E),we observe only five points with a large value of d and a sizeable density.These points are represented in the graphs as large solid circles and correspond to cluster centers.After assigned either to a cluster or to the halo.The algorithm captures the position and shape of the probability peaks,even those correspond-ing to very different densities (blue and light green points in Fig.2C)and nonspherical peaks.Moreover,points assigned to the halo correspond to regions that by visual inspection of the prob-ability distribution in Fig.2A would not be assigned to any peak.
To demonstrate the robustness of the proce-dure more quantitatively,we performed the analy-sis by drawing 10,000points from the distribution in Fig.2A,considering as a reference the cluster assignment obtained on that sample.We then obtained reduced samples by retaining only a fraction of points and performed cluster assign-ment for each reduced sample independently.Figure 2F shows,as a function of the size of the reduced sample,the fraction of points assigned to a cluster different than the one they were as-signed to in the reference case.The fraction of misclassified points remains well below 1%even for small samples containing 1000points.
Varying d c for the data in Fig.2B produced mutually consistent results (fig.S1).As a rule of thumb,one can choose d c so that the average number of neighbors is around 1to 2%of the 1494
27JUNE 2014?VOL 344ISSUE https://www.360docs.net/doc/e410320640.html, SCIENCE
RESEARCH |REPORTS
o n A p r i l 23, 2016
h t t p ://s c i e n c e .s c i e n c e m a g .o r g /D o w n l o a d e d f r o m
sets composed by a small number of points,r i might be affected by large statistical errors.In these cases,it might be useful to estimate the density by more accurate measures (10,11).
Next,we benchmarked the algorithm on the test cases presented in Fig.3.For computing the density for cases with few points,we adopted the exponential kernel described in (11).In Fig.3A,we consider a data set from (12),obtaining results comparable to those of the original ar-ticle,where it was shown that other commonly used methods fail.In Fig.3B,we consider an example with 15clusters with high overlap in data distribution taken from (13);our algorithm successfully determines the cluster structure of the data set.In Fig.3C,we consider the test case for the FLAME (fuzzy clustering by local approx-imation of membership)approach (14),with re-sults comparable to the original method.In the data set originally introduced to illustrate the performance of path-based spectral clustering (15)shown in Fig.4D,our algorithm correctly finds the three clusters without the need of gen-erating a connectivity graph.As comparison,in figs.S3and S4we show the cluster assignations obtained by K-means (2)for these four test cases and for the example in Fig.2.Even if the K-means optimization is performed with use of the correct value of K,the assignations are,in most of the cases,not compliant
with visual intuition.The method is robust with respect to changes in the metric that do not significantly affect the distances below d c ,that is,that keep the density estimator in Eq.1unchanged.Clearly,the distance in Eq.2will be affected by such a change of metric,but it is easy to realize that the structure of the decision graph (in particular,the number of data points with a large value of d )is a consequence of the ranking of the density values,not of the actual distance between far away points.Examples dem-onstrating this statement are shown in fig.S5.Our approach only requires measuring (or computing)the distance between all the pairs of data points and does not require parame-terizing a probability distribution (8)or a mul-tidimensional density function (10).Therefore,its performance is not affected by the intrinsic dimensionality of the space in which the data points are embedded.We verified that,in a test case with 16clusters in 256dimensions (16),the algorithm finds the number of clusters and as-signs the points correctly (fig.S6).For a data set with 210measurements of seven x-ray features for three types of wheat seeds from (17),the al-gorithm correctly predicts the existence of three clusters and classifies correctly 97%of the points assigned to the cluster cores (figs.S7and S8).We also applied the approach to the Olivetti Face Database (18),a widespread benchmark for machine learning algorithms,with the aim of identifying,without any previous training,the number of subjects in the database.This data set poses a serious challenge to our approach be-cause the “ideal ”number of clusters (namely of distinct subjects)is comparable with the num-ber of elements in the data set (namely of different images,10for each subject).This makes a reliable estimate of the densities difficult.The similarity between two images was computed by following (19).The density is estimated by a Gaussian ker-nel (11)with variance d c ?0:07.For such a small set,the density estimator is unavoidably affected by large statistical errors;thus,we assign images to a cluster following a slightly more restrictive criterion than in the preceding examples.An im-age is assigned to the same cluster of its nearest image with higher density only if their distance is smaller than d c .As a consequence,the images further than d c from any other image of higher density remain unassigned.In Fig.4,we show the results of an analysis performed for the first 100images in the data set.The decision graph (Fig.4A)shows the presence of several distinct density maxima.Unlike in other examples,their exact number is not clear,a consequence of the sparsity of the data points.A hint for choosing the number of centers is provided by the plot of g i ?r i d i sorted in decreasing order (Fig.4B).This graph shows that this quantity,that is by definition large for cluster centers,starts growing
SCIENCE https://www.360docs.net/doc/e410320640.html,
27JUNE 2014?VOL 344ISSUE 6191
1495
Fig.4.Cluster analysis of the Olivetti Face Database.(A )The decision graph for the first hundred images in the database (18).(B )The value of γi ?r i d i in decreasing order for the data in (A).(C )The performance of the algorithm in recognizing subjects in the full database as a function of the number of clusters:number of subjects recognized as individuals (black line),number of clusters that include more than one subject (red
line),number of subjects split in more than one cluster (green),and num-ber of images assigned to a cluster divided by 10(purple).(D )Pictorial representation of the cluster assignations for the first 100images.Faces with the same color belong to the same cluster,whereas gray images are not assigned to any cluster.Cluster centers are labeled with white circles.
RESEARCH |REPORTS
o n A p r i l 23, 2016
h t t p ://s c i e n c e .s c i e n c e m a g .o r g /D o w n l o a d e d f r o m
anomalously below a rank order 9.Therefore,we performed the analysis by using nine centers.In Fig.4D,we show with different colors the clusters corresponding to these centers.Seven clusters correspond to different subjects,showing that the algorithm is able to “recognize ”7subjects out of 10.An eighth subject appears split in two different clusters.When the analysis is performed on all 400images of the database,the decision graph again does not allow recognizing clearly the number of clusters (fig.S9).However,in Fig.4C we show that by adding more and more putative centers,about 30subjects can be recognized un-ambiguously (fig.S9).When more centers are in-cluded,the images of some of the subjects are split in two clusters,but still all the clusters remain pure,namely include only images of the same sub-ject.Following (20)we also computed the fraction of pairs of images of the same subject correctly associated with the same cluster (r true )and the fraction of pairs of images of different subjects erroneously assigned to the same cluster (r false ).If one does not apply the cutoff at d c in the as-signation (namely if one applies our algorithm in its general formulation),one obtains r true ~68%and r false ~1.2%with ~42to ~50centers,a perform-ance comparable to a state-of-the-art approach for unsupervised image categorization (20).Last,we benchmarked the clustering algorithm on the analysis of a molecular dynamics trajectory of trialanine in water at 300K (21).In this case,clusters will approximately correspond to kinetic basins,namely independent conformations of the system that are stable for a substantial time and separated by free energy barriers,that are crossed only rarely on a microscopic time scale.We first analyzed the trajectory by a standard approach (22)based on a spectral analysis of the kinetic matrix,whose eigenvalues are associated with the relaxation times of the system.A gap is present after the seventh eigenvalue (fig.S10),indicating that the system has eight basins;in agreement with that,our cluster analysis (fig.S10)gives rise to eight clusters,including conformations in a one-to-one correspondence with those defin-ing the kinetic basins (22).
Identifying clusters with density maxima,as is done here and in other density-based clustering algorithms (9,10),is a simple and intuitive choice but has an important drawback.If one generates data points at random,the density estimated for a finite sample size is far from uniform and is instead characterized by several maxima.How-ever,the decision graph allows us to distinguish genuine clusters from the density ripples gen-erated by noise.Qualitatively,only in the former case are the points corresponding to cluster cen-ters separated by a sizeable gap in r and d from the other points.For a random distribution,one instead observes a continuous distribution in the values of r and d .Indeed,we performed the analy-sis for sets of points generated at random from a uniform distribution in a hypercube.The distances between data points entering in Eqs.1and 2are computed with periodic boundary conditions on the hypercube.This analysis shows that,for ran-domly distributed data points,the quantity
g i ?r i d i is distributed according to a power law,with an exponent that depends on the dimensionality of the space in which the points are embedded.The distributions of g for data sets with genuine clusters,like those in Figs.2to 4,are strikingly different from power laws,es-pecially in the region of high g (fig.S11).This observation may provide the basis for a criterion for the automatic choice of the cluster centers as well as for statistically validating the reliability of an analysis performed with our approach.
REFERENCES AND NOTES
1.R.Xu,D.Wunsch 2nd,IEEE Trans.Neural Netw.16,645–678
(2005).
2.J.MacQueen,in Proceedings of the Fifth Berkeley Symposium
on Mathematical Statistics and Probability ,L.M.Le Cam,J.Neyman,Eds.(Univ.California Press,Berkeley,CA,1967),vol.1,pp.281–297.
3.L.Kaufman,P.J.Rousseeuw,Finding Groups in Data:
An Introduction to Cluster Analysis ,vol.344(Wiley-Interscience,New York,2009).
4. B.J.Frey,D.Dueck,Science 315,972–976(2007).
5.J.H.Ward Jr.,J.Am.Stat.Assoc.58,236–244(1963).
6. F.H?ppner,F.Klawonn,R.Kruse,T.Runkler,Fuzzy Cluster
Analysis:Methods for Classification,Data Analysis and Image Recognition (Wiley,New York,1999).
7. A.K.Jain,Pattern Recognit.Lett.31,651–666(2010).8.G.J.McLachlan,T.Krishnan,The EM Algorithm and
Extensions (Wiley Series in Probability and Statistics vol.382,Wiley-Interscience,New York,2007).
9.M.Ester,H.-P.Kriegel,J.Sander,X.Xu,in Proceedings of the
2nd International Conference on Knowledge Discovery and Data Mining ,E.Simoudis,J.Han,U.Fayyad,Eds.(AAAI Press,Menlo Park,CA,1996),pp.226–231.
10.K.Fukunaga,L.Hostetler,IEEE Trans.Inf.Theory 21,32–40
11.Y.Cheng,IEEE Trans.Pattern Anal.Mach.Intell.17,790
(1995).
12.A.Gionis,H.Mannila,P.Tsaparas,ACM Trans.Knowl.
Discovery Data 1,4,es (2007).
13.P.Fr?nti,O.Virmajoki,Pattern Recognit.39,761–775
(2006).
14.L.Fu,E.Medico,BMC Bioinformatics 8,3(2007).15.H.Chang,D.-Y.Yeung,Pattern Recognit.41,191–203
(2008).
16.P.Fr?nti,O.Virmajoki,V.Hautam?ki,IEEE Trans.Pattern Anal.
Mach.Intell.28,1875–1881(2006).
17.M.Charytanowicz et al .,Information Technologies in
Biomedicine (Springer,Berlin,2010),pp.15–24.
18.F.S.Samaria,A.C.Harter,in Proceedings of 1994IEEE
Workshop on Applications of Computer Vision (IEEE,New York,1994),pp.138–142.
19.M.P.Sampat,Z.Wang,S.Gupta,A.C.Bovik,M.K.Markey,
IEEE Trans.Image Process.18,2385–2401(2009).
20.D.Dueck,B.Frey,ICCV 2007.IEEE 11th International Conference
on Computer Vision (IEEE,New York,2007),pp.1–8.
21.F.Marinelli,F.Pietrucci,https://www.360docs.net/doc/e410320640.html,io,S.Piana,PLOS Comput.Biol.
5,e1000452(2009).
22.I.Horenko,E.Dittmer,A.Fischer,C.Schütte,Multiscale Model.
Simulation 5,802–827(2006).
ACKNOWLEDGMENTS
We thank E.Tosatti,D.Amati,https://www.360docs.net/doc/e410320640.html,io,F.Marinelli,A.Maritan,R.Allen,J.Nasica,and M.d ’Errico for stimulating discussion.We acknowledge financial support from the grant Associazione Italiana per la Ricerca sul Cancro 5per mille,Rif.12214,and Fondo per gli Investimenti della Ricerca di Base –Accordo di programma,Rif.RBAP11ETKA.
SUPPLEMENTARY MATERIALS
https://www.360docs.net/doc/e410320640.html,/content/344/6191/1492/suppl/DC1Figs.S1to S11Data S1
18June 2013;accepted 23May 2014A
possible to reduce the size of microfluidic devices and to study fluid flow at the nano-meter scale (1,2).Nanoscale fluid dynamics and transport properties are dominated by surface effects and may substantially differ from
bon nanotubes,for example,flow rates have been reported to exceed the predictions of classical con-tinuum theory by several orders of magnitude (3–5).However,the degree of the enhancement remains a point of discussion (6).The study of a single nanochannel,rather than a large ensemble,should reduce the experimental uncertainty and provide an opportunity to visualize mechanical and fluid dynamics at the nanoscale.Such exper-iments not only incur the challenge of preparing
1496
27JUNE 2014?VOL 344ISSUE 6191
https://www.360docs.net/doc/e410320640.html, SCIENCE
Physical Biology Center for Ultrafast Science and
Technology,Arthur Amos Noyes Laboratory of Chemical Physics,California Institute of Technology,Pasadena,CA 91125,USA.
*Corresponding author.E-mail:zewail@https://www.360docs.net/doc/e410320640.html,
RESEARCH |REPORTS
o n A p r i l 23, 2016
h t t p ://s c i e n c e .s c i e n c e m a g .o r g /D o w n l o a d e d f r o m
10.1126/science.1242072]
(6191), 1492-1496. [doi:344Science Translational Medicine Alex Rodriguez and Alessandro Laio (June 26, 2014)
Clustering by fast search and find of density peaks
Editor's Summary
, this issue p. 1492Science established techniques.
authors tested the method on a series of data sets, and its performance compared favorably to that of density. The algorithm depends only on the relative densities rather than their absolute values. The cluster centers are recognized as local density maxima that are far away from any points of higher others on predefined probability distributions. Rodriguez and Laio devised a method in which the distance. Numerous algorithms exist, some based on the analysis of the local density of data points, and Cluster analysis is used in many disciplines to group objects according to a defined measure of Discerning clusters of data points
This copy is for your personal, non-commercial use only.
Article Tools
https://www.360docs.net/doc/e410320640.html,/content/344/6191/1492article tools:
Visit the online version of this article to access the personalization and Permissions
https://www.360docs.net/doc/e410320640.html,/about/permissions.dtl
Obtain information about reproducing this article: is a registered trademark of AAAS.
Science Advancement of Science; all rights reserved. The title Avenue NW, Washington, DC 20005. Copyright 2016 by the American Association for the
in December, by the American Association for the Advancement of Science, 1200 New York (print ISSN 0036-8075; online ISSN 1095-9203) is published weekly, except the last week Science o n A p r i l 23, 2016
h t t p ://s c i e n c e .s c i e n c e m a g .o r g /D o w n l o a d e d f r o m
小学四年级作文保护环境.doc
小学四年级作文保护环境 热爱自然,保护环境,人人有责。下面一起随我来欣赏小学四年级关于"保护环境"的作文吧。 小学四年级作文保护环境篇1:保护环境 小明的家有只什么事情或事情的后果都知道的宠物狗。有一天的深夜大家都睡了,小明也进入了香甜的梦乡,宠物狗知道在小明的梦里发生了一件很神奇的事。 在那个梦里,小明种的花儿,小草,树苗,等等的植物都说话了,花儿姐姐说:"在坐的各位哥哥,弟弟,大哥,大嫂,叔叔,阿姨们,你们是不是觉得我们在这个地方很无聊,也对社会对国家都没多大的帮助呢?"大家也各有自己的想法。有的说:"你说得不对,我们在这个地方虽然对社会,对国家是没有多大的好处,但是,对小主人的家有好处呀!我们可以供他观赏,也可以帮助他抗挡了一些小风沙,而且,小主人还对我们这么好,天天给我们浇水。"大树伯伯说:"我们举手赞成,举手表示要离开小明的家,不举手的表示要留下来。---举手的比不举手的多,go!"他们也只好一起走,过不了一会儿的时间,他们就找到了一个风沙比较大的大沙滩上,大树伯伯先找了一片干净的地把自己种了下去,没过多长时间大风沙没了。小草也把自己种在了沙滩上。但是小花很调皮天天只知道玩,有一次,小花想去大湖里洗澡,她刚一走进河里:"啊呀!"她叫了一声:"这里的水太脏了,怎么洗澡啊!"她生气地说。这时天下起了大雨,雷公公把藏了很长时间的大鼓拿了出来:"轰"雷刚响完,小明就醒了过来,小明想
想自己干的那些破坏环境的事,惭愧地低下了头。 朋友们,你们可不要像小明一样哦!要自觉保护环境!好了,再见。 小学四年级作文保护环境篇2:保护环境 你有你的家、他有他的家、我有我的家,每个人都有自己美好的家,而地球,是我们全人类和所有生命共同的家。 地球给了我们蓝天白云,给了我们江河湖海,给了我们森林和草原,也给了我们赖以生存的空气。总之,地球这颗蔚蓝色的星球,是茫茫宇宙间我们已知的唯一的家。 听爸爸妈妈说,他们小的时候,环境还是非常美的,到处山青水秀、鸟语花香,池塘里鱼儿快活地游来游去......可是现在,我们的家园却变成了什么样子呢?我们经常从电视里看到沙尘暴、泥石流和山体滑坡的新闻,也经常从大人的口中得知哪里又发生了地震、哪里又发生了饥荒和洪涝干旱等,自然灾害接连不断,生态环境恶化的地球开始报复人类。 面对日益严峻的考验,我们难道不应该好好地反思一下吗?如今,大街小巷的汽车一天比一天多,房前屋后哪里不是停满了车子?它们每天要向天空排放多少废气呀?还有全世界那么多的发电厂、炼油厂和化工厂,他们日复一日、年复一年地排放毒烟,造成了多么可怕的污染啊?人类变本加厉地向地球母亲榨取资源,滥采滥捕、乱砍乱伐、破坏环境,导致全球变暖、冰山融化、水土流失和物种灭绝等一系列灾难性问题频频发生。 保护环境,拯救地球。虽然我们现在还只是小学一年级的学生,但我们可以从身边的小事做起,从保护我们学校的小环境做起。同学们,二
(完整版)七下英语WY课文原文Module1Lostandfound
Module 1 Lost and found Unit 1 Whose bag is this? Ms Li: Welcome back to school everyone! First of all, come and look in the lost and found box! There are a lot of things in it. Whose bag is this? Lingling: Oh sorry! It’s mine. Are my crayons there too? Ms Li: Are these crayons yours? Lingling: Yes, they are and this eraser too. Thank you. Ms Li: Whose tapes are these? Daming: They’re mine. Ms Li: Here’s a purple wallet! Tony: It’s mine. Look! Here’s my name “Tony”! Thank you. Ms Li: Y ou’re welcome! Look at this nice watch. Is it yours too, Daming? Daming: No, it isn’t. I think it’s Betty’s. Lingling: Yes, it’s hers. Ms Li: Everyone, please be careful with your things from now on. Daming: Here are some nice gloves. Whose gloves are they? Ms Li: Let me see... Oh, they’re mine! Thank you!
保护环境小学三年级作文400字4篇
保护环境小学三年级作文400字4篇 保护环境小学三年级作文400字4篇 保护环境小学三年级作文400字1 今天,发生了什么事呢?地球愁眉苦脸的。 他的弟弟——火星是个急性子,他看见地球哥哥面色苍白,成天满脸不开心,竟挣脱自己的轨道,伸出一只手来摸了摸地球的额头。“啊,哥哥,你发烧了!”“可不是嘛,太阳爷爷发出的紫外线照得我透不过气来,更糟的是……” 还没听完地球的话,火星就气得头顶上火山爆发,直往太阳奔去。他一边跑一边骂:“我非扯断他的胡子不可!” “等一下!”地球一把抓住火星说,“你可不能错怪了太阳爷爷。我的话还没说完呢,主要是因为人类破坏大气层,紫外线才这么肆无忌惮。人们还让汽车排放尾气使空气变暖,你说我能不发烧么?” 火星仔细一看,地球的确面目全非了,绿色几乎全没了,南北西极的冰山雪地缩小,沿海变了颜色,海水被污染,还暗暗地发臭,采矿把地球搞得千疮百孔,地球一定很疼吧。 火星望着地球哥哥,大声地说:“人类啊,请保护你们的
家园——地球吧!” 保护环境小学三年级作文400字2 光阴似箭,日月如梭,话说20xx年,那时的我早已成为一名伟大的环保科学家。并且在科学领域创造了三样神奇的环保设备,那就是:垃圾狗、废气鸟和清洁鱼。 人们每天产生的大量垃圾,垃圾狗可以一口消化掉,每只垃圾狗每天可吃掉3吨垃圾。有些小朋友会感觉奇怪了,难道垃圾狗吃垃圾不会生病死掉吗?当然不会了,因为垃圾狗不是真狗,它是一种清洁设备,而且在它的体内安装了一个肥料生产加工器,它不但可以吃掉消化大量的垃圾,而且还可以收旧利废、变废为宝,它不仅保护了我们的自然环境,还把垃圾变成肥料给农作物当营养素呢!可谓一举两得。 废气鸟更加厉害,我在它体内设计安装了一个废气清洁球,通过大量吸入废气进行加工清洁,从而达到把废气变成新鲜空气的目的,还自然界一个清新干净的蓝天。 清理鱼则可以把水里有害的虫子、杂草等等污染水资源的东西全部吃掉,清洁水资源,这样我们就可以喝到干净、清洁的自来水了。 如果有了垃圾狗、废气鸟和清洁鱼,人们以后再也不用担心环境、空气和水质遭到破坏和污染了,因此,从现在开始,我要为了今后的梦想而努力,为了我们美好的环境而努
高考英语作文模板失物招领lost and found 及译文
高考英语作文模板失物招领lost and found 及译文 When I came to school this morning, I found an Oxford Dictionary, which is the sixth printing on the ground of school gate. I was afraid it would be demaged if nobody piched it up. And I stood there for a while seeing no one intended to pick it up. Therefore, I took it to my dormitory. The dictionary is brand new. It has a note in the middle of the book where I saw a poem----Saying Good-bye to Cambridge Again written in Chinese on the paper. If its owner sees this, please contact me after the school time or just go to my dormitory. My number is and room number is 612. 我早上去学校的时候,我在学校门口发现一本第六版的牛津字典。我担心如果没有人来认领,那本书会弄坏。我在那里站了一会儿见没有人想要把它捡起来。所以,我就把它拿给我的宿舍了。那本字典是全新的。在字典里面我看到一张箯筏,箯筏上写着一首中文诗——再别康桥。 如果它的主人看到这个,请在课后时间联系我或是去我的宿舍。我的电话号码是宿舍号是612。 Lee
Linux find命令常见用法汇总
Linux find命令常见用法汇总 导读:Linux系统中查找文件的命令式find,find命令具有强大的功能,能够提供多种查找条件,下面小编就给大家带来Linux中find命令的常见用法汇总,一起来学习下吧。 ·find path -option [-print ][-exec -ok command ]{} \; find命令的参数; pathname:find命令所查找的目录路径。例如用。来表示当前目录,用/来表示系统根目录。 -print:find命令将匹配的文件输出到标准输出。 -exec:find命令对匹配的文件执行该参数所给出的shell命令。相应命令的形式为‘command’ { } \;,注意{ }和\;之间的空格。 -ok:和-exec的作用相同,只不过以一种更为安全的模式来执行该参数所给出的shell命令,在执行每一个命令之前,都会给出提示,让用户来确定是否执行。 #-print 将查找到的文件输出到标准输出 #-exec command {} \; —–将查到的文件执行command操作,{} 和\;之间有空格 #-ok 和-exec相同,只不过在操作前要询用户 例:find 。-name .svn | xargs rm -rf ==================================================== -name filename #查找名为filename的文件 -perm #按执行权限来查找 -user username #按文件属主来查找
-group groupname #按组来查找 -mtime -n +n #按文件更改时间来查找文件,-n指n天以内,+n指n天以前-atime -n +n #按文件访问时间来查GIN:0px“》 -ctime -n +n #按文件创建时间来查找文件,-n指n天以内,+n指n天以前-nogroup #查无有效属组的文件,即文件的属组在/etc/groups中不存在 -nouser #查无有效属主的文件,即文件的属主在/etc/passwd中不存 -newer f1 !f2 找文件,-n指n天以内,+n指n天以前 -ctime -n +n #按文件创建时间来查找文件,-n指n天以内,+n指n天以前-nogroup #查无有效属组的文件,即文件的属组在/etc/groups中不存在 -nouser #查无有效属主的文件,即文件的属主在/etc/passwd中不存 -newer f1 !f2 #查更改时间比f1新但比f2旧的文件 -type b/d/c/p/l/f #查是块设备、目录、字符设备、管道、符号链接、普通文件 -size n[c]#查长度为n块[或n字节]的文件 -depth #使查找在进入子目录前先行查找完本目录 -fstype #查更改时间比f1新但比f2旧的文件 -type b/d/c/p/l/f #查是块设备、目录、字符设备、管道、符号链接、普通文件 -size n[c]#查长度为n块[或n字节]的文件 -depth #使查找在进入子目录前先行查找完本目录 -fstype #查位于某一类型文件系统中的文件,这些文件系统类型通常可在/etc/fstab中找到 -mount #查文件时不跨越文件系统mount点 -follow #如果遇到符号链接文件,就跟踪链接所指的文件 -cpio %; #查位于某一类型文件系统中的文件,这些文件系统类型通常可在/etc/fstab中找到 -mount #查文件时不跨越文件系统mount点 -follow #如果遇到符号链接文件,就跟踪链接所指的文件 -cpio #对匹配的文件使用cpio命令,将他们备份到磁带设备中 -prune #忽略某个目录 ===================================================== $find ~ -name ”*.txt“ -print #在$HOME中查.txt文件并显示 $find 。-name ”*.txt“ -print $find 。-name ”[A-Z]*“ -print #查以大写字母开头的文件 $find /etc -name ”host*“ -print #查以host开头的文件 $find 。-name ”[a-z][a-z][0–9][0–9].txt“ -print #查以两个小写字母和两个数字开头的txt文件 $find 。-perm 755 -print $find 。-perm -007 -exec ls -l {} \; #查所有用户都可读写执行的文件同-perm 777 $find 。-type d -print $find 。!-type d -print $find 。-type l -print $find 。-size +1000000c -print #查长度大于1Mb的文件
小学作文保护环境
小学作文保护环境 篇一:保护环境在我们的身边就有很多污染环境的污染物,比如说:大量的生活废弃品、废塑袋、一次性饭盒、果皮纸屑等等。污染物对环境来说,毫无疑问,肯定有很大的危害。就拿我们学校来说吧,学校里有些学生经常乱扔果皮、纸屑,不仅影响了环境,更糟糕的是别人一不小心踩到了,就有可能滑倒;在班里,有些同学的椅子上还有些瓜子壳、铅笔屑。还有爱吃糖的同学经常往地上吐泡泡糖,别人要是踩上,粘在脚底下取不掉多伤情绪埃还有些调皮的同学,用蜡笔在门上和墙壁上乱写乱画,破坏了教室的清洁。像上面所说的那样破坏环境的人和事,真是举不胜举。我真想对人类说:“保护环境,人人有责。”让我们从现在做起,从自己做起,从小事做起,爱护我们身边的一草一木,为保护环境建设我们美好的的家园作出自己的贡献。篇二:环保环境古往今来,地球妈妈用甘甜的乳汁哺育了无数代子孙。原来的她被小辈们装饰得楚楚动人。可是,现在人类为了自
身的利益,将她折磨得天昏地暗。人类只有一个地球;而地球正面临着严峻的环境危机。“救救地球”已成为世界各国人民最强烈的呼声。我为周围环境的恶化而感到心痛,我想:作为未来接班人的青少年,如果不了解人类环境的构成和环境问题的严重性,无视有关环境保护的法律法规,不去增强环境保护意识,自觉履行保护环境的义务的话,我们的生命将毁在自己的手中,老天将对我们作出严厉的惩罚。为此我下定决心要从我做起爱护环境,保护我们这个赖以生存的家园,做一个保护环境的卫士。在刚过去的一年中,我积极参加学校开展的植树活动,带领我们初一(6)中队的班干部创立了“绿色天使”植绿护绿小组,鼓励队员们在校园里认养了一棵小树苗,利用课余时间给它梳妆打扮,为它长成参天大树打下了基矗在学校组织的“让地球充满生机”的签字活动中,我郑重地在上面签下自己的名字,并写下了自己对环保的决心和期望,对美好未来的憧憬。我积极参加学校在世界环境日举行的有奖征稿,认真查阅、收集各类资料,进行社会调查,撰写有关环境治理设想方面的文章,我经常去参加学校组织的环保讲
15个极好的Linux find命令示例
前阵子,我们审查了15件实事find命令的例子(第一部分)。查找命令可以做很多比只是在寻找基于名称的文件(第2部分)在这篇文章中,让我们来讨论15高级find命令的例子,包括-根据它访问,修改或改变的时间查找文件,查找文件相比之下,执行操作找到的文件等。 基于访问/修改/更改时间查找文件 你可以找到基于以下三个文件的时间属性的文件。 1.访问时间的文件。文件访问时,访问时间得到更新。 2.的文件的修改时间。文件内容修改时,修改时间得到更新。 3.更改文件的时间。更改时间时,被更新的inode数据的变化。 在下面的例子中,min选项之间的差异和时间选项是参数。 ?分论点将它的参数为分钟。例如,60分钟(1小时)= 60分钟。 ?时间参数,将它的参数为24小时。例如,时间2 = 2 * 24小时(2天)。 ?虽然这样做的24个小时计算,小数部分都将被忽略,所以25小时为24小时,和47小时取为24小时,仅48小时为48小时。要获得更清晰的参考atime的部分find 命令的手册页。 例1:找到在1个小时内被更改的文件 想要通过文件修改时间找出文件,可以使用参数-mmin -mtime。下面是man手册中有关mmin和mtime的定义。 ?-mmin n文件最后一次修改是在n分钟之内 ?-mtime n文件最后一次修改是在n*24小时之内(译者注:也就是n天了呗)执行下面例子中的命令,将会找到当前目录以及其子目录下,最近一次修改时间在1个小时(60分钟)之内的文件或目录 1 # find . -mmin -60
同样的方式,执行下面例子中的命令,将会找到24小时(1天)内修改了的文件(文件系统根目录/ 下) 1 # find / -mtime -1 例2:找到1个小时内被访问过的文件 想要通过文件访问时间找出文件,可以使用参数-amin -atime。下面是man手册中有关amin和atime的定义。 ?-amin n文件最后一次访问是在n分钟之内 ?-atime n文件最后一次访问是在n*24小时之内 执行下面例子中的命令,将会找到当前目录以及其子目录下,最近一次访问时间在1个小时(60分钟)之内的文件或目录 1 # find . -amin -60 同样的方式,执行下面例子中的命令,将会找到24小时(1天)内被访问了的文件(文件系统根目录/ 下) 1 # find / -atime -1 例3:查找一个小时内状态被改变的文件 (译者注:这里的改变更第1个例子的更改文件内容时间是不同概念,这里是更改的是文件inode的数据,比如文件的权限,所属人等等信息) 要查找文件的inode的更改时间,使用-cmin和-ctime选项 ?-cmin n文件的状态在n分钟内被改变 ?-ctime n文件状态在n*24小时内(也就是n天内)被改变 (译者注:如果上面的n为-n形式,则表示n分钟/天之内,n为+n则表示n分钟/天之前) 下面的例子在当前目录和其子目录下面查找一个小时内文件状态改变的文件(也就是60分钟内): 1 # find . -cmin -60 同样的道理,下面的例子在根目录/及其子目录下一天内(24小时内)文件状态被改变的文件列表: 1 # find / -ctime -1 例4:搜索仅仅限定于文件,不显示文件夹
小学三年级保护环境作文(三篇)
小学三年级保护环境作文(三篇) 当今,世界各地都在提倡环保,都有一些一次性碗、杯子和 筷子等,人们都说这样可以既方便又洁净,而且不麻烦。可他们又怎 么知道:筷子是用木材做的,这样岂不是白费木材?因为森林资源是 有限的,筷子用一次扔掉怪可惜的。还有一次性的碗、杯子。不也是 用木材加工的吗?当我知道了这些消息,我便不由自主地想起我家的 环保秩序,是我当了一次环保主人。 那时环保值得前一个星期,每当我放学回家后,发觉了爷爷听收 音机的电池经常扔掉,这一次又被我发觉了,想阻止他扔掉,便想了 一个方法对他说:“电池里含有一些不好的东西,一碰到土壤就会使 土坏掉;假如掉进水里的话,那后果就更严重,周围大多数水都不能 喝爷爷听到这些消息,愣住了,从此以后他用完了的电池都拿给我, 我便收藏起来。接着劝诫我的哥哥,他经常把看过的书不是扔掉就是 烧掉,非常可惜。因为刚开始是用钱买的。我见后,劝他把书收藏起来,或者是卖掉。卖掉的书经常被收废品的伯伯捡起来,给他的儿子看。这样,我家的两位最难劝的人被我说服了,剩下的问题一下子就 解决。 只要我们无论做什么事都注意些,世界上就“处处环保”了。 【篇二】 我家旁边有座公园,周围的树木密密麻麻,就像一片片绿色的海洋。 有一天,我到公园玩。一进门,就闻到一股味道,我抓紧顺着那 味道跑去,跑到小河边,发觉那味道是从小河里传来的。我一看,不 禁说了一声:“小河怎么这么脏了啊!”小河就告诉我:“都是人类 害的,我现在什么也没有了,小鱼不要我,连小蝌蚪也走了。”“好,你别哭,你没有了,我可以帮你寻回来呀!”“你骗人,是不可能的。”我一脸保证说:“我一定会做到的,请相信我。”说完,我就
find和xargs的组合用法
find和xargs的組合用法 一、find 命令格式 1、find命令的一般形式为; find pathname -options [-print -exec -ok ...] 2、find命令的参数; pathname: find命令所查找的目录路径。例如用.来表示当前目录,用/来表示系统根目录。 -print:find命令将匹配的文件输出到标准输出。 -exec:find命令对匹配的文件执行该参数所给出的shell命令。相应命令的形式为'command' { } \;,注意{ }和\;之间的空格。 -ok:和-exec的作用相同,只不过以一种更为安全的模式来执行该参数所给出的shell命令,在执行每一个命令之前,都会给出提示,让用户来确定是否执行。 3、find命令选项 -name 按照文件名查找文件。 -perm 按照文件权限来查找文件。 -prune 使用这一选项可以使find命令不在当前指定的目录中查找,如果同时使用-depth选项,那么-prune将被find 命令忽略。 -user 按照文件属主来查找文件。 -group 按照文件所属的组来查找文件。 -mtime -n +n 按照文件的更改时间来查找文件,- n表示文件更改时间距现在n天以内,+ n表示文件更改时间距现在n 天以前。find命令还有-atime和-ctime 选项,但它们都和-m time选项。 -nogroup 查找无有效所属组的文件,即该文件所属的组在/etc/groups中不存在。 -nouser 查找无有效属主的文件,即该文件的属主在/etc/passwd中不存在。 -newer file1 ! file2 查找更改时间比文件file1新但比文件file2旧的文件。 -type 查找某一类型的文件,诸如: b - 块设备文件。 d - 目录。 c - 字符设备文件。 p - 管道文件。 l - 符号链接文件。 f - 普通文件。 -size n:[c] 查找文件长度为n块的文件,带有c时表示文件长度以字节计。
如何利用find命令查找文件
如何利用find命令查找文件 find命令会在指定目录及其子目录下查找符合条件的特定文件。此命令的最大用处是当忘了文件的正确所在,而想找到该文件。命令格式find 目录名条件目录名—欲开始寻找的目录所在。find会寻找此目录及其子目录。可以有多个目录名称,只要目录与目录之间用空格分开即可。条件—欲搜索文件的条件,可包含文件名称、属主、最后修改时间等等。条件列表说明-name name 指定要被寻找的文件或目录名称,可用通配符,如, -name ‘*.c’-print 将符合条件的路径打印出来-size n 寻找占用n个block的文件-type x 以文件类型作为寻找条件。文件类型x如下:d —目录(directory), f —文件(file),b —块(block), c —字符(character),p —管道(pipe)-user user 寻找属于user所拥有的文件,user可为用户名或uid号-group group 寻找用户组为group的所有文件,group可为组名称或gid号-links n 寻找链接数等于n的所有文件-atim n 寻找n天之前曾被存取的文件-mtime n 寻找n天之前曾被修改的文件-exec command {}\; 用寻找到的文件作为执行command的对象,{}内存欲执行command时所需的参数条件的逻辑运算符:逻辑运算符逻辑意义举例说明!非!-name “*.c”所有不以.c为扩展名的文件-o 或-size +10 -o -links 3 所有大于10block或链接数为3的文件与-size +10 -links 3 大于10block且链接数为3的文
小学生保护环境作文500字范文5篇
小学生保护环境作文500字范文5篇 保护环境,人人有责。爱护环境,从我做起。下面是我整理的小学生保护环境作文500字,仅供参考。 小学生保护环境作文500字一 当你走在宽阔的道路上,欣赏着旁边的绿树红花。突然,扑鼻而来的污水臭味时,你不觉得恶心吗?当你心情无比舒畅的时候,突然一个塑料袋飞到你的脸上,你不觉得扫兴吗?相信大家也有同感。人类的生存环境已经受到严重的破坏,清澈的河水不见了,生活污水、工业废水大量的排入河中,使河水发黑、发臭,水草疯长。空气质量也越来越差,大量工业企业把未经过处理的有毒、有害的气体直接排到空气中,造成空气污染,还带来了酸雨。由于乱砍乱伐,造成水土流失,发生沙尘暴和洪水等自然灾害。生态环境的破坏,还威胁到自然界动物的生危,使许多动物面临灭绝的危机。可见,保护我们唯一的地球,保护我们的家园,已经刻不容缓,但人们的保护意识不是很强,大量的废气偷偷排放,垃圾乱扔乱丢,水资源的浪费等等,直接破坏人类生存环境,很难想像,这样下去,我们地球会变得怎么样? 保护环境人人有责,应该冲每个人做起,虫窝做起,不要乱扔垃圾,不随地吐痰,爱护花草树木,要节约用水!。 小学生保护环境作文500字二 人类一直以为地球上的水和空气是无穷无尽的,所以不担心把千万吨废气送到天空去,又把数以亿吨计的垃圾倒进江河湖海…… 人类没有注重对青山、绿水、蓝天、大海的保护,私采矿,滥伐树、乱排污
水乱放污气、过度放牧、过度开荒、过度开发自然资源、破坏自然界的生态平衡等等。 正所谓:你中有我、我中有你。 近年来,由于人口急剧增长,工业迅猛发展,土壤表面堆放和倾倒,有害废水不断向土壤中渗透,大气中的有害气体及飘尘也不断随雨水降落在土壤中,导致了土壤污染。人类食用后,会影响健康。 多数大城市里的空气含有许多取暖、运输和工厂生产带来的污染物。这些污染物威胁着数千万市民的健康,导致许多人失去了生命,这叫做空气污染。 现在城市巨大,这些大城市的无序扩大也损害到了自然区。因此,无限制的城市化应当被看作是文明的新弊端。 最近几十年,在1980-1990年,世界上有1。5亿公顷森林消失了。按照目前这种森林面积减少的速度,40年以后,就再也见不到一棵树了。 水是不能制造的,一定要珍惜水资源。水饥、水荒、水枯、水污的缠扰,作为“水”的关键点。 臭氧层臭氧层被破坏后,其吸收紫外线的能力大大降低,使得人类接受过量紫外线辐射的机会大大增加了。在北极地区,因为太阳的辐射,冰块全部破损,北极熊无家可归。 所以自然保护很重要。 小学生保护环境作文500字三 当你走在宽阔的道路上,欣赏着旁边的绿树红花。突然,扑鼻而来的污水臭味时,你不觉得恶心吗?当你心情无比舒畅的时候,突然一个塑料袋飞到你的脸上,你不觉得扫兴吗?相信大家也有同感。人类的生存环境已经受到严重的破坏,
《Lostandfound》台词
[Lost & Found] Based on the book by Oliver Jeffers It was an early autumn morning just as the leaves were beginning to fall when an unexpected visitor arrived at a little town by the sea and with him began a remarkable story. Elsewhere on this particular morning a small boy was getting up in much the same way that he always did looking forward to his normal routine, in his usual way! But today was going to be anything but ordinary! First impressions are a funny thing and it's always wise to take a moment to consider this when something new turns up on your doorstep. To the boy this all seemed a bit worrisome. And yet he was not the sort of person to ignore someone who might need his help
小学生保护环境的作文5篇
小学生保护环境的作文5篇 地球是我们的母亲,是我们赖以生存的家园下面是我精心精选的小学生保护环境的作文,仅供参考,希望喜欢。 小学生保护环境的作文一 环保,这代表了废物利用、垃圾分类、五水共治等很多方面。我作为未来接班人的青少年,深刻的懂得我们人类共同的家园只有一个,那就是地球,我们破坏环境,就等于破坏自己的家园。 在暑假里,学校开展了“寻访身边的美丽河流”主题实践活动。我得知这个消息非常喜悦,因为我知道可以尽自己一份绵薄之力了。我和同学们组织了护河小队,并给它取了个响亮的名字“彩虹护河小队”,因为小队刚好七位成员,每位成员就代表一种颜色,也就是我们对环保的一份力量。我和我的小队去了杭州最大的淡水河—护城河。我们向路上的叔叔阿姨派发了自己亲手制作的宣传卡片,拾捡河道周边的垃圾,劝导了在河边钓鱼、游泳的叔叔们,了解了护城河的历史和现状,慰问了河道美容师—环卫工人,检测了河道的水质,最后我们大家还聚在一起热火朝天的讨论了保护环境,保护河流的建议。虽然这次活动很短暂,但是在我心中深深的种入了一颗环保之心。我们小队的这次主题实践活动的制作手册,不仅获得了学校的特等奖,还获得了江干区的三等奖。我个人也获得了校社会实践活动优秀队长和区先进个人的荣誉。 我立志要成为一名环保小卫士!但是只靠一个人是不行的,众人拾材火焰高,团结就是力量。一点一滴的小事,一点一滴的破坏,都会影响我们的生活,甚至可以结束地球的生命,因此我们有义务从现在开始,保护环境,捍卫我们共同的
家园! 小学生保护环境的作文二 当你走在宽阔的道路上,欣赏着旁边的绿树红花。突然,扑鼻而来的污水臭味时,你不觉得恶心吗?当你心情无比舒畅的时候,突然一个塑料袋飞到你的脸上,你不觉得扫兴吗?相信大家也有同感。人类的生存环境已经受到严重的破坏,清澈的河水不见了,生活污水、工业废水大量的排入河中,使河水发黑、发臭,水草疯长。空气质量也越来越差,大量工业企业把未经过处理的有毒、有害的气体直接排到空气中,造成空气污染,还带来了酸雨。由于乱砍乱伐,造成水土流失,发生沙尘暴和洪水等自然灾害。生态环境的破坏,还威胁到自然界动物的生危,使许多动物面临灭绝的危机。可见,保护我们唯一的地球,保护我们的家园,已经刻不容缓,但人们的保护意识不是很强,大量的废气偷偷排放,垃圾乱扔乱丢,水资源的浪费等等,直接破坏人类生存环境,很难想像,这样下去,我们地球会变得怎么样? 保护环境人人有责,应该冲每个人做起,虫窝做起,不要乱扔垃圾,不随地吐痰,爱护花草树木,要节约用水!。 小学生保护环境的作文三 地球是我们的家园,但是我们的家园正在遭受人类的破坏。作为一名小学生,应该怎样做才能保护我们的家园呢?我认为,要从小事做起,从我做起。 首先,我们生活的垃圾不能乱扔,应该放在垃圾桶里或者放到塑料袋,并且要分类好,以便清洁员分类处理。 其次,要节约用水。比如:洗完手要关水龙头、洗完脚的水能用来冲厕所。 再次,我们在超市买东西时,要自备购物袋和购物篮,以免带来白色污染。
(完整)外研社七年级下英语Module1Lostandfound导学案
七年级下册Module 1 Lost and found 导学案 Unit 1 Whose bag is this?. 【课型】:听说课 【学习目标】 1.能根据音标正确拼读本单元的单词 2.了解课本P2-3出现的短语和重点句型、名词性物主动词。 句型:1>There is /are.... 2> Here is /are.... 3>Please be careful with.... 4>Whose bag is this? 3.语言知识目标: 掌握词汇: whose , lose ,find , mine, yours , hers, be careful with , :crayon, eraser , glove , wallet, watch, first of all, lost and found box, tape, purple , from now on , h ere is /are..., Key structure: whose...is this? It’s mine Is this ...yours? Are these ... yours? 2. 4.技能目标:能听懂对失物招领的对话. 5.情感态度与价值观:培养学生助人为乐,拾金不昧的高尚品格。 【学法指导】仔细看课文92页中名词性物主动词的用法, 【重点与难点】 1.名词性物主代词 2.名词性物主代词和形容性物主代词的差异 3元音字母a在单词中的读音。 【课前预习】 (一)完成课文p2-3的相应习题。 (二)英汉互译 1. 钱包________ 2. 橡皮擦________ 3. 谁的________ 4. whose_______ 5. 失物招领箱_____ _____ ______ ______ 6. 我的(东西)________ 7. 从现在开始_______ _______ _______ 8. 你(们)的(东西)________ 9. 她的(东西)________ 【思考,小组讨论,合作探究】: 1.welcome back to school(英译汉)____________________ back是“________”的意思 “欢迎某人来某处”用be welcome to +地点名词 *【不能用welcome sb to some place】。 例如:欢迎你来我北京(或北京欢迎你) 正:(You are ) welcome to Beijing. 误:Welcome you to Beijing. [知识链接]“欢迎某人做某事”可以说sb. is welcome to do sth, 但不可以说welcome sb. to do sth。 例如1>:我们欢迎你来访问北京。 正:You are welcome to visit Beijing. 正:(You are ) welcome to Beijing. 误:We welcome you to visit Beijing. 2>、他们热烈地欢迎我们。 正:We were given a warm welcome. 正:They gave us a warm welcome. 正:We received a warm welcome. 误:We were warmly welcomed by them. 2.Please be careful with your things from now on.(看课文83页解析) 1> be careful with ...意思是:_______________________
FIND命令大全
Linux Find命令精通指南 作者:Sheryl Calish 简单介绍这一无处不在的命令的强大的方面以及混乱的方面。 2008年7月发布 Linux find命令是所有Linux命令中最有用的一个,同时也是最混乱的一个。它很难,因为它的语法与其他Linux命令的标准语法不同。但是,它很强大,因为它允许您按文件名、文件类型、用户甚至是时间戳查找文件。使用find命令,您不但可以找到具这些属性任意组合的文件,还可以对它找到的文件执行操作。 本文的目的是,通过概述find命令的用途和潜能,简化该命令的学习和使用。同时,它将针对find命令的某些最强大但最混乱的方面提供一个基本的指南和参考。 [注意:本文使用的find版本是GNU版本,因此,某些细节可能与其他版本的find有所不同。] 基本格式 开始之前,我们先来看一下find命令的基本结构: find start_directory test options criteria_to_match action_to_perform_on_results 在以下命令中,find将开始在当前目录(用“.”表示)中查找任何扩展名为“java”的文件:find.-name"*.java" 下面是该命令所找到的命令的缩略清单: find.-name"*.java" ./REGEXPvalidate/src/oracle/otnsamples/plsql/ConnectionManager.java ./REGEXPvalidate/src/oracle/otnsamples/plsql/DBManager.java .. [注意:如果您从本文剪切并粘贴来运行该find命令,您可能需要使用自己的键盘替换双引号(“”)才能得出正确的结果。] 以下命令将执行相同的操作。在这两种情况下,您都需要对通配符进行转义以确保它传递到find命令并且不由shell解释。因此,请将您的搜索字符串放到引号里,或者在它前面加上反斜线:
保护环境小学生作文【六篇】
保护环境小学生作文【六篇】保护环境小学生作文篇一 现在地球的环境越来越差了,可是很多人仍然不把他当回事。垃圾漫天飘扬,飘到树枝上、小河里,到处都是,污染了小河,曾经在河里嬉戏的小鱼小虾都消失的无影无踪,曾经在树枝上唱歌的小鸟也没了踪影。人们大量的砍伐树木,中国目前每年生产和丢弃四百五十亿双一次性筷子,相当于两千五百万棵成年树遭到砍伐!很多的塑料制品得在地下埋上一千年才能被分解,期间还会不断释放温室气体!看到这里,你还会无动于衷吗? 我们应该从小事做起,做到不乱扔垃圾,不随地吐痰,少开私家车,出门坐车做公共汽车,多种花草树木,出门要随身携带筷子和袋子,避免使用一次性筷子和塑料袋等等。 有一次,我就没有做到环保。那天晚上,我想把用完的作业被扔掉,妈妈看见了,对我说:“这些纸回收还可以再利用,浪费了多可惜啊,纸的背面还可以用的,你就用它做草纸吧。”我低下头,认识到了自己的错误,从今往后,我就没有在浪费了。 地球是我们伟大的母亲,虽然她已经有四十五亿岁了,但地球的年轻与衰老并不是用年龄来衡量的,作为地球的孩子,我们应该让自己的母亲永远年轻!来吧,让我们一起努力,我相信,如果每个人都作出努力,微小的力量将汇聚成巨大的力量,让我们的地球妈妈一定能恢复以前的健康和美丽!
保护环境小学生作文篇二 环保是我们这个时代充满争议的流行词,但同时是保护环境中极其重要的一点,我们如何做到环保,如何最环保,怎样才算环保呢,在以下内容中,我们将知道。 环保是指环境保护。环保是指人类为解决现实的或潜在问题,协调人类与环境的关系,保障经济社会的持续发展而采取的各种行动的总称。 现在,我们生活中,最严重的环保问题就是土壤遭到破坏,气候变化和能源浪费。据参考消息报道,110个国家可耕地的肥沃程度在降低。在非洲,亚洲和拉丁美洲,由于森林植被的消失、耕地的过分开发和牧场的过度放牧,裸露的土地变得脆弱了。大地母亲已经变的面黄肌瘦,请好好保护我们的大地母亲!有专家预计,在不久的将来海平面将升高,很多岛屿都将会被淹没。 那我们该如何制止这一切的发生呢?其实,保护环境并没有想象中的那么难,只要我们从小事做起,就一定会让地球焕然一新的,比如:多使用环保袋,尽量避免用塑料袋;尽量坐公交车,尽可能的减少汽车排放的废气;平时多步行,骑自行车,锻炼身体又保护环境……除此之外,还有很多很多,只要我们从小事做起,积少成多,积沙成塔,就一定会让地球重还以前的面貌。 让我们为地球的将来而奋斗吧! 保护环境小学生作文篇三
迷失作文(3篇)
迷失作文(3篇) 小四郭敬明,这个绽放着神一样的光彩,需要人们去仰望,去膜拜的人,拥有着沉默的华丽,像一颗遥远的恒星,可望不可及。 他一个人,代表着一个时代,张扬而颓废的80后,就像ck一样,那么神秘,那么哥特式;就像乱感觉(missfeel)一样,带着我去享受咖啡厅中弥漫的卡布奇诺香;就像哈狗帮(hotdog)让我体会《九局下半》,让我在人生的棒球场上,冲刺一垒,盗向二磊,跑过三垒,再回到本垒。 他们,是哥特式的80后。 麻吉弟弟,这个嘻哈的传奇,他像一个奇迹,从亚洲到洛杉矶,所有人都为他着迷。他是正宗的90后,他带给这个时代的,就是嘻哈和活力。 他有着别人没有的活力,他有着别人没有的自信,他相信他能改变一个时代,带着我们又一次从球迷的地位穿上新的球衣。 我们,是非主流的90后。 日本青少年心里辅导专家用一句中国的俗语来形容我们:大难临头各自飞。 如果,他们看到这些人在大灾难中的舍己为人,看到他们在帮助别人的齐心协力,又会怎么说? 我们,被时代遗弃过,但是,80后90后也许永远在同一挂,
敢做敢想,营养一下发霉的理想,我们不是纸风筝,要被人操纵方向! 肩并肩,手拉手,我们喊一声:加油! 我们能!引领新的潮流! 我们能!改变世俗眼光! 我们能! 迷失作文(2)这是一个老实人过少的时代,岁月的磨石已经能细微到将我们的生活规律打破,这些年发生的人与事使人心中满是戒备。就算有的人表情严肃,也绝不能相信。一定要仔细瞅他们的眼神,洞察他们心中所想,推测出他们将要做些什么。即使这样谨慎,有时也难摆脱被骗的结局。 然而对于一年前的兰姐,我可以十分放心。毫无戒备地与他相处。 我们是刚上初中才认识的,他那时个子不高,但很胖。黝黑的皮肤看起来很土气,脸上不时漾起粗糙的微笑,他笑时嘴角总是向后咧。这样便露出了洁白的牙,映衬着他的黑色皮肤,又眯缝着双眼,整体上会使人愉悦。 那时候,大家都做好奋发读书的准备,每天上课都精力充沛地盯住黑板。一是给老师留个好的第一印象,二是在新同学中能有个好地位。那时的课堂很活跃、很有生机,甚至每提出一个问题全班同学都要举手回答。 而现在上课时全班只有我和兰姐举手发言了,老师在台上充满激情地讲课,众人在台下迷迷糊糊地趴着,完全混沌状态。整个班
保护环境从我做起小学生作文10篇
保护环境从我做起小学生作文10篇 大地期盼着绿色、河流期盼着绿色、水鸟期盼着绿色、花儿期盼着绿色。滴水成川,积土成山,保护环境,从你我做起。下面是小编为大家整理的保护环境从我做起小学生作文10篇,以供大家参考借鉴! 保护环境从我做起范文一 地球是我们的家园,我们人类应该保护地球。可是如今,由于经济利益的吸引,人们不顾一切地开采地球宝的贵资源,违背自然规律,破坏生态平衡,我们已经不断遭受大自然的惩罚。 今年3月,我看了一个电视专题片《沙尘暴》,讲述了我国西部甘肃武威1995年5月5日遭到百年不遇的强烈黑风暴的袭击。遭到巨大的损失,大面积农田绝收,基础设施遭到严重破坏,人员伤亡惨重。其中有15名同学在放学路上被风卷入水渠中冲走。近几天,我有看到报道,甘肃民勤县也遭受了于1995年武威黑风暴同样的厄运。 这两件事给我们人类敲响了警钟,我们再也不能迟疑了。全国人类应该立即行动起来,保护我们的家园,再也不要出现在武威、民勤的这种危害人类的事发生。 作为一名小学生,我们怎样才能保护好我们的家园呢?我认为,作为一名少先队员应该从我做起,从小事做起。首先,保护我们周围的环境,讲究卫生,不乱扔废弃物,不乱倒垃圾,爱护花草树木,保持校园环境干净整洁。其次,保护我们周围的环境,建立绿色环保少
年岗,植树造林,控制土地沙漠化,扩大绿地面积。制止乱砍滥伐,保护植被,防风固沙,保护野生动物,合理开发利用水资源。 只有每个人都齐心协力,齐抓共管,才能使明天的家园变的更加美好! 保护环境从我做起范文二 从前,在遥远的海洋上有一座美丽的小岛。那里鸟语花香、溪水潺潺,一年四季秀丽无比。于是,许许多多的小动物都从四面八方搬到岛上来生活。 可是,不久又搬来一些小动物,他们用锋利的斧头乱砍伐树木。它们用树木造犁,盖起一栋栋楼房,还有一些树木变成了应有尽有的家具,变成了各式各样的工具 小岛的环境越来越差,树木一棵棵、一片片地飞速减少,裸露的土地不断扩大。小鸟飞走了,蜜蜂飞走了小岛变得死气沉沉,还差一点在一次暴风雨中被海水卷走。小岛连续发生了几次泥石流,居民们整体过着提心吊胆的日子。 小动物们觉得再也不能这样继续破坏小岛环境了,大家必须为小岛做些什么。一天,小牛代表严肃地告诉大家:大家要少砍树,多栽树,不然,我们以后就没有家了。于是小动物们每天都种几棵树。一年年,一代代,小动物们种的小树长成了高高的大树,小岛又有了一棵棵高大的树木。 小鸟飞回来了,叽叽喳喳地叫着,仿佛在感谢小动物给它一个美丽的新家园。