Genome-Wide Analysis in Vivo of Translation with Nucleotide Resolution Using Ribosome Profiling
Genome-Wide Analysis in Vivo of Translation with Nucleotide
Resolution Using Ribosome Profiling
Nicholas T.Ingolia,*Sina Ghaemmaghami,?John R.S.Newman,Jonathan S.Weissman Techniques for systematically monitoring protein translation have lagged far behind methods for measuring messenger RNA (mRNA)levels.Here,we present a ribosome-profiling strategy that is based on the deep sequencing of ribosome-protected mRNA fragments and enables genome-wide investigation of translation with subcodon resolution.We used this technique to monitor
translation in budding yeast under both rich and starvation conditions.These studies defined the protein sequences being translated and found extensive translational control in both determining absolute protein abundance and responding to environmental stress.We also observed distinct phases during translation that involve a large decrease in ribosome density going from early to late peptide elongation as well as widespread regulated initiation at non –adenine-uracil-guanine (AUG)codons.Ribosome profiling is readily adaptable to other organisms,making high-precision investigation of protein translation experimentally accessible.T
he ability to monitor the identity and quantity of proteins that a cell produces would inform nearly all aspects of biology.Microarray-based measurements of mRNA abundance have revolutionized the study of gene expression (1).However,for several reasons there is a critical need for techniques that directly monitor protein synthesis.First,mRNA levels are an imperfect proxy for protein production because mRNA trans-lation is subject to extensive regulation (2–4).Second predicting the exact protein product from the transcript sequence is not possible because of effects such as internal ribosome entry sites,ini-tiation at non-AUG codons,and nonsense read-through (5,6).Finally,programmed ribosomal pausing during protein synthesis is thought to aid the cotranslational folding and secretion of some proteins (7–9).
Polysome profiling,in which mRNAs are recovered from translating ribosomes for subse-quent microarray analysis,can provide a useful estimate of protein synthesis (10).However,this approach suffers from limited resolution and accuracy.Additionally,upstream open reading frames (uORFs)—short translated sequences found in the 5′untranslated region (5′UTR)of many genes —result in ribosomes that are bound to an mRNA and yet are not translating the en-coded gene (11).Advances in quantitative proteo-mics circumvent some of these problems (2,3),but there currently are substantial limits on their
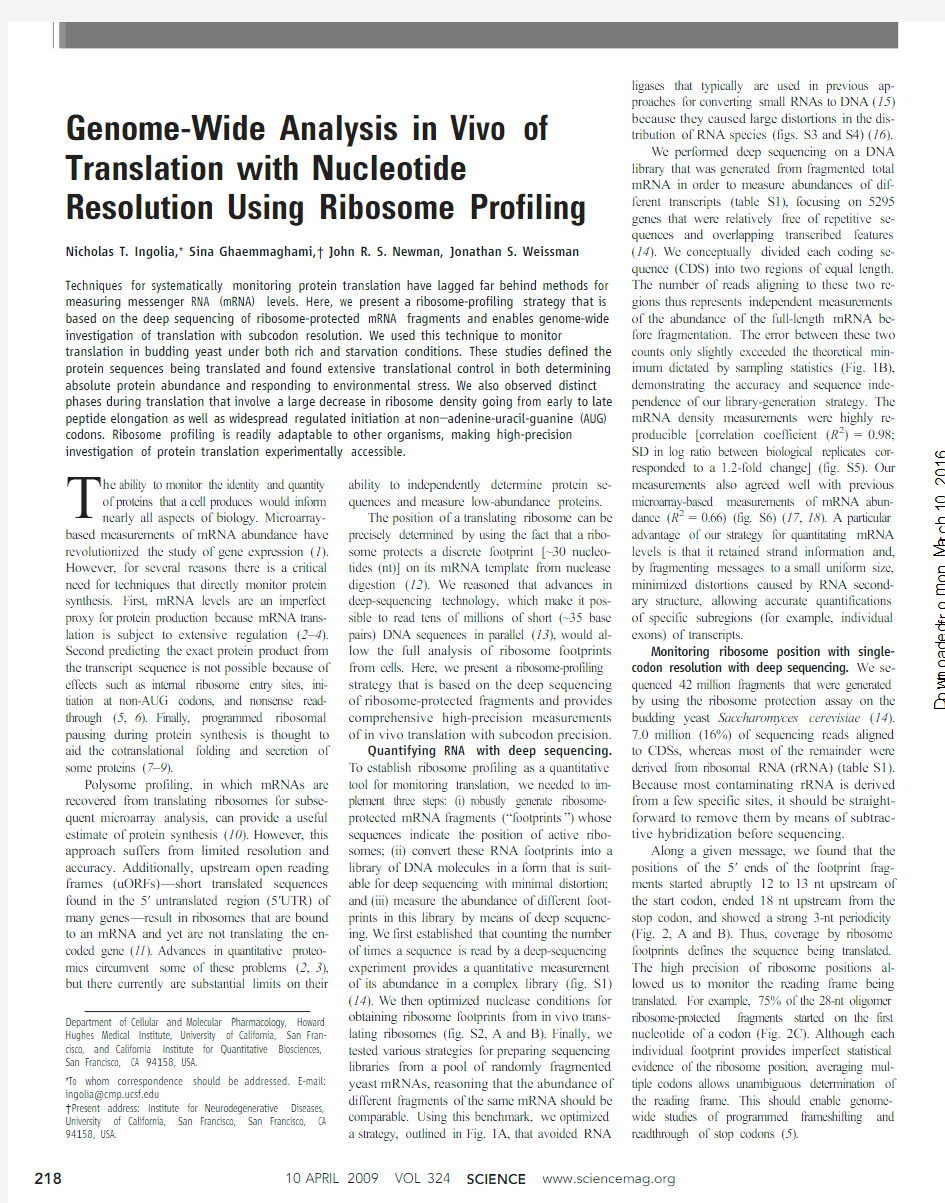
ability to independently determine protein se-quences and measure low-abundance proteins.The position of a translating ribosome can be precisely determined by using the fact that a ribo-some protects a discrete footprint [~30nucleo-tides (nt)]on its mRNA template from nuclease digestion (12).We reasoned that advances in deep-sequencing technology,which make it pos-sible to read tens of millions of short (~35base pairs)DNA sequences in parallel (13),would al-low the full analysis of ribosome footprints from cells.Here,we present a ribosome-profiling strategy that is based on the deep sequencing of ribosome-protected fragments and provides comprehensive high-precision measurements of in vivo translation with subcodon precision.Quantifying RNA with deep sequencing.To establish ribosome profiling as a quantitative tool for monitoring translation,we needed to im-plement three steps:(i)robustly generate ribosome-protected mRNA fragments (“footprints ”)whose sequences indicate the position of active ribo-somes;(ii)convert these RNA footprints into a library of DNA molecules in a form that is suit-able for deep sequencing with minimal distortion;and (iii)measure the abundance of different foot-prints in this library by means of deep sequenc-ing.We first established that counting the number of times a sequence is read by a deep-sequencing experiment provides a quantitative measurement of its abundance in a complex library (fig.S1)(14).We then optimized nuclease conditions for obtaining ribosome footprints from in vivo trans-lating ribosomes (fig.S2,A and B).Finally,we tested various strategies for preparing sequencing libraries from a pool of randomly fragmented yeast mRNAs,reasoning that the abundance of different fragments of the same mRNA should be https://www.360docs.net/doc/f84299916.html,ing this benchmark,we optimized a strategy,outlined in Fig.1A,that avoided RNA
ligases that typically are used in previous ap-proaches for converting small RNAs to DNA (15)because they caused large distortions in the dis-tribution of RNA species (figs.S3and S4)(16).We performed deep sequencing on a DNA library that was generated from fragmented total mRNA in order to measure abundances of dif-ferent transcripts (table S1),focusing on 5295genes that were relatively free of repetitive se-quences and overlapping transcribed features (14).We conceptually divided each coding se-quence (CDS)into two regions of equal length.The number of reads aligning to these two re-gions thus represents independent measurements of the abundance of the full-length mRNA be-fore fragmentation.The error between these two counts only slightly exceeded the theoretical min-imum dictated by sampling statistics (Fig.1B),demonstrating the accuracy and sequence inde-pendence of our library-generation strategy.The mRNA density measurements were highly re-producible [correlation coefficient (R 2)=0.98;SD in log ratio between biological replicates cor-responded to a 1.2-fold change](fig.S5).Our measurements also agreed well with previous microarray-based measurements of mRNA abun-dance (R 2=0.66)(fig.S6)(17,18).A particular advantage of our strategy for quantitating mRNA levels is that it retained strand information and,by fragmenting messages to a small uniform size,minimized distortions caused by RNA second-ary structure,allowing accurate quantifications of specific subregions (for example,individual exons)of transcripts.
Monitoring ribosome position with single-codon resolution with deep sequencing.We se-quenced 42million fragments that were generated by using the ribosome protection assay on the budding yeast Saccharomyces cerevisiae (14).7.0million (16%)of sequencing reads aligned to CDSs,whereas most of the remainder were derived from ribosomal RNA (rRNA)(table S1).Because most contaminating rRNA is derived from a few specific sites,it should be straight-forward to remove them by means of subtrac-tive hybridization before sequencing.
Along a given message,we found that the positions of the 5′ends of the footprint frag-ments started abruptly 12to 13nt upstream of the start codon,ended 18nt upstream from the stop codon,and showed a strong 3-nt periodicity (Fig.2,A and B).Thus,coverage by ribosome footprints defines the sequence being translated.The high precision of ribosome positions al-lowed us to monitor the reading frame being translated.For example,75%of the 28-nt oligomer ribosome-protected fragments started on the first nucleotide of a codon (Fig.2C).Although each individual footprint provides imperfect statistical evidence of the ribosome position,averaging mul-tiple codons allows unambiguous determination of the reading frame.This should enable genome-wide studies of programmed frameshifting and readthrough of stop codons (5).
Department of Cellular and Molecular Pharmacology,Howard Hughes Medical Institute,University of California,San Fran-cisco,and California Institute for Quantitative Biosciences,San Francisco,CA 94158,USA.
*To whom correspondence should be addressed.E-mail:ingolia@https://www.360docs.net/doc/f84299916.html,
?Present address:Institute for Neurodegenerative Diseases,University of California,San Francisco,San Francisco,CA 94158,USA.
RESEARCH ARTICLE
10APRIL 2009VOL 324
SCIENCE
https://www.360docs.net/doc/f84299916.html,
218o n M a r c h 10, 2016
D o w n l o a d e d f r o m
Genome-wide measurements of translation. We next sought to use ribosome profiling data to quantify the rate of protein synthesis.We estimated protein expression from the density of ribosome footprints(14),although further improvements could incorporate variations in the speed of translation along a message(see below).From7.0million footprint sequences, we were able to measure the translation of4648 of5295genes with a precision(fig.S7)and re-producibility comparable with our mRNA abun-dance measure(R2=0.98;~20%error between biological replicates)(Fig.2D).
Comparing the rate of translation with mRNA abundance from the same samples revealed a roughly100-fold range of translation efficiency (as measured by the ratio of ribosome footprints to mRNA fragments)between different yeast genes,in addition to a subset of transcripts that were translationally inactive(Fig.2E and fig. S8A).Thus,differences in translational efficiency,which are invisible to mRNA abundance mea-
surements,contribute substantially to the dynamic
range of gene expression(table S2).
The rate of protein synthesis is expected to be
a better predictor of protein abundance than mea-
surements of mRNA levels.Indeed,estimates
of the absolute abundance of proteins from
proteome-wide mass spectrometry had a correla-
tion coefficient of R2=0.42with our translation-
rate measurements versus R2=0.17with our
mRNA abundance(fig.S9)(19).Differences in
protein stability contribute to the imperfect cor-
relation between the rate of a protein’s synthesis
and its steady-state levels.Thus,comparison be-
tween changes in synthesis measured by ribo-
some profiling and abundance measured by mass
spectrometry should reveal examples of the
regulated degradation of proteins(19).
Ribosome profiling reveals different phases
of translation.Previous polysome studies found
that shorter genes tended to have a higher ribo-
some density(10).We saw a similar,though
weaker,trend and an overall agreement between
ribosome profiling and polysome profiling(figs.
S8B and S10).This phenomenon was surprising
because it suggested that the rate of translation
initiation was sensitive to the total length of the
gene,thus causing shorter messages to be better
translated.Alternatively,there may be a higher
ribosome density in a region of constant length
at the start of each gene,which would contribute
a larger fraction of the total ribosome occupancy
for shorter genes.However,a previous study
found no evidence for higher ribosome density
at the5′end of six individual mRNAs(20).
Our genome-wide position-specific measure-
ments of ribosome occupancy let us test this pos-
sibility more broadly.An averaging over hundreds
of well-translated genes revealed considerably
greater(approximately threefold)ribosome den-
sity for the first30to40codons(Fig.2F),which
after100to200codons relaxed to a uniform
Fig.1.Quantifying mRNA abundance and ribosome footprints by means of deep sequencing.(A)Schematic of the protocol for convert-
ing ribosome footprints or randomly fragmented mRNA into a deep-sequencing li-brary.(B)Internal reprodu-cibility of mRNA-abundance measurements.CDSs were conceptually divided as shown,and the mRNA counts on the two regions are plotted.The error esti-mate is based on the c2
statistic.
https://www.360docs.net/doc/f84299916.html, SCIENCE VOL32410APRIL2009219
RESEARCH ARTICLE
density that persisted until translation termi-nation(fig.S11A).The excess of ribosomes at the start of genes explained the higher ribosome density on shorter genes and was not an arti-fact of immobilizing ribosomes with cyclohex-imide treatment or stalled ribosomes on the5′end of genes(fig.S12).Elevated5′ribosome density appears to be a general feature of trans-lation that is independent of the length of the CDS,its translation level,and the presence of an N-terminal signal sequence(fig.S11,B to D). Correcting the estimate of protein-synthesis rates for this effect substantially improved the corre-lation with protein abundance(R2=0.60versus R2=0.42)(fig.S13).This argues that the de-crease in ribosome density along a transcript
results from either increases in the rate of trans-
lation elongation and/or premature translation
termination.
Codon-specific measurements of ribosome
positions.Ribosome profiling reports on the pre-
cise positions of ribosomes,making it possible
to delineate what parts of a transcript are being
decoded.Almost all(98.8%)of the ribosome
footprints in our data set mapped to protein-
coding regions.Nonetheless,this left56,105un-
explained footprints,which probably represent
true translation events because they copurified
with the80S ribosomes.Furthermore,they were
far more common in the5′UTRs(Fig.3A),where-
as we expect background resulting from the
spurious capture of RNAs to be evenly distrib-
uted across transcripts.Introns and3′UTRs,in
particular,typically had less than1%of the
ribosome density seen in a CDS(fig.S14),and
most had no observed footprints.The absence
of reads in unspliced introns indicates that the
intronic regions detected from mRNA sequenc-
ing experiments(21)are rarely translationally
active;thus,ribosome profiling can simplify the
analysis of expression of spliced genes.
In contrast,about one quarter of the5′UTRs
showed substantial translational activity,in many
cases comparable to that of CDSs(Fig.3B).One
source of translation in5′UTRs is the
presence
Fig.2.Ribosome footprints provide a codon-specific measurement of trans-
lation.(A)Total number of ribosome footprints falling near the beginning or
end of CDSs.(B)The offset between the start of the footprint and the P-and
A-site codons at translation initiation and termination(34).(C)Position of28-nt
ribosome footprints relative to the reading frame.(D)Ribosome footprint
densities in two complete biological replicates.Density in terms of reads per
kilobase per million(rpkM)is corrected for total reads and CDS length(21).
(Inset)Histogram of log2ratios between replicates for genes with low counting
statistics error(fig.S7)along with the normal error curve(mean=0.084,SD=
0.291in log2units;s is SD expressed as a fold change).(E)Histogram of
translational efficiency,the ratio of ribosome footprint density to mRNA density.
The error shows actual ratios between biological replicates(SD=0.367in log2
units).(F)Read density as a function of position.Well-expressed genes were
each individually normalized and then averaged with equal weight(14).
10APRIL2009VOL324SCIENCE https://www.360docs.net/doc/f84299916.html,
220
RESEARCH ARTICLE
of uORFs,short translated reading frames up-stream of the CDS that can play an important role in translational regulation(11).We identi-fied1048candidate uORFs in the yeast genome on the basis of the presence of an upstream AUG codon(table S3)(22,23).We focused on the86 upstream AUG codons in the most abundant messages(14),in which we could reliably quan-tify even low levels of translation.Among this set,only20of the uORFs were well-translated, a prominent example being ICY1(Fig.3C and table S4).More broadly,among all annotated 5′UTRs we found evidence for the translation of153uORFs(table S5),fewer than30of which
had previously been experimentally evaluated.
Nonetheless,these uORFs account for only a
fraction of the706genes in which we found
substantial translation in the5′UTR.Some genes,
such as PRE2and PDR5,had a discrete region
of ribosome density that was terminated by a
stop codon but lacked an AUG codon(Fig.3D
and fig.S15).In both cases,the translated re-
gion could be accounted for by initiation at a
UUG codon.There are two known examples in
which translation initiates at a non-AUG codon
in yeast,the tRNA synthetases GRS1(24)and
ALA1(25),and both are apparent in our data(fig.
S16).Initiation at non-AUG codons is strongly
dependent on the surrounding sequence context
(26),in contrast to canonical initiation in yeast
(27),and the non-AUG initiation sites in PRE2
and PDR5both match an experimentally verified
strong initiation sequence(26).
On the basis of this finding,we searched for
other candidate non-AUG initiation sites where
a codon with a single mismatch against AUG
had a favorable initiation context(14).Most of
these start sites would lead to short uORFs,as
seen in PRE2and PDR5,although there was
Fig.3.Ribosome occu-pancy of upstream open-reading frames and other sequences.(A)Density of mRNA fragments and ribosome footprints on non–protein-coding se-quences relative to the associated CDS.(B)His-togram of translational efficiencies for different classes of sequences.(C) Ribosome and mRNA den-sity showing the uORF in the ICY15′UTR.(D)Ribo-some and mRNA density showing non-AUG uORFs in the PRE25′UTR.The proposed AAAUUG trans-lational initiation site is shown along with the subsequent open reading frame and stop codon (indicated by a vertical
line).
Fig.4.Translational response to starvation.(A)Changes in mRNA abun-dance and translational efficiency in response to starvation.(B)Distribution of translational efficiency changes in response to starvation.Measurement error was estimated from the actual distribution of ratios between biological replicates.A false discovery rate threshold of10%corresponds to a twofold change in translational efficiency.
https://www.360docs.net/doc/f84299916.html, SCIENCE VOL32410APRIL2009221
RESEARCH ARTICLE
evidence for N-terminal extensions in a few genes,including the cyclin CLB1(fig.S17).In aggregate,these1615predicted uORFs had a much greater(approximately threefold)trans-lational efficiency than other regions of5′UTRs, particularly when the start codon differed from AUG at the first position(approximately six-fold;see below).We found a strong bias for28-nucleotide oligomer footprints to align with the predicted reading frame just downstream of these non-AUG initiation sites,which is similar to the effect we saw in protein-coding genes(fig S18).
Furthermore,when elongation was not in-hibited,ribosome footprints were depleted from 5′UTRs just as they were from the beginning of
protein-coding genes,indicating that they were
active ribosomes capable of runoff elongation(fig.
S19).Overall,we found143non-AUG uORFs
with evidence of translation(table S6),which
account for20%of5′UTR ribosome footprints.
Thus,there is pervasive initiation at specific,fa-
vorable,non-AUG sites.
Translational responses to starvation.The
ability to evaluate rates of translation as well as
mRNA abundance with high precision enables
quantitative measurements of translational reg-
ulation.Acute amino acid starvation in yeast
produces substantial transcriptional and transla-
tional changes(28),including a global decrease
in translational initiation(29).We subjected yeast
to20min of amino acid deprivation and made
ribosome-footprint and mRNA-abundance mea-
surements(fig.S20).We then compared starva-
tion and log-phase growth measurements for the
3769genes for which statistical counting error
did not compromise our ability to detect transla-
tional regulation(Fig.4A and fig.S7).One-third
of the genes showed changes in relative transla-
tional efficiency upon starvation(fig.S21),with
291strongly affected(greater than twofold)genes
(Fig.4B and table S7).Forty-three of the111
down-regulated genes(P<10?40)are involved in
Fig.5.Changes in5′UTR translation during starva-
tion.(A)Ribosome and mRNA densities in the GCN45′UTR in repressive and inducing conditions.
The four known uORFs are indicated along with the proposed initiation sites for upstream trans-lation.(B)Non-AUG uORF upstream of GCN4.Shown is an enlargement of the gray boxed area in(A).
(C)Ribosome occupancy of noncoding sequences. The number of ribosome footprints mapping to dif-ferent classes of regions is shown relative to the number of CDS reads.(D) Aggregate translational efficiency of uORFs(14
).
10APRIL2009VOL324SCIENCE https://www.360docs.net/doc/f84299916.html, 222
RESEARCH ARTICLE
ribosome biogenesis(Fig.4A and table S8),a process that is repressed at many different levels in response to stresses such as starvation(30,31).
The fraction of each gene’s mRNA that is associated with polysomes had previously been used to provide a semiquantitative measurement of translational efficiency(32).Many ribosome biogenesis transcripts leave the polysome frac-tion in response to starvation,in agreement with our observations,and changes in polysome asso-ciation were significantly correlated with changes in translation that were measured with ribosome profiling(up-regulated genes,P<10?12and down-regulated genes,P<10?6)(fig.S22).Ribosome profiling also allowed us to detect the sevenfold translational induction of GCN4,a well-studied and translationally regulated gene(29)whose re-sponse to starvation was not detected by the earlier polysome studies(32).
The regulation of GCN4translation results from four uORFs in its5′UTR[reviewed in(29)]. During log-phase growth,we saw translation of GCN4uORF1,along with some translation of
uORFs2to4,but very little translation of the main GCN4CDS(Fig.5A).This pattern of ribo-some occupancy is consistent with the standard model of GCN45′UTR function,in which uORF 1is constitutively translated but permissive for downstream reinitiation.In log-phase growth,re-initiation occurs at uORFs2to4rather than at GCN4itself.Upon starvation,however,reinitia-tion bypasses uORFs2to4and reaches the main CDS,thereby relieving the translational repres-sion of GCN4.Indeed,we saw a decrease in ribosome occupancy of the repressive uORFs as well as an increase in translation of the protein-coding region upon starvation.Unexpectedly, we also observed additional translation in the 5′UTR upstream of the characterized uORFs.This region was detectably translated even in log-phase growth,and its translation was greatly enhanced under starvation(Fig.5B).Most translation in this region started from a noncanonical AAA AUA site,although there was also initiation from an upstream in-frame noncanonical UUU UUG site. Sequences overlapping this region are required for proper translational regulation by uORF1(33), which supports the idea of these non-AUG uORFs having a functional role.
More broadly,during starvation we found a large(sixfold)increase in the fraction of ribo-some footprints derived from5′UTRs but little change in introns(Fig.5C).There was also a less pronounced increase in ribosome occupancy of3′UTRs,although the overall density remained low.The non-AUG uORFs showed a particu-larly dramatic increase in ribosome occupancy during starvation,apparently exceeding the trans-lation not only of canonical AUG uORFs but of the CDSs themselves(Fig.5D).Non-AUG uORFs upstream of genes such as GLN1and PRE9, which were marginally translated during log-phase growth,had much higher ribosome densi-ties after starvation(figs.S23and S24).However, even in the case of GLN1,it is clear that no single uORF can account for the entire distribution of
ribosomes on the5′UTR.Instead,there is a more
general change in the stringency of initiation codon
selection that favors certain noncanonical start
sites but has broader effects as well(fig.S25).
The initiation factor eIF2a,whose phosphoryl-
ation mediates the effect of starvation on trans-
lation(29),also has a prominent role in initiator
codon selection(34)and thus may contribute to
this relaxation.
Perspective.Ribosome profiling greatly in-
creases our ability to quantitatively monitor protein
production,as is underscored by our consider-
ably improved predictions of protein abundance.
This technique should become a central tool in
the repertoire available for studying the internal
state of cells.The basic strategy is readily adapt-
able to other organisms,including mammals,and
it can allow tissue-specific translational profil-
ing by using the restricted expression of epitope-
tagged ribosomes(35).Immediate applications
of ribosome profiling include studies of the trans-
lational control of gene expression and molec-
ular characterization of disease states such as
cancer,in which associated cellular stress will
probably directly affect translation(36).Addi-
tionally,the ability to determine precisely what
regions of a message are being decoded should
greatly aid efforts to experimentally define the
full proteome of complex organisms such as
humans.
Our approach also allows in-depth analysis
of the process of translation in vivo.For exam-
ple,ribosome profiling revealed an unanticipated
complexity to translation that leads to differences
in ribosome density along the length of CDSs.
This presumably reflects differences in the func-
tional states of the ribosome that affect its rate of
elongation or processivity.The switch from the
early to the late elongation phase begins with
the first emergence of the nascent peptide from
the ribosome,allowing interactions between the
nascent chain and molecular chaperones(37).
Measurements of the effects of starvation on
translational activity also revealed widespread
and regulated initiation at non-AUG codons,sug-
gesting a new effect of the well-studied eIF2a-
mediated stress response.Finally,high-resolution
gene-specific ribosome density profiles will
enable efforts to explore how variations in the
rate of translation,as well as effects such as ribo-
somal pausing,modulate protein synthesis and
folding.
References and Notes
1.P.O.Brown,D.Botstein,Nat.Genet.21,33(1999).
2.D.Baek et al.,Nature455,64(2008).
3.M.Selbach et al.,Nature455,58(2008).
4.N.Sonenberg,A.G.Hinnebusch,Mol.Cell28,721
(2007).
5.O.Namy,J.P.Rousset,S.Napthine,I.Brierley,Mol.Cell
13,157(2004).
6.C.Touriol et al.,Biol.Cell95,169(2003).
7.A.A.Komar,T.Lesnik,C.Reiss,FEBS Lett.462,387
(1999).
https://www.360docs.net/doc/f84299916.html,kkaraju,C.Mary,A.Scherrer,A.E.Johnson,
K.Strub,Cell133,440(2008).
9.S.L.Wolin,P.Walter,EMBO J.7,3559(1988).
10.Y.Arava et al.,Proc.Natl.Acad.Sci.U.S.A.100,3889
(2003).
11.H.A.Meijer,A.A.Thomas,Biochem.J.367,1(2002).
12.J.A.Steitz,Nature224,957(1969).
13.D.R.Bentley et al.,Nature456,53(2008).
14.Materials and methods are available as supporting
material on Science Online.
15.E.Berezikov,E.Cuppen,R.H.Plasterk,Nat.Genet.38
(suppl.),S2(2006).
16.E.Romaniuk,L.W.McLaughlin,T.Neilson,P.J.Romaniuk,
Eur.J.Biochem.125,639(1982).
17.F.C.Holstege et al.,Cell95,717(1998).
18.U.Nagalakshmi et al.,Science320,1344(2008).
19.L.M.de Godoy et al.,Nature455,1251(2008).
20.Y.Arava,F.E.Boas,P.O.Brown,D.Herschlag,Nucleic
Acids Res.33,2421(2005).
21.A.Mortazavi,B.A.Williams,K.McCue,L.Schaeffer,
B.Wold,Nat.Methods5,621(2008).
22.C.Vilela,J.E.McCarthy,Mol.Microbiol.49,859
(2003).
23.Z.Zhang,F.S.Dietrich,Curr.Genet.48,77(2005).
24.K.J.Chang,C.C.Wang,J.Biol.Chem.279,13778
(2004).
25.H.L.Tang et al.,J.Biol.Chem.279,49656(2004).
26.S.J.Chen,G.Lin,K.J.Chang,L.S.Yeh,C.C.Wang,
J.Biol.Chem.283,3173(2008).
27.H.Yoon,T.F.Donahue,Mol.Microbiol.6,1413
(1992).
28.A.G.Hinnebusch,Microbiol.Rev.52,248(1988).
29.A.G.Hinnebusch,Annu.Rev.Microbiol.59,407
(2005).
30.P.Jorgensen et al.,Genes Dev.18,2491(2004).
31.J.A.Pleiss,G.B.Whitworth,M.Bergkessel,C.Guthrie,
Mol.Cell27,928(2007).
32.J.B.Smirnova et al.,Mol.Cell.Biol.25,9340(2005).
33.C.M.Grant,https://www.360docs.net/doc/f84299916.html,ler,A.G.Hinnebusch,Nucleic Acids
Res.23,3980(1995).
34.L.D.Kapp,J.R.Lorsch,Annu.Rev.Biochem.73,657(2004).
35.M.Heiman et al.,Cell135,738(2008).
36.M.Holcik,N.Sonenberg,Nat.Rev.Mol.Cell Biol.6,318
(2005).
37.R.J.Nelson,T.Ziegelhoffer,C.Nicolet,M.Werner-Washburne,
E.A.Craig,Cell71,97(1992).
38.We thank C.Chu,J.deRisi,and K.Fischer for help with
sequencing;D.Bartel,H.Guo,D.Herschlag,J.Hollien,
S.Luo,and G.Schroth for helpful discussions of RNA
methods;P.Walter and T.Aragon for the use of a density
gradient fractionator;the2008Woods Hole Physiology
course students for data analysis;and members of the
Weissman lab,https://www.360docs.net/doc/f84299916.html,reau,and T.Ingolia for critical
commentary on the manuscript.Sequencing data have
been deposited in the National Center for Biotechnology
Information's Gene Expression Omnibus(www.ncbi.nlm.
https://www.360docs.net/doc/f84299916.html,/geo/)under accession number GSE13750.This
investigation was supported by a NIH P01grant
(AG10770)and a Ruth L.Kirschstein National Research
Service Award(GM080853)(to N.T.I.)and by the Howard
Hughes Medical Institute(to J.S.W.).N.T.I.and J.S.W.are
the inventors on a patent application,assigned to the
Regents of the University of California,on the ribosome
profiling and sequencing library generation techniques
described in this work.S.G.and J.R.S.N.developed a
microarray-based approach that served as a proof of
principle for the present studies;N.T.I.and J.S.W.
designed the experiments;N.T.I.performed the
experiments and analyzed the data;and N.T.I.and
J.S.W.interpreted the results and wrote the manuscript.
Supporting Online Material
https://www.360docs.net/doc/f84299916.html,/cgi/content/full/1168978/DC1
Materials and Methods
Figs.S1to S25
Tables S1to S8
References
25November2008;accepted30January2009
Published online12February2009;
10.1126/science.1168978
Include this information when citing this paper.
https://www.360docs.net/doc/f84299916.html, SCIENCE VOL32410APRIL2009223
RESEARCH ARTICLE
DOI: 10.1126/science.1168978
, 218 (2009);
324 Science et al.Nicholas T. Ingolia Resolution Using Ribosome Profiling Genome-Wide Analysis in Vivo of Translation with Nucleotide
This copy is for your personal, non-commercial use only.
clicking here.colleagues, clients, or customers by , you can order high-quality copies for your If you wish to distribute this article to others
here.following the guidelines can be obtained by Permission to republish or repurpose articles or portions of articles
): March 9, 2016 https://www.360docs.net/doc/f84299916.html, (this information is current as of The following resources related to this article are available online at
/content/324/5924/218.full.html version of this article at:
including high-resolution figures, can be found in the online Updated information and services, /content/suppl/2009/02/11/1168978.DC1.html
can be found at: Supporting Online Material
/content/324/5924/218.full.html#ref-list-1, 10 of which can be accessed free:cites 36 articles This article 35 article(s) on the ISI Web of Science cited by This article has been
/content/324/5924/218.full.html#related-urls 100 articles hosted by HighWire Press; see:cited by This article has been
/cgi/collection/molec_biol Molecular Biology
subject collections:This article appears in the following registered trademark of AAAS.
is a Science 2009 by the American Association for the Advancement of Science; all rights reserved. The title Copyright American Association for the Advancement of Science, 1200 New York Avenue NW, Washington, DC 20005. (print ISSN 0036-8075; online ISSN 1095-9203) is published weekly, except the last week in December, by the Science o n M a r c h 10, 2016
D o w n l o a d e d f r o m
研究蛋白质与蛋白质相互作用方法总结-实验步骤
研究蛋白质与蛋白质相互作用方法总结-实验步骤 蛋白质与蛋白质之间相互作用构成了细胞生化反应网络的一个主要组成部分,蛋白-蛋白互作网络与转录调控网络对调控细胞及其信号有重要意义。把原来spaces空间上的一篇蛋白质与蛋白质间相互作用研究方法转来,算是实验技巧分类目录的首篇。(另补充2:检测两种蛋白质之间相互作用的实验方法比较) 一、酵母双杂交系统 酵母双杂交系统是当前广泛用于蛋白质相互作用组学研究的一种重要方法。其原理是当靶蛋白和诱饵蛋白特异结合后,诱饵蛋白结合于报道基因的启动子,启动报道基因在酵母细胞内的表达,如果检测到报道基因的表达产物,则说明两者之间有相互作用,反之则两者之间没有相互作用。将这种技术微量化、阵列化后则可用于大规模蛋白质之间相互作用的研究。在实际工作中,人们根据需要发展了单杂交系统、三杂交系统和反向杂交系统等。Angermayr等设计了一个SOS蛋白介导的双杂交系统。可以研究膜蛋白的功能,丰富了酵母双杂交系统的功能。此外,酵母双杂交系统的作用也已扩展至对蛋白质的鉴定。 二、噬茵体展示技术 在编码噬菌体外壳蛋白基因上连接一单克隆抗体的DNA序列,当噬菌体生长时,表面就表达出相应的单抗,再将噬菌体过柱,柱上若含目的蛋白,就会与相应抗体特异性结合,这被称为噬菌体展示技术。此技术也主要用于研究蛋白质之间的相互作用,不仅有高通量及简便的特点,还具有直接得到基因、高选择性的筛选复杂混合物、在筛选过程中通过适当改变条件可以直接评价相互结合的特异性等优点。目前,用优化的噬菌体展示技术,已经展示了人和鼠的两种特殊细胞系的cDNA文库,并分离出了人上皮生长因子信号传导途径中的信号分子。 三、等离子共振技术 表面等离子共振技术(Surface Plasmon Resonance,SPR)已成为蛋白质相互作用研究中的新手段。它的原理是利用一种纳米级的薄膜吸附上“诱饵蛋白”,当待测蛋白与诱饵蛋白结合后,薄膜的共振性质会发生改变,通过检测便可知这两种蛋白的结合情况。SPR技术的优点是不需标记物或染料,反应过程可实时监控。测定快速且安全,还可用于检测蛋白一核酸及其它生物大分子之间的相互作用。
英语中的比较级与最高级 详解
比较级与最高级 1.as...as 与(not) as(so)...as as...as...句型中,as的词性 第一个as是副词,用在形容词和副词的原级前,常译为“同样地”。第二个as是连词,连接与前面句子结构相同的一个句子(相同部分常省略),可译为“同..... He is as tall as his brother is (tall) . (后面的as 为连词) 只有在否定句中,第一个as才可换为so 改错: He is so tall as his brother.(X) 2.在比较状语从句中,主句和从句的句式结构一般是相同的 与as...as 句式中第二个as一样,than 也是连词。as和than这两个连词后面的从句的结构与前面的句子大部分情况下结构是相同的,相同部分可以省略。 He picked more apples than she did. 完整的表达为: He picked more apples than she picked apples. 后而的picked apples和前面相同,用did 替代。 He walked as slowly as she did.完整表达为: He walked as slowly as she walked slowly. she后面walked slowly与前面相同,用did替代。
3.谓语的替代 在as和than 引导的比较状语从句中,由于句式同前面 主句相同,为避免重复,常把主句中出现而从句中又出现的动词用do的适当形式来代替。 John speaks German as fluently as Mary does. 4.前后的比较对象应一致 不管后面连词是than 还是as,前后的比较对象应一致。The weather of Beijing is colder than Guangzhou. x than前面比较对象是“天气”,than 后面比较对象是“广州”,不能相比较。应改为: The weather of Bejing is colder than that of Guangzhou. 再如: His handwriting is as good as me. 应改为: His handwriting is as good as mine. 5.可以修饰比较级的词 常用来修饰比较级的词或短语有: Much,even,far,a little,a lot,a bit,by far,rather,any,still,a great deal等。 by far的用法: 用于强调,意为“...得多”“最最...”“显然”等,可修饰形容词或副词的比较级和最高级,通常置于其后,但是若比较级或最高级前有冠词,则可置于其前或其后。
(完整版)WesternBlot(免疫印迹法)实验方法步骤
Western Blot(免疫印迹法)实验方法步骤 发布日期:2008-8-25 热门指数:4360 Western Blot(免疫印迹法) 主要包括以下4个基本步骤: n 样品制备 n 电泳分离 n 蛋白的膜转移 n 免疫杂交与显色――蛋白检测 溶液和试剂 n 1X 磷酸盐缓冲液(PBS) n Modified RIPA buffer Tris-HCl: 50 mM, pH 7.4 ; NP-40: 1% ;Na-deoxycholate: 0.25% ;NaCl: 150 mM ;EDTA: 1 mM ;P MSF: 1 mM ;Aprotinin, leupeptin, pepstatin: 1 microgram/ml each ;Na3VO4: 1 mM ;NaF: 1 mM n 1X SDS 样品缓冲液 62.5 mM Tris-HCl (pH 6.8 于25°C), 2% w/v SDS, 10%甘油,50 mM DTT, 0.01% w/v溴酚蓝 n 转移缓冲液 25 mM Tris base, 0.2 M 甘氨酸, 20%甲醇(pH 8.3) n 10X Tris缓冲盐(TBS) 准备1L 10X TBS: 24.2 g Tris base, 80 g NaCl;用1N HCl调pH为7.6 n 脱脂奶粉或BSA n 甲醇 n TBS/T缓冲液 1X TBS, 0.1% Tween-20 n 封闭缓冲液(TBS/T)
1X TBS, 0.1% Tween-20加5% w/v脱脂奶粉或BSA n 一抗的稀释 1X TBS, 0.1% Tween-20 加5% BSA (多抗)或5%脱脂奶粉(单抗) Note:一般来说, BSA被推荐用于多克隆抗体,脱脂奶粉用于单克隆抗体,这样可得到较高的信噪比。抗体的稀释度参考抗体说明书或根据实验确定。 n 预染的蛋白质Marker,可用于监测转膜的效率 样品制备 原始样品可为细胞、组织、培养上清、免疫沉淀或亲和纯化的蛋白,以下为定性检测目的蛋白时细胞样品的处理方法,其余的样品制备方法参阅相关文献。 1.培养细胞或药物处理。 2.弃培养基,用1X PBS漂洗细胞2次,去尽残留培养基。 3.加入1X SDS样品缓冲液(6-well plate, 100 μl /w或75 cm2plate, 500-1000 μl/瓶),刮落细胞,转移到Ep管。注意:冰上操作。 4.超声10~15秒剪切DNA以减低样品粘性。 5.煮沸样品5 minutes。 6.离心12000g, 5 min,取上清。 7.电泳分离:上样15μl~20 μl 至SDS-PAGE 胶(10 cm x 10 cm)电泳。 如要定量检测某蛋白的表达水平,应用RIPA裂解液(1 ml per 107cells/100 mm dish/150 cm2flask)裂解细胞,收集裂解液至离心管中,在振荡器上混匀4~15min,14000g离心15min(4℃),弃沉淀,用B radford法或其它蛋白质测定方法测定上清中蛋白浓度以调整上样体积和上样量,进行Western杂交时还需设置内或外参照,通常用beta-actin。 注意:一般上样20~30 μg已足够,如待检蛋白为低丰度蛋白,可加大上样量至100μg,但电泳条带易拖尾,可制备亚细胞组份或采用更敏感的检测方法。 电泳分离(参照SDS-PAGE电泳方法) 转膜 杂交膜的选择是决定Western blot成败的重要环节。应根据杂交方案、被转移蛋白的特性以及分子大小等因素,选择合适材质、孔径和规格的杂交膜。用于Western blot的膜主要有两种:硝酸纤维素膜(NC) 和PVDF膜。NC膜是蛋白印迹实验的标准固相支持物,在低离子转移缓冲液的环境下,大多数带负电荷的蛋白质会与膜发生疏水作用而高亲和力的结合在一起,但在非离子型的去污剂作用下,结合的蛋白还可以被
蛋白质的盐析与透析
蛋白质的盐析与透析 一、实验目的 1.了解蛋白质的分离纯化方法 2.掌握蛋白质的盐析及透析方法 二、实验原理 在蛋白质溶液中加入一定浓度的中性盐,蛋白质即从溶液中沉淀析出,这种作用称为盐析。盐析法常用的盐类有硫酸铵、硫酸钠等。 蛋白质用盐析法沉淀分离后,需脱盐才能获得纯品,脱盐最常用的方法为透析法。蛋白质在溶液中因其胶体质点直径较大,不能透过半透膜,而无机盐及其它低分子物质可以透过,故利用透析法可以把经盐析法所得的蛋白质提纯,即把蛋白质溶液装入透析袋内,将袋口用线扎紧,然后把它放进蒸馏水或缓冲液中,蛋白质分子量大,不能透过透析袋而被保留在袋内,通过不断更换袋外蒸馏水或缓冲液,直至袋内盐分透析完为止。透析常需较长时间,宜在低温下进行。 三、实验材料和试剂 10%鸡蛋白溶液,含鸡蛋清的氯化钠蛋白溶液,饱和硫酸铵溶液,硫酸铵晶体,1%硝酸银溶液。 四、实验步骤 (一)蛋白质盐析 取10%鸡蛋白溶液5ml于试管中,加入等量饱和硫酸铵溶液,微微摇动试管,使溶液混合后静置数分钟,蛋白即析出,如无沉淀可再加少许饱和硫酸铵溶液,观察蛋白质的析出; 取少量沉淀混合物,加水稀释,观察沉淀是否会再溶解。 (二)蛋白质的透析 注入含鸡蛋清的氯化钠蛋白溶液5ml于透析袋中,将袋的开口端用线扎紧,然后悬挂在盛有蒸馏水的烧杯中,使其开口端位于水面之上。 经过10分钟后,自烧杯中取出1ml溶液于试管中,加1%硝酸银溶液一滴,如有白色氯化银沉淀生成,即证明蒸馏水中有Cl-存在。 再自烧杯中取出1ml溶液于另一试管中,加入1ml 10%的氢氧化钠溶液,然后滴加1-2滴1%的硫酸铜溶液,观察有无蓝紫色出现。 每隔20分钟更换蒸馏水一次,经过数小时,则可观察到透析袋内出现轻微混浊,此即为蛋白质沉淀。继续透析至蒸馏水中不再生成氯化银沉淀为止。 实验报告记录透析完毕所需的时间。 附:胶棉半透膜的制备 市售5%的胶棉液,加入干燥的150mL锥形瓶中,将锥形瓶横斜不断转动,使瓶的内壁和瓶口都均匀沾有胶棉液。倒出多余的胶棉液,然后倒置约1min使乙醚、乙醇不断蒸发,直到干燥。逐步剥离瓶口的薄膜,沿瓶壁薄膜夹缝注入蒸馏水,使薄膜逐步跟瓶壁胶离,轻轻取出,浸入蒸馏水中备用。 如有侵权请联系告知删除,感谢你们的配合!
食品中蛋白质的测定实验报告
1.目的 掌握凯氏定氮法测蛋白质的原理、操作、条件、注意事项。 2.原理 蛋白质是含氮有机化合物。食品与硫酸和催化剂一同加热消化,使蛋白质分解。分解的氨与硫酸结合生成硫酸铵。然后碱化蒸馏使氨游离,用硼酸吸收后在以硫酸或盐酸标准溶液滴定,根据酸的消耗量计算含氮量再乘以换算系数,即为蛋白质含量。 3.试剂 3.1浓硫酸、硫酸铜、硫酸钾,所有试剂均用不含氮的蒸馏水配制 3.2混合指示液 1份(1g/L)甲基红乙醇溶液与5份1g/L溴甲酚氯乙醇溶液临用时混合。 也可用2份甲基红乙醇溶液与1份1g/L次甲基蓝乙醇溶液临用时混合。 3.3氢氧化钠溶液(400g/L) 3.4标准滴定溶液 硫酸标准溶液[c(1/2H2SO4)=0.0500mol/L]或盐酸标准溶液[c(HCl) 0.0500mol/L] 3.5硼酸溶液(20g/L) 4.仪器 定氮蒸馏装置 5.样品 全蛋(2.47g) 6.操作 6.1样品处理 准确称取2—5g半固体样品,小心移入干燥洁净的500mL凯氏烧瓶中,然后加入研细的硫酸铜0.5g,硫酸钾10g和浓硫酸20mL,轻轻摇匀后于瓶口放一小漏斗,将瓶以45°角斜放于加有石棉网的电炉上,小火加热,待内容物全部炭化后,泡沫完全消失后,加强火力,并保持瓶内液体微沸,至液体呈蓝绿色呈请透明后,再继续加热0.5h,取下放冷,慢慢加入20mL水。 放冷后,移入100mL容量瓶中,并用少量水洗定氮瓶,洗液并入容量瓶中,再加水至刻度,混匀备用。取与处理样品相同的硫酸铜、硫酸钾、硫酸按同一方法做试剂空白试验。 6.2连接装置 装好定氮装置,于水蒸气发生器内装水至2/3处,加甲基红指示剂数滴及少量硫酸,以保持水呈酸性,加入数滴玻璃珠以防暴沸,用调压器控制,
检测蛋白质与蛋白质之间相互作用的实验技术
一、检测蛋白质与蛋白质相互作用 ①FRET技术(in vivo) FRET,Fluorescence resonanceenergy transfer,即荧光共振能量转移技术。该技术得原理就是用一种波长得光激发某种荧光蛋白后,它释放得荧光刚好又能激发另一种荧光蛋白,使其释放另一波长得荧光,如下图所示: 以下图为例,若要利用FRET检测两种蛋白就是否有相互作用,需将两种蛋白得基因分别与这两种荧光蛋白得基因融合,并在细胞内表达出两种融合蛋白。然后只需用紫外光对CFP进行激发,并检测GFP就是否放出绿色荧光.如果能检测到绿色荧光,那么可以说明这两种蛋白可能有相互作用;反之,则就是这两种蛋白没有相互作用。 ②酵母双、三杂交技术(in vivo) 酵母双杂交系统主要用于考察两种蛋白就是否有相互作用,其原理就是典型得真核生长转录因子,如GAL4、GCN4等都含有二个不同得结构域,即AD与BD.这些转录因子只有同时具有这两个结构域时才能起始转录.由此,设计不同得两个载体,一个含有AD基因(假设为A载体),另一个含有BD基因(假设为B载体)。 一般将一个已知蛋白得基因连在B载体上,作为诱饵(Bait),将未知蛋白得基因连在A载体上,将这两个载体都转到特定得酵母细胞内,瞧未知蛋白与已知蛋白就是否有相互作用.如果两者有相互作用,那么就可以启动报告基因得转录,从而使这个酵母细胞能在选择培养基上显现出来或者生存下来;如果两者无相互作用,那么报告基因就无法表达,那么这个酵母细胞就无法在择培养基上显现出来或者生存下来,如下图所示:
由于酵母双杂交系统不能鉴定膜蛋白间得相互作用,因此又发展出了分离泛素酵母双杂交系统。该系统得原理如下图所示: 如图所示,将泛素蛋白拆分为两个片段,即C端段(Cub)与N端段(NubG),并在C端段得N端接上一个LexA—VP16转录因子,此时它并不能激活基因转录(因为它被限制在了C端段上,不能进入细胞核发挥作用)。 将该C端段连到一个膜蛋白上,将N端段连接到另一个膜蛋白上。若两个膜蛋白有相互作用,那么两个膜蛋白在相互靠近时会使泛素蛋白得N端段与C端段靠近结合,形成一个完整得泛素蛋白。此时泛素蛋白酶体会将这一段被泛素标记得片段降解,那么连接C端段得LexA-VP16转录因子掉落,即可进入细胞核启动标记基因得表达。 酵母三杂交得原理与双杂交一样,只就是它研究得就是两个蛋白与第三个成分间得相互作用,通过第三个成分使两个蛋白相互靠近。第三个成分可以就是:蛋白、RNA或小分子,如下图所示: 如上图所示,在加入第三种成分前,蛋白X与蛋白Y之间并无直接相互作用,因此无法使BD与AD靠近,报告基因不能表达;当加入第三种成分后,蛋白X与蛋白Y得距离被拉近,BD与AD靠近,报告基因表达,从而可以被检测到。 ③ Pulldown技术(invitro) Pulldown,即蛋白沉降技术,它就是建立在蛋白质亲与层析得基础上得一种检测蛋白质间相互作用得分析方法.亲与层析得原理如下图所示,不同蛋白对配体得亲与程度不同,因此可以先将非特异结合得蛋白用低浓度缓冲液给清洗出去,只剩目得蛋白与层析柱结合,然后再用洗脱液将目得蛋白洗脱下来,达到纯化目得蛋白得作用。
英语中的比较级和最高级
大多数形容词有三种形式,原级,比较级和最高级, 以表示形容词说明的性质在程度上的不同。 形容词的原级: 形容词的原级形式就是词典中出现的形容词的原形。例如: poor tall great glad bad 形容词的比较级和最高级: 形容词的比较级和最高级形式是在形容词的原级形式的基础上变化的。分为规则变化和不规则变化。 规则变化如下: 1) 单音节形容词的比较级和最高级形式是在词尾加 -er 和 -est 构成。 great (原级) (比较级) (最高级) 2) 以 -e 结尾的单音节形容词的比较级和最高级是在词尾加 -r 和 -st 构成。wide (原级) (比较级) (最高级) 3)少数以-y, -er, -ow, -ble结尾的双音节形容词的比较级和最高级是在词尾加 -er 和 -est 构成。 clever(原级) (比较级) (最高级) 4) 以 -y 结尾,但 -y 前是辅音字母的形容词的比较级和最高级是把 -y 去掉,加上 -ier 和-est 构成. happy (原形) (比较级) (最高级) 5) 以一个辅音字母结尾其前面的元音字母发短元音的形容词的比较级和最高级是双写该辅音字母然后再加 -er和-est。 big (原级) (比较级) (最高级) 6) 双音节和多音节形容词的比较级和最高级需用more 和 most 加在形容词前面来构成。 beautiful (原级) (比较级) (比较级) difficult (原级) (最高级) (最高级) 常用的不规则变化的形容词的比较级和最高级: 原级------比较级------最高级 good------better------best many------more------most much------more------most bad------worse------worst far------farther, further------farthest, furthest 形容词前如加 less 和 least 则表示"较不"和"最不 形容词比较级的用法: 形容词的比较级用于两个人或事物的比较,其结构形式如下: 主语+谓语(系动词)+ 形容词比较级+than+ 对比成分。也就是, 含有形容词比较级的主句+than+从句。注意从句常常省去意义上和主句相同的部分, 而只剩下对比的成分。
蛋白质免疫印迹技术的实验研究
万方数据
万方数据
万方数据
蛋白质免疫印迹技术的实验研究 作者:张燕婉, 叶珏, 时那, 孟宪敏, 王来元, ZHANG Yan-wan, YE Jue, SHI Na, MENG Xian-min, WANG Lai-yuan 作者单位:中国医学科学院,阜外心血管病医院中心实验室,北京,100037 刊名: 实验技术与管理 英文刊名:EXPERIMENTAL TECHNOLOGY AND MANAGEMENT 年,卷(期):2008,25(10) 被引用次数:21次 参考文献(9条) 1.郭尧君蛋白质电泳实验技术 2006 2.Nieman T Detection based on solution-phase chemiluminescence systems 1989 3.李晓军,秦浚川,武建国蛋白印迹技术研究进展[期刊论文]-临床检验杂志 2004(3) 4.Towbin H;Staehelin T;Gordon Electrophoretic franker of proreins from polyacrylamide gels to nitrocellulose sheets.Procedure and some appHcations 1979(76) 5.Hauri H P;Bucher K Immunoblotting with monodonal antibodities:Importance of the blocking solution 1986(159) 6.高红,王贵新,王维林,张可仞用蛋白印迹技术初步评价肝母细胞瘤血管内皮生长因子表达的意义[期刊论文]-中华小儿外科杂志 2006(2) 7.Towbin H;Gordon J Immunoblotting and dot immunobinding:current status and outlook 1984(72) 8.Tovey ER;Baldo BA Characterisation of allergens by protein blotting 1987(08) 9.沈关心;龚非力抗体技术实验指南 2006 本文读者也读过(1条) 1.段勇.黄韬.袁育林.刘华.李娅.金克炜.DUAN Yong.HUANG Tao.YUAN Yulin.LIU Hua.LI Ya.JIN Kewei蛋白质免疫印迹技术检测肺癌组织上皮钙粘蛋白的表达[期刊论文]-检验医学2009,24(1) 引证文献(7条) 1.秦双立,徐玥蛋白质印迹法在氟中毒研究中的应用[期刊论文]-山东化工 2015(13) 2.马瑛,马明,沈辉,骆新荣,高庆华不孕奶牛宫颈黏液相关ASA免疫印迹分析[期刊论文]-中国奶牛 2013(06) 3.程娜娜,韩榕He-Ne激光和增强UV-B辐射对拟南芥叶片微管蛋白的影响[期刊论文]-激光生物学报 2013(04) 4.刘娇,华碧春,黄智锋蛋白表达检测技术在中药肝损伤机制研究中的应用进展[期刊论文]-浙江中医药大学学报2013(04) 5.韩继美胶体金免疫层析法对AFP、CEA和FN的快速检测[学位论文]硕士 2009 6.黄斌芳c-Jun基因启动子区的遗传变异与肺癌易感性的研究[学位论文]硕士 2012 7.程娜娜He-Ne激光和增强UV-B辐射对拟南芥叶片微管结合蛋白MAP65-1的影响[学位论文]硕士 2014 引用本文格式:张燕婉.叶珏.时那.孟宪敏.王来元.ZHANG Yan-wan.YE Jue.SHI Na.MENG Xian-min.WANG Lai-yuan 蛋白质免疫印迹技术的实验研究[期刊论文]-实验技术与管理 2008(10)
蛋白质测定实验报告
蛋白质测定实验报告标准化管理部编码-[99968T-6889628-J68568-1689N]
蛋白质测定方法——化学报告
蛋白质的检测 酚试剂法灵敏度较高 20~250mg 费时蛋白质在碱性溶 液中其肽键与 Cu2+螯合,形成 蛋白质一铜复合 物,此复合物使 酚试剂的磷钼酸 还原,产生蓝色 化合物 酚类、柠檬 酸、硫酸铵、 tris缓冲液、 甘氨酸、糖 类、甘油等均 有干扰作用 由上表可大致了解五种检测蛋白质的方法,下面以实验的形式进行详细阐述: 1 材料与方法 仪器材料 (1)仪器:凯氏定氮仪、紫外分光光度计、可见光分光光度计、工作离心机、布氏漏斗、抽滤泵。 (2)试剂及原材料:牛奶、酸奶、豆浆、LpH=4. 7醋酸- 醋酸钠缓冲液、乙醇-乙醚等体积混合液、浓H2SO4 、40%氢氧化钠、30%过氧化氢、2%硼酸溶液、0. 050molPL标准盐酸溶液、硫酸钾- 硫酸铜接触剂、混合指示剂、标准蛋白溶液、双缩脲试剂、考马斯亮蓝G- 250试剂。 实验方法 (1)凯氏定氮法测定蛋白质含量 将待测样品与浓硫酸共热,含氮有机物即分解产生氨(消化) ,氨又与硫酸作用,变成硫酸铵。为了加速消化,可以加入CuSO4 作催化剂和加入K2SO4 以提高溶液的沸点,而加入30%过氧化氢有利于消化溶液的澄清。消化好的样品在凯氏定氮仪内经强碱碱化使之分解放出氨,借蒸汽将氨蒸至定量硼酸溶液中,然后用标准盐酸溶液进行滴定,记录,计算出样品含氮量。每个样品做三次重复测定,取平均值。 (2)紫外吸收法测定蛋白质含量 蛋白质分子中,酪氨酸、苯丙氨酸和色氨酸残基的苯环含有共轭双键,使蛋白质具有吸收紫外光的性质,吸收峰在280nm处,其吸光度(即光密度值)与蛋白质含量成正比。此外,蛋白质溶液在238nm的光吸收值与肽键含量成正比。利用一定波长下,蛋白质溶液的光吸收值与蛋白质浓度的正比关系,可以进行蛋白质含量的测定。 紫外吸收法简便、灵敏、快速,不消耗样品,测定后仍能回收使用。低浓度的盐,例如,
英语比较级和最高级的用法归纳
英语比较级和最高级的用法归纳 在学习英语过程中,会遇到很多的语法问题,比如比较级和最高级的用法,对于 这些语法你能够掌握吗?下面是小编整理的英语比较级和最高级的用法,欢迎阅读! 英语比较级和最高级的用法 一、形容词、副词的比较级和最高级的构成规则 1.一般单音节词和少数以-er,-ow结尾的双音节词,比较级在后面加-er,最高级 在后面加-est; (1)单音节词 如:small→smaller→smallest short→shorter→shortest tall→taller→tallest great→greater→greatest (2)双音节词 如:clever→cleverer→cleverest narrow→narrower→narrowest 2.以不发音e结尾的单音节词,比较在原级后加-r,最高级在原级后加-st; 如:large→larger→largest nice→nicer→nicest able→abler→ablest 3.在重读闭音节(即:辅音+元音+辅音)中,先双写末尾的辅音字母,比较级加-er,最高级加-est; 如:big→bigger→biggest hot→hotter→hottest fat→fatter→fattest 4.以“辅音字母+y”结尾的双音节词,把y改为i,比较级加-er,最高级加-est; 如:easy→easier→easiest heavy→heavier→heaviest busy→busier→busiest happy→happier→happiest 5.其他双音节词和多音节词,比较级在前面加more,最高级在前面加most; 如:bea utiful→more beautiful→most beautiful different→more different→most different easily→more easily→most easily 注意:(1)形容词最高级前通常必须用定冠词 the,副词最高级前可不用。 例句: The Sahara is the biggest desert in the world. (2) 形容词most前面没有the,不表示最高级的含义,只表示"非常"。 It is a most important problem. =It is a very important problem.
免疫印迹实验报告——wester blot
Western blot实验报告 摘要:目的:学习并掌握western blot分离蛋白及观察方法 方法:western blot 结果:见后文 结论:western blot能很好地分离蛋白 关键词:western blot、分离、小鼠组织、蛋白 Western blot test report Abstract: objective: Learn and master the western blot protein isolated and observation method Methods: western blot:,sds-page and electric transfer Results: see below Key words: Western blot、separate、mouse tissues、protein 前言:免疫印迹又称Western印迹(Western blotting),与DNA的Southern印迹技术相对应,两种技术均把电泳分离的组分从凝胶转移至一种固相载体(通常为NC膜),然后用探针检测特异性组分。不同的是,Western blotting所检测的是抗原类蛋白质成分,所用的探针是抗体,它与附着于固相载体的靶蛋白所呈现的抗原表位发生特异性反应。该技术结合了凝胶电泳分辨力高和固相免疫测定特异敏感等诸多优点,具有从复杂混合物中对特定抗原进行鉴别和定量检测,以及从多克隆抗体中检测出单克隆抗体的优越性。该技术的灵敏度能达到标准的固相放射免疫分析的水平而无需对靶蛋白进行放射性标记。目前,Western blotting广泛用于蛋白质研究、基础研究和临床医学的研究。 免疫印迹可分成两个步骤:蛋白质由凝胶转移至固相基质;特异性抗体检测。 蛋白质转移通常由电泳实现,现常用的方法有二:1 半干法:将凝胶和固相基质似三明治样夹在缓冲液湿润的滤纸中间,通电10-30分钟可完成转移;2 湿法:将凝胶和固相基质夹在滤纸中间,浸在转移装置的缓冲液中,通电45分钟或过夜课完成转移。本试验采用湿法转移。免疫印迹用膜通常有硝酸纤维素膜和尼龙膜两种。大多数应用前者。本实验也用硝酸纤维素膜进行转移。 1 试剂与仪器 1.1 试剂(所有试剂均供两组用) 1.1.1 8%电泳分离胶的配制 H2O 6.9ml
蛋白质的盐析与透析
蛋白质的分离纯化 一、实验目的 1.了解蛋白质的分离纯化方法 2.掌握蛋白质的盐析及透析方法 二、实验原理 在蛋白质溶液中加入一定浓度的中性盐,蛋白质即从溶液中沉淀析出,这种作用称为盐析。盐析法常用的盐类有硫酸铵、硫酸钠等。 蛋白质用盐析法沉淀分离后,需脱盐才能获得纯品,脱盐最常用的方法为透析法。蛋白质在溶液中因其胶体质点直径较大,不能透过半透膜,而无机盐及其它低分子物质可以透过,故利用透析法可以把经盐析法所得的蛋白质提纯,即把蛋白质溶液装入透析袋内,将袋口用线扎紧,然后把它放进蒸馏水或缓冲液中,蛋白质分子量大,不能透过透析袋而被保留在袋内,通过不断更换袋外蒸馏水或缓冲液,直至袋内盐分透析完为止。透析常需较长时间,宜在低温下进行。 三、实验材料和试剂 10%鸡蛋白溶液,含鸡蛋清的氯化钠蛋白溶液,饱和硫酸铵溶液,硫酸铵晶体,1%硝酸银溶液,双缩脲试剂 四、实验步骤 (一)蛋白质盐析 取10%鸡蛋白溶液5ml于试管中,加入等量饱和硫酸铵溶液,微微摇动试管,使溶液混合后静置数分钟,蛋白即析出,如无沉淀可再加少许饱和硫酸铵溶液,观察蛋白质的析出; 取少量沉淀混合物,加水稀释,观察沉淀是否会再溶解。 (二)蛋白质的透析 注入含鸡蛋清的氯化钠蛋白溶液5ml于透析袋中,将袋的开口端用线扎紧,然后悬挂在盛有蒸馏水的烧杯中,使其开口端位于水面之上。 经过10分钟后,自烧杯中取出1ml溶液于试管中,加1%硝酸银溶液一滴,如有白色氯化银沉淀生成,即证明蒸馏水中有Cl-存在。 再自烧杯中取出1ml溶液于另一试管中,加入1ml 10%的氢氧化钠溶液,然后滴加1-2滴1%的硫酸铜溶液,观察有无蓝紫色出现。 每隔20分钟更换蒸馏水一次,经过数小时,则可观察到透析袋内出现轻微混浊,此即为蛋白质沉淀。继续透析至蒸馏水中不再生成氯化银沉淀为止。 实验报告记录透析完毕所需的时间。
英语比较级和最高级的用法
More than的用法 A. “More than+名词”表示“不仅仅是” 1)Modern science is more than a large amount of information. 2)Jason is more than a lecturer; he is a writer, too. 3) We need more than material wealth to build our country.建设我们国家,不仅仅需要物质财富. B. “More than+数词”含“以上”或“不止”之意,如: 4)I have known David for more than 20 years. 5)Let's carry out the test with more than the sample copy. 6) More than one person has made this suggestion. 不止一人提过这个建议. C. “More than+形容词”等于“很”或“非常”的意思,如: 7)In doing scientific experiments, one must be more than careful with the instruments. 8)I assure you I am more than glad to help you. D. more than + (that)从句,其基本意义是“超过(=over)”,但可译成“简直不”“远非”.难以,完全不能(其后通常连用情态动词can) 9) That is more than I can understand . 那非我所能懂的. 10) That is more than I can tell. 那事我实在不明白。 11) The heat there was more than he could stand. 那儿的炎热程度是他所不能忍受的 此外,“more than”也在一些惯用语中出现,如: more...than 的用法 1. 比……多,比……更 He has more books than me. 他的书比我多。 He is more careful than the others. 他比其他人更仔细。 2. 与其……不如 He is more lucky than clever. 与其说他聪明,不如说他幸运。 He is more (a)scholar than (a)teacher. 与其说他是位教师,不如说他是位学者。 注:该句型主要用于同一个人或物在两个不同性质或特征等方面的比较,其中的比较级必须用加more 的形式,不能用加词尾-er 的形式。 No more than/not more than 1. no more than 的意思是“仅仅”“只有”“最多不超过”,强调少。如: --This test takes no more than thirty minutes. 这个测验只要30分钟。 --The pub was no more than half full. 该酒吧的上座率最多不超过五成。-For thirty years,he had done no more than he (had)needed to. 30年来,他只干了他需要干的工作。 2. not more than 为more than (多于)的否定式,其意为“不多于”“不超过”。如:Not more than 10 guests came to her birthday party. 来参加她的生日宴会的客人不超过十人。 比较: She has no more than three hats. 她只有3顶帽子。(太少了) She has not more than three hats. 她至多有3顶帽子。(也许不到3顶帽子) I have no more than five yuan in my pocket. 我口袋里的钱最多不过5元。(言其少) I have not more than five yuan in my pocket. 我口袋里的钱不多于5元。(也许不到5元) more than, less than 的用法 1. (指数量)不到,不足 It’s less than half an hour’s drive from here. 开车到那里不到半个钟头。 In less than an hour he finished the work. 没要上一个小时,他就完成了工作。 2. 比……(小)少 She eats less than she should. 她吃得比她应该吃的少。 Half the group felt they spent less than average. 半数人觉得他们的花费低于平均水平。 more…than,/no more than/not more than (1)Mr.Li is ________ a professor; he is also a famous scientist. (2)As I had ________ five dollars with me, I couldn’t afford the new jacket then. (3)He had to work at the age of ________ twelve. (4)There were ________ ten chairs in the room.However, the number of the children is twelve. (5)If you tel l your father what you’ve done, he’ll be ________ angry. (6)-What did you think of this novel? -I was disappointed to find it ________ interesting ________ that one. 倍数表达法 1. “倍数+形容词(或副词)的比较级+than+从句”表示“A比B大(长、高、宽等)多少倍” This rope is twice longer than that one.这根绳是那根绳的三倍(比那根绳长两倍)。The car runs twice faster than that truck.这辆小车的速度比那辆卡车快两倍(是那辆卡车的三倍)。 2. “倍数+as+形容词或副词的原级+as+从句”表示“A正好是B的多少倍”。
免疫印迹介绍及实验过程
免疫印迹 免疫印迹 免疫印迹(immunoblotting)又称蛋白质印迹(Western blotting),是根据抗原抗体的特异性结合检测复杂样品中的某种蛋白的方法。该法是在凝胶电泳和固相免疫测定技术基础上发展起来的一种新的免疫生化技术。由于免疫印迹具有SDS-PAGE 的高分辨力和固相免疫测定的高特异性和敏感性,现已成为蛋白分析的一种常规技术。免疫印迹常用于鉴定某种蛋白,并能对蛋白进行定性和半定量分析。结合化学发光检测,可以同时比较多个样品同种蛋白的表达量差异。 免疫印迹法的基本原理 将混合抗原样品在凝胶板上进行单向或双向电泳分离, 然后取固定化基质膜与凝胶相贴。在印迹纸的自然吸附力、电场力或其它外力作用下, 使凝胶中的单一抗原组份转移到印迹纸上, 并且固相化。最后应用免疫覆盖液技术如免疫同位素探针或免疫酶探针等, 对抗原固定化基质膜进行检测和分析。 免疫印迹法的基本步骤 免疫印迹法(以抗原分析为例)基本上可分为抗原分离、抗原印迹和抗原检定三个步骤。在每一步中因采用的具体实验方法不同, 可构成多种免疫印迹分析系统。 免疫印迹法的优点 免疫印迹法是一项分析抗原、抗体的技术。它具有下列优点: 1、湿的固定化基质膜柔韧, 易于操作; 2 、固定化的生物大分子可均一的与各种免疫探针接近, 不会象凝胶那样受孔径阻隔; 3、免疫印迹分析只需少量试剂; 4、孵育、洗涤的时间明显减短; 5、可同时制作多个拷贝, 用于多种分析和鉴定; 6、结果以图谱形式可长期保存; 7、免疫探针可通过降低PH值等方法, 象抹去录音磁带一样将探针抹掉, 再换用第二探针进行分析检测。免疫印迹法的应用范围及优点不仅局限于此, 它必将随着这一方法的深入研究而不断发展和完善。 免疫印迹 免疫印迹又常称Western blot,是一综合性的免疫学检测技术。它利用SDS-PAGE技术将生物样品中的蛋白质分子按分子量的大小在凝胶上分离开,然后用电转移的方法将蛋白转移到固相膜上(NC、尼龙或PVDF膜),最后进行免疫学检测。由于免疫学检测敏感性高,并且通过SDS-PAGE样品中的待检蛋白得到了浓缩,因此,Western blot的灵敏度特别高,可达到放射免疫的分析水平。而使用一般的免疫学检测技术(如ELISA、放射免疫沉淀)检测时,由于要求被检测蛋白可溶、要求抗体效价高、亲和力高和特异性强,往往并不容易达到目的。而Western blot却没有这些缺点。因此,Western blot广泛应用于生物样品中是否存在某一蛋白质(抗原)的检测。也可用于粗略测定抗原蛋白的相对含量和抗原多肽链的相对分子量。
蛋白质测定实验报告
蛋白质测定方法——化学报告
蛋白质的检测 酚试剂法灵敏度较高 20~250mg 费时蛋白质在碱性溶 液中其肽键与 Cu2+螯合,形成 蛋白质一铜复合 物,此复合物使 酚试剂的磷钼酸 还原,产生蓝色 化合物 酚类、柠檬 酸、硫酸铵、 tris缓冲液、 甘氨酸、糖 类、甘油等均 有干扰作用 由上表可大致了解五种检测蛋白质的方法,下面以实验的形式进行详细阐述:
1 材料与方法 1.1 仪器材料 (1)仪器:凯氏定氮仪、紫外分光光度计、可见光分光光度计、工作离心机、布氏漏斗、抽滤泵。 (2)试剂及原材料:牛奶、酸奶、豆浆、0.12mol/LpH=4. 7醋酸- 醋酸钠缓冲液、乙醇-乙醚等体积混合液、浓H2SO4 、40%氢氧化钠、30%过氧化氢、2%硼酸溶液、0. 050molPL标准盐酸溶液、硫酸钾- 硫酸铜接触剂、混合指示剂、标准蛋白溶液、双缩脲试剂、考马斯亮蓝G- 250试剂。 1.2 实验方法 (1)凯氏定氮法测定蛋白质含量 将待测样品与浓硫酸共热,含氮有机物即分解产生氨(消化) ,氨又与硫酸作用,变成硫酸铵。为了加速消化,可以加入CuSO4 作催化剂和加入K2SO4 以提高溶液的沸点,而加入30%过氧化氢有利于消化溶液的澄清。消化好的样品在凯氏定氮仪内经强碱碱化使之分解放出氨,借蒸汽将氨蒸至定量硼酸溶液中,然后用标准盐酸溶液进行滴定,记录,计算出样品含氮量。每个样品做三次重复测定,取平均值。 (2)紫外吸收法测定蛋白质含量 蛋白质分子中,酪氨酸、苯丙氨酸和色氨酸残基的苯环含有共轭双键,使蛋白质具有吸收紫外光的性质,吸收峰在280nm处,其吸光度(即光密度值)与蛋白质含量成正比。此外,蛋白质溶液在238nm的光吸收值与肽键含量成正比。利用一定波长下,蛋白质溶液的光吸收值与蛋白质浓度的正比关系,可以进行蛋白质含量的测定。 紫外吸收法简便、灵敏、快速,不消耗样品,测定后仍能回收使用。低浓度的盐,例如, 生化制备中常用的(NH4)2SO4 等和大多数缓冲液不干扰测定,特别适用于柱层析洗脱液的快速连续检测,因为此时只需测定蛋白质浓度的变化,而不需知道其绝对值。 此法的特点是测定蛋白质含量的准确度较差,干扰物质较多,在用标准曲线法测定蛋白质含量时,对那些与标准蛋白质中酪氨酸和色氨酸含量差异大的蛋白质有一定的误差,故该法适于用测定与标准蛋白质氨基酸组成相似的蛋白质。若样品中含有嘌呤、嘧啶及核酸等吸收紫外光的物质,会出现较大的干扰。核酸的干扰可以通过查校正表,再进行计算的方法加以适当的校正。但是因为不同的蛋白质和核酸的紫外吸收是不相同的,虽然经过校正,测定的结果还是存在一定的误差。 此外,进行紫外吸收法测定时,由于蛋白质吸收高峰常因pH的改变而有变化,因此要注意溶液的pH值,测定样品时的pH要与测定标准曲线的pH相一致。取待测样品制成蛋白浓度大约在0. 1~1. 0mgPmL的蛋白质溶液,用紫外分光光度计进行比色,对照标准曲线得出样品含氮量。每个样品做3次重复测定,取平均值。 (3)双缩脲法测定蛋白质含量