Martinis_2009_Talanta
Talanta78(2009)857–862
Contents lists available at ScienceDirect
Talanta
j o u r n a l h o m e p a g e:w w w.e l s e v i e r.c o m/l o c a t e/t a l a n t
a
On-line ionic liquid-based preconcentration system coupled to?ame atomic absorption spectrometry for trace cadmium determination in plastic food packaging materials
Estefanía M.Martinis a,b,Roberto A.Olsina b,d,Jorgelina C.Altamirano a,b,c,Rodolfo G.Wuilloud a,b,c,?
a Laboratory of Environmental Research and Services of Mendoza(LISAMEN)(CCT–CONICET–Mendoza),Av.Ruiz Leal S/N Parque General San Martín,CC.131,
M5502IRA Mendoza,Argentina
b Consejo Nacional de Investigaciones Cientí?cas y Técnicas(CONICET),Argentina
c Instituto de Ciencias Básicas,Universida
d Nacional d
e Cuyo,Mendoza,Argentina
d INQUISAL-CONICET,Departamento d
e Química Analítica,Facultad de Química,Bioquímica y Farmacia,Universidad Nacional de San Luis,Argentina
a r t i c l e i n f o
Article history:
Received30September2008
Received in revised form15December2008 Accepted22December2008
Available online15January2009
Keywords:
1-Butyl-3-methylimidazolium
hexa?uorophosphate
Room temperature ionic liquid
Cadmium
On-line preconcentration
Plastic food packaging material a b s t r a c t
A novel on-line preconcentration method based on liquid–liquid(L–L)extraction with room temperature ionic liquids(RTILs)coupled to?ame atomic absorption spectrometry(FAAS)was developed for cadmium determination in plastic food packaging materials.The methodology is based on the complexation of Cd with2-(5-bromo-2-pyridylazo)-5-diethylaminophenol(5-Br-PADAP)reagent after sample digestion fol-lowed by extraction of the complex with the RTIL1-butyl-3-methylimidazolium hexa?uorophosphate ([C4mim][PF6]).The mixture was loaded into a?ow injection analysis(FIA)manifold and the RTIL rich-phase was retained in a microcolumn?lled with silica gel.The RTIL rich-phase was then eluted directly into FAAS.A enhancement factor of35was achieved with20mL of sample.The limit of detection(LOD), obtained as IUPAC recommendation,was6ng g?1and the relative standard deviation(R.S.D.)for10repli-cates at10?g L?1Cd concentration level was3.9%,calculated at the peak heights.The calibration graph was linear and a correlation coef?cient of0.9998was achieved.The accuracy of the method was evaluated by both a recovery study and comparison of results with direct determination by electrothermal atomic absorption spectrometry(ETAAS).The method was successfully applied for Cd determination in plastic food packaging materials and Cd concentrations found were in the range of0.04–10.4?g g?1.
?2009Elsevier B.V.All rights reserved.
1.Introduction
Nowadays polymer packages are used preferentially in packag-ing foodstuffs.They are able to retard or even prevent detrimental changes in the food due to various external in?uences such as oxy-gen,light and microorganisms.They are also capable of reducing the loss in compounds such as water or?avour from the food[1]. Resulting from this protection,polymer packages enable consumers to store foodstuffs over an extended period of time.However,poly-mers contain additives such as plasticizers,lubricants,stabilizers and antioxidants[2],all chemicals which are necessary either for the processing or to maintain the stability of the?nal polymer package[3,4].Recently,numerous studies showed that there is a ?Corresponding author at:Laboratory of Environmental Research and Services of
Mendoza(LISAMEN)(CCT–CONICET–Mendoza),Av.Ruiz Leal S/N Parque General San Martín,CC.131,M5502IRA Mendoza,Argentina.Tel.:+542615244064;
fax:+542615244001.
E-mail address:rwuilloud@https://www.360docs.net/doc/fc9086542.html,.ar(R.G.Wuilloud).
URL:https://www.360docs.net/doc/fc9086542.html,.ar/lisamen/(R.G.Wuilloud).potential migration of additives from the packaging material into food[5–7].Thus,packaging might pose a problem because of some of the additives used are extremely toxic.Cadmium is one of the toxic elements used extensively in the manufacturing of plastics [3].Recently,the content of Cd in packaging materials undergoes European Community(EC)regulations.The EC Directive(94/62/EC) limits the concentration of Cd to100mg kg?1[8].Due to its low excretion rate(biological half-life=10–30years)[9],Cd can be accu-mulated in the body and therefore,the presence of this metal is a problem even at low concentration levels[10].Thus,sensitive,accu-rate,and fast analytical methods for trace metal determination in a variety of plastic materials are required.
Elemental analysis by spectrophotometric techniques involve the elution of target metal ions from polymer samples into the aqueous solution[11],before sensitive analytical techniques are needed for trace levels evaluation.Inductively coupled plasma-mass spectrometry(ICP-MS)has been used for the determination of Cd in plastics[12];however,the cost of such instrumentation may still be prohibitive to many laboratories.Although?ame atomic absorption spectrometry(FAAS)or electrothermal atomic absorp-tion spectrometry(ETAAS)are the most commonly used techniques
0039-9140/$–see front matter?2009Elsevier B.V.All rights reserved. doi:10.1016/j.talanta.2008.12.051
858 E.M.Martinis et al./Talanta78(2009)857–862
to determine Cd,FAAS is widely applied in routine laboratories due to its low cost and greater simplicity as compared to ETAAS. However,conventional FAAS has a detection limit,which is not low enough to determine Cd at trace levels in plastics.In order to achieve accurate,sensitive and reliable results at trace levels;preconcentra-tion and separation steps are needed prior to analyte determination by FAAS.
The use of room temperature ionic liquids(RTILs)as an alter-native to other techniques for separation and preconcentration has attracted considerable attention in recent years[13,14].RTIL are salts resulting from combinations of organic cations and var-ious anions[15].The unique physicochemical properties of RTILs, including air and moisture stability,non-volatility,good thermal stability,tunable viscosity and miscibility with water and organic solvents,the fact that they remain liquid at room temperature, make their use particularly attractive in separation processes[16]. Recently,numerous studies have shown their good extractability for various organic compounds and metal ions[17].However,up to date all the extraction/preconcentration methodologies based on RTIL involve batch procedures[14,18]and no on-line system has been developed so far for RTIL phase separation.It is well known that when preconcentration methods are applied in a batch mode,the risk of contamination is very high and the operation is usually too time-consuming.On the other hand,2-(5-bromo-2-pyridylazo)-5-diethylaminophenol(5-Br-PADAP)forms stable complexes with numerous metal ions[19–22],and is therefore a suitable reagent for Cd extraction/preconcentration with a RTIL[23].
In this work,a novel on-line RTIL-based preconcentration sys-tem for Cd determination at trace levels in plastic food packaging materials is presented.The on-line coupling of a FI preconcentration and separation system to FAAS represents an ef?cient and simple methodology for routine analysis.Cadmium preconcentration was mediated by chelation with the5-Br-PADAP reagent,followed by extraction with the RTIL1-butyl-3-methylimidazolium hexa?uo-rophosphate([C4mim][PF6])[24].On-line retention and separation of the RTIL phase was achieved with a microcolumn?lled with sil-ica gel.The method was successfully applied to Cd determination in plastic materials,demonstrating the possibility of using RTILs for metal extraction from complex matrices.
2.Experimental
2.1.Apparatus
The experiments were performed using a PerkinElmer5100PC atomic absorption spectrometer(PerkinElmer,Norwalk,CT,USA), equipped with a FIAS200?ow injection analysis system (PerkinElmer).A Cd electrodeless discharge lamp(PerkinElmer) operated at a current of240mA and a wavelength of228.8nm with a spectral band width of0.7nm was used.A deuterium back-ground corrector was used.All instrumental parameters are listed in Table1.
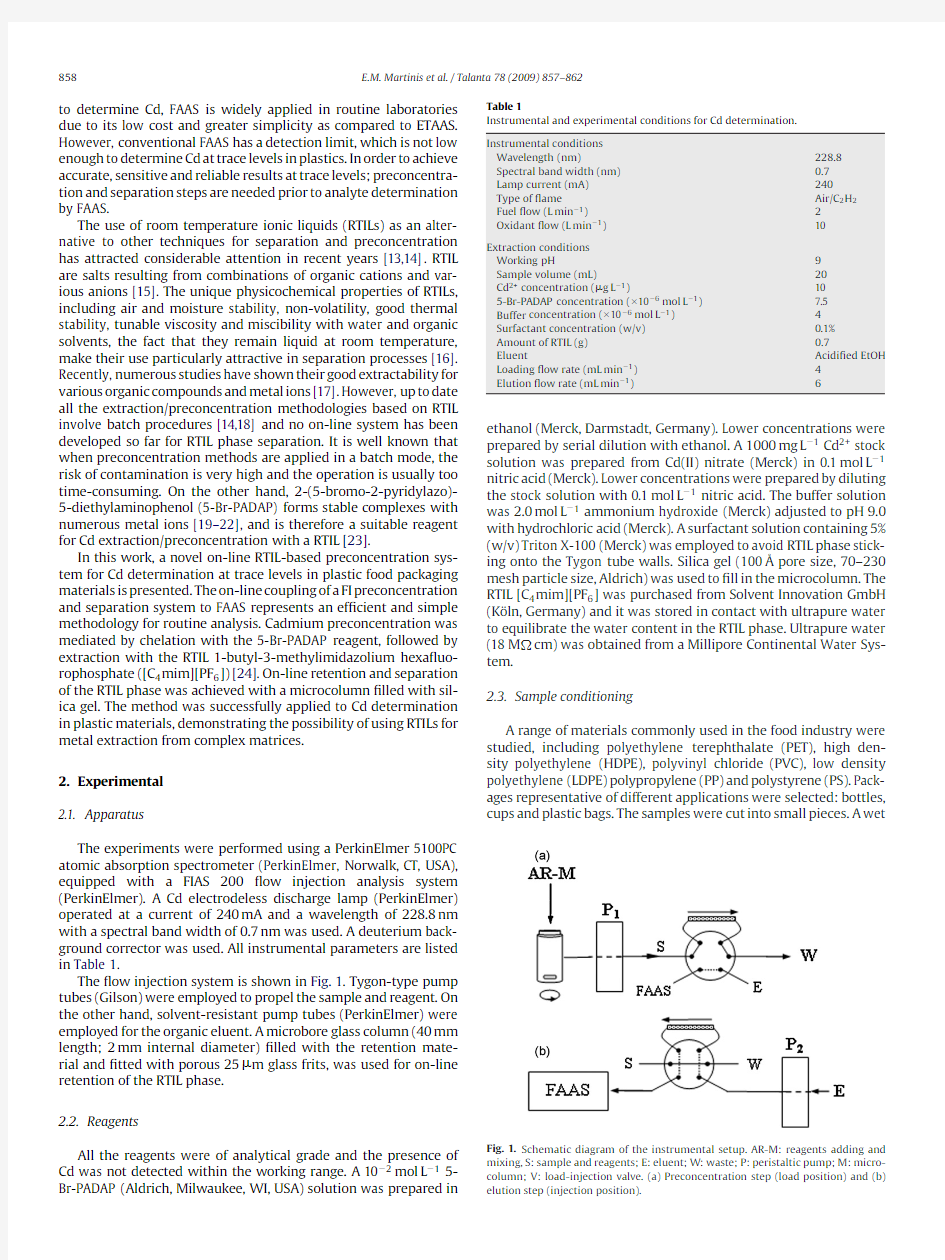
The?ow injection system is shown in Fig.1.Tygon-type pump tubes(Gilson)were employed to propel the sample and reagent.On the other hand,solvent-resistant pump tubes(PerkinElmer)were employed for the organic eluent.A microbore glass column(40mm length;2mm internal diameter)?lled with the retention mate-rial and?tted with porous25?m glass frits,was used for on-line retention of the RTIL phase.
2.2.Reagents
All the reagents were of analytical grade and the presence of Cd was not detected within the working range.A10?2mol L?15-Br-PADAP(Aldrich,Milwaukee,WI,USA)solution was prepared in Table1
Instrumental and experimental conditions for Cd determination.
Instrumental conditions
Wavelength(nm)228.8 Spectral band width(nm)0.7
Lamp current(mA)240
Type of?ame Air/C2H2
Fuel?ow(L min?1)2
Oxidant?ow(L min?1)10
Extraction conditions
Working pH9
Sample volume(mL)20
Cd2+concentration(?g L?1)10
5-Br-PADAP concentration(×10?6mol L?1)7.5
Buffer concentration(×10?6mol L?1)4
Surfactant concentration(w/v)0.1%
Amount of RTIL(g)0.7
Eluent Acidi?ed EtOH Loading?ow rate(mL min?1)4
Elution?ow rate(mL min?1)6
ethanol(Merck,Darmstadt,Germany).Lower concentrations were prepared by serial dilution with ethanol.A1000mg L?1Cd2+stock solution was prepared from Cd(II)nitrate(Merck)in0.1mol L?1 nitric acid(Merck).Lower concentrations were prepared by diluting the stock solution with0.1mol L?1nitric acid.The buffer solution was2.0mol L?1ammonium hydroxide(Merck)adjusted to pH9.0 with hydrochloric acid(Merck).A surfactant solution containing5% (w/v)Triton X-100(Merck)was employed to avoid RTIL phase stick-ing onto the Tygon tube walls.Silica gel(100?pore size,70–230 mesh particle size,Aldrich)
was used to?ll in the microcolumn.The RTIL[C4mim][PF6]was purchased from Solvent Innovation GmbH (K?ln,Germany)and it was stored in contact with ultrapure water to equilibrate the water content in the RTIL phase.Ultrapure water (18M cm)was obtained from a Millipore Continental Water Sys-tem.
2.3.Sample conditioning
A range of materials commonly used in the food industry were studied,including polyethylene terephthalate(PET),high den-sity polyethylene(HDPE),polyvinyl chloride(PVC),low density polyethylene(LDPE)polypropylene(PP)and polystyrene(PS).Pack-ages representative of different applications were selected:bottles, cups and plastic bags.The samples were cut into small pieces.A wet
Fig.1.Schematic diagram of the instrumental setup.AR-M:reagents adding and mixing,S:sample and reagents;E:eluent;W:waste;P:peristaltic pump;M:micro-column;V:load-injection valve.(a)Preconcentration step(load position)and(b) elution step(injection position).
E.M.Martinis et al./Talanta78(2009)857–862859
Table2
Operation sequence for FI on-line preconcentration and separation system.
Step Time(s)Valve position Pump active Medium pumped Flow rate(mL min?1)Function
110Fill P1Buffer-diluted solution4pH conditioned
2(Fig.1(a))300Fill P1Sample reagent RTIL4Load sample
310Fill P1Buffer-diluted solution4Remove sample present in the line,vial and column 4(Fig.2)6Inject P2Acidi?ed EtOH6Elute analyte into the?ame
55Inject P2Acidi?ed EtOH6Remove residual solutions
digestion procedure was followed for all packaging material,0.5g of sample was weighted and5mL sulfuric acid,5mL nitric acid and 5mL perchloric acid were added in a glass beaker.The mixture was kept boiling on a heating plate for1h.The mixture was partially covered with a watch glass to avoid total evaporation.After cool-ing,the solution was transferred to a100mL volumetric?ask and diluted to the mark with water.An aliquot of20mL of the resulting solution was used for the determination.
2.4.On-line separation and preconcentration procedure
A schematic diagram of the preconcentration and determination system is shown in Fig.1.The operation sequence for FI on-line preconcentration and separation system is listed in Table2.In the preconcentration stage(Fig.1(a)),20mL of sample solution, 0.15mL of10?3mol L?15-Br-PADAP solution,0.4mL of5%(w/v) Triton X-100,0.4mL of2mol L?1(pH9.0)buffer solution and0.7g of[C4mim][PF6]were placed in a vial.The resultant system was shaken for about5s with a stirring bar before and during the loading of the mixture into the column at a?ow rate of4mL min?1.The RTIL phase containing the Cd–5-Br-PADAP complex was thus retained by the?lling material of the column.It has to be pointed out that, before loading,the column was conditioned for preconcentration at the correct pH with a buffer-diluted solution.After loading,further washing with buffer-diluted solution served to remove any sam-ple still present in the lines and in the column.In the elution step (Fig.1(b)),the injection valve was switched on and the retained RTIL rich-phase was eluted with ethanol acidi?ed with0.5mol L?1 nitric acid at a?ow rate of6mL min?1directly into the nebulizer of FAAS instrument and Cd was determined under the conditions shown in Table1.
Calibration was performed against aqueous standards sub-mitted to the same preconcentration procedure.Likewise,blank solutions were analyzed in the same manner as standard and sample solutions.For optimizing the preconcentration and deter-mination system,20mL of1?g L?1Cd2+standard solution was used instead of the samples.
3.Results and discussion
3.1.Column manufacturing and on-line RTIL phase collection
It was supposed that,the high viscosity of the RTIL[C4mim][PF6] (352.2mPa s)in combination with a controlled loading?ow rate of the RTIL-aqueous mixture through the column,would lead to RTIL phase retention.Therefore,home-made columns packed with a potentially suitable?ltering material such as,cotton,polyurethane foam or silica gel[25],were tested to pursue on-line collection and separation of the RTIL phase.For soft?lling materials,such as cotton and polyurethane foam,the RTIL phase was not completely retained in the column.In fact,the RTIL phase passed through the cotton?bers or holes in the foam,making dif?cult its retention.On the other hand,silica gel proved to be highly effective for reten-tion whereas keeping the RTIL phase in a more localized region inside the column.This yielded sharper and well-de?ned peaks as compared to the other?lling materials.
Column design is a critical parameter for de?ning peak form of transient signals originated in a FI on-line preconcentration system. The sharper the peaks,the higher will be the sensitivity when ana-lyte quanti?cation is performed based on peak height.Therefore, inner diameter and length of the column were important variables to be considered in this work.It was observed that a minimal length of40mm was necessary for total RTIL phase retention.Shorter columns did not show good retention as the RTIL phase was not completely entrapped by the?lling material.On the other hand, longer columns did not bring further enhancement of the analyti-cal signal and a higher back pressure was generated within the FI system.Another variable considered in the column design was the inner diameter.Thus,a reduced inner diameter was preferred in order to achieve low dispersion of the peak signal.A2-mm inner diameter was found to be effective for RTIL phase retention.
3.2.Optimization of the loading variables
Several variables were studied in order to optimize Cd–5-Br-PADAP complex formation and extraction,as well as retention of the RTIL phase into the column.Among them,pH,surfactant and chelating agent concentration,RTIL amount and loading?ow rate were studied.Additionally,the conditions for suitable elution of the analyte from the column were studied.
The optimal pH values were in the range of7.8–10.2.This phe-nomenon is understandable,since the best complexation of Cd with the5-Br-PADAP reagent occurs within this range[20,23].Accord-ing to these results,the selected pH was9.0.The minimum reagent to metal ion molar ratio necessary to reach the optimum response was100.Above this ratio,no variation in the analytical response was observed.Therefore,a1505-Br-PADAP to metal ion molar ratio was selected for further work.It corresponds to7.5×10?6mol L?1 5-Br-PADAP concentration.
In order to avoid the precipitation of the complexing agent and Cd–5-Br-PADAP complex in aqueous medium prior to the extrac-tion,Triton X-100was added to the sample solution.Moreover, the surfactant also reduced the adherence of the RTIL on the inner walls of the tubes,thus improving the?owing ability of the RTIL throughout the FI system and forcing the sole retention into the column.In the presence of a non-ionic surfactant such as Triton X-100,the?ne droplets of RTIL are surrounded by their molecules. Hence,RTIL interactions with the inner walls of the lines decrease and consequently,RTIL phase do not stick on it[26].Although the presence of a surfactant facilitates the?owing of the RTIL phase, it can negatively affect the retention of the RTIL phase by the?ll-ing material of the column.Therefore,the effect of Triton X-100 on Cd–5-Br-PADAP extraction and later RTIL phase retention into the column was studied within a surfactant concentration range of0.01–2.0%(w/v).This study showed that both the complexing agent and the metallic complex remained in solution within range studied.A0.1%(w/v)surfactant concentration was chosen for fur-ther work as yielded high extraction ef?ciency while keeping the complex in solution(Fig.2).Higher surfactant concentrations led to inef?cient retention into the column,and hence non-reproducible results.Moreover,the greatest analyte enhancement factor was reached at0.1%(w/v)surfactant concentration.
860 E.M.Martinis et al./Talanta78(2009)
857–862
Fig.2.Effect of Triton X-100concentration on the ef?ciency of the preconcentration system.Experimental conditions are listed in Table1.
Optimization of the minimal sample volume required to be injected into FI-FAAS is crucial in order to reach a suitable response. Therefore,it is highly important to establish the minimal volume of RTIL that leads to total complex extraction while achieving the high-est signal.The variation of the analyte signal upon the RTIL amount was examined within the range:0.4–1.2g.It was observed that the extraction ef?ciency of the system and the signal were remarkably affected by the RTIL amount.Quantitative extraction and higher signal was observed for a minimal RTIL amount of0.6g.No signi?-cant changes were observed on the extraction ef?ciency by adding higher RTIL amounts.On the other hand,it was considered the effect of RTIL amount on the retention capacity of the column. Experiments performed with different RTIL amounts showed that effective retention of the phase was achieved up to0.7g RTIL.A sig-ni?cant reduction in the RTIL retention was observed for higher RTIL amounts.Thus,in order to achieve the best enhancement factor, 0.7g RTIL amount was chosen as optimal.Under these conditions, a?nal RTIL volume of500?L was obtained.
The sample?ow rate through the column is an important param-eter,since this is one of the steps that controls the time of analysis. Moreover,the effect of sample?ow rate through the column was a critical variable to achieve high retention of the RTIL phase.The in?uence of the sample loading?ow rate on the analytical response was not critical between1and5mL min?1.The response decreased at?ow rate values higher than5mL min?1,and even none retention of the RTIL phase was observed when the?ow rate was as high as 20mL min?1.This phenomenon allows us to state that retention of the RTIL phase into the column is mainly produced due to a?ltering-like process,rather than a chemical one.In fact,the high viscosity of the RTIL[C4mim][PF6]could be the main reason for allowing the sample to pass through the ionic liquid plug and the column[27]. The capacity of retention of the column was90%.The dependence of the percent of recovery of Cd on sample loading?ow rate is shown in Fig.3.A?ow rate of4mL min?1was chosen for further work. 3.3.Elution of the RTIL phase from the column
To elute the RTIL phase retained within the column,a group of solvents miscible with[C4mim][PF6]were studied.Therefore,com-mon organic solvents such as ethanol,methanol,and acetone were chosen.The selection of these solvents was made based on the high solubility that[C4mim][PF6]shows in these media[28–30].Both acetone and ethanol resulted to be the most effective for RTIL phase and Cd–5-Br-PADAP complex removal from the column.
However,Fig.3.Dependence of recovery of Cd on loading sample?ow rate.Experimental conditions are listed in Table1.
it was preferred ethanol to acetone due to major compatibility of the alcohol with tubes and valve materials used in the FI system. Likewise,sharper peaks were observed with ethanol.Finally,the eluent was acidi?ed with nitric acid in order to induce dissociation of Cd–Br-PADAP complex and further releasing of Cd into solution.
A nitric acid concentration of0.5mol L?1was chosen.
The effect of?ow rate of eluent on analyte signal is shown in Fig.4.As can be seen,the optimum?ow rate of eluent was 6mL min?1.Therefore,the elution?ow rate was compatible with the aspiration?ow of the FAAS instrument[31].Additionally, elution of the analyte through the column was developed in coun-tercurrent,which was especially favorable to obtain sharp and well-de?ned peaks.
The combination of[C4mim][PF6]with other“green”solvent such as ethanol,avoided the use of hazardous toxic and?ammable solvents,while increasing FAAS sensitivity with respect to an aque-ous solvent.The analyte was completely eluted from the column in 6s.
3.4.Extraction and analytical performance
An extraction percentage higher than99.9%was achieved when the procedure was carried out under the optimal experimental
con-
Fig.4.Dependence of recovery of Cd on elution?ow rate.Experimental conditions are listed in Table1.
E.M.Martinis et al./Talanta78(2009)857–862861
Table3
Accuracy of the proposed method(95%con?dence interval;n=6).
Sample Base value
(?g L?1)Quantity of
Cd2+added
(?g L?1)
Quantity of
Cd2+found
(?g L?1)
Recovery
(%)a
PET 1.0– 1.0±0.08–
1.05 6.1±0.29102
1.01011.1±0.47101
HDPE0.61–0.61±0.06–
0.615 5.7±0.32102
0.611010.5±0.4599
PVC25.0–25.0±0.98–
25.0530.0±1.29100
25.01035.1±1.45101
LDPE0.55–0.55±0.06–
0.555 5.45±0.3798
0.551010.5±0.49100
PP0.70–0.68±0.07–
0.705 5.6±0.2898
0.701010.6±0.4499
PS 1.1– 1.1±0.10–
1.15 6.1±0.31100
1.11011.3±0.49102
a100×[(Found?base)/added].
ditions(Table1).The obtained enhancement factor for a sample volume of20mL was35.The enhancement factor was obtained as the ratio of the slopes of the calibration curves for Cd with and without the preconcentration step.
The relative standard deviation(R.S.D.)resulting from the anal-ysis of10replicates of20mL solution containing10?g L?1Cd2+ was3.9%.The calibration graph was linear with a correlation coef-?cient of0.9998at levels near the detection limits and up to at least 50?g L?1.The regression equation was A=0.0219C+0.007,where A is the absorbance and C is the concentration of Cd in?g L?1. The limit of detection(LOD),calculated based on three times the standard deviation of the background signal(3 ),was6ng g?1.The frequency of analysis was nine samples per hour.
3.5.Accuracy of the method and cadmium determination in real samples
To demonstrate the accuracy of the proposed method,a recovery study was performed evaluating any matrix interferences and/or possible analyte losses during the sample pre-treatment of differ-ent food packaging materials:PET,HDPE,PVC,LDPE,PP and PS. Thus,the method was applied to six portions of0.5g for each plastic material.All the samples were digested and analyzed following the procedure described before.The average concentration of Cd found was taken as a base value.Then,increasing quantities of Cd were added to the other aliquots of sample and the analyte was deter-mined by the same method.As shown in Table3,analyte recoveries were all around100%.
The method was applied for Cd determination in different food packaging plastic materials collected from the local market.Cad-mium concentrations were in the range of n.d.–0.20mg kg?1 for PET;n.d.–0.12mg kg?1for HDPE; 5.1–10.4mg kg?1for PVC;n.d.–0.11mg kg?1for LDPE;n.d.–0.14mg kg?1for PP and n.d.–0.22mg kg?1for PS,at95%con?dence interval(n=6).The proposed method was also validated by comparison of the results obtained by a different technique(Table4).Determinations by ETAAS were performed by measuring direct aliquots of the digested samples.This was possible due to the low LOD that are possible to reach for Cd with ETAAS.The results were compared by applying the F-test and no signi?cant differences at the95%con?dence level were observed.Table4
Concentration of Cd in food packaging materials(95%con?dence interval;n=6). Sample Proposed method(mg kg?1)ETAAS(mg kg?1)
PET0.05±0.010.07±0.01
0.20±0.020.19±0.02
n.d.a n.d.a
HDPE0.12±0.010.12±0.01
n.d.a n.d.a
n.d.a n.d.a
PVC 5.1±0.22 5.1±0.32
10.4±0.4210.5±0.51
8.4±0.408.4±0,49
LDPE0.05±0.010.07±0.01
0.11±0.020.14±0.02
n.d.a n.d.a
PP n.d.a n.d.a
0.09±0.010.10±0.01
0.14±0.020.12±0.01
PS0.22±0.030.21±0.03
0.04±0.010.05±0.01
n.d.a n.d.a
a Non-detectable.
4.Conclusion
In this work,an original FI system with on-line RTIL phase sep-aration coupled to FAAS detection for Cd determination in plastic materials is proposed.Thus,the excellent extraction ef?ciency asso-ciated with RTILs in combination with the possibility of performing an on-line procedure opens up an attractive alternative in the area of automated separation and preconcentration methodologies.The on-line retention of the RTIL phase by using a silica gel-packed column simpli?es the preconcentration methodology while reduc-ing manual operation and risk of contamination.Furthermore,the effect of several variables,including physical,chemical and hydro-dynamic characteristics,on the on-line retention of the RTIL phase has been studied.A sensitivity enhancement factor of35was achieved.The use of the5-Br-PADAP–[C4mim][PF6]extraction sys-tem allowed the reliable and accurate determination of Cd in food packaging material.
Acknowledgements
This work was supported by Consejo Nacional de Investigaciones Cientí?cas y Técnicas(CONICET)and Agencia Nacional de Promo-ción Cientí?ca y Tecnológica(FONCYT)(PICT-BID)(FONTAR–NO PMT II–CAI/073)(Argentina).
References
[1]K.Marsh,B.Bugusu,J.Food Sci.72(2007)R39.
[2]A.W.Birley,Food Chem.8(1982)81.
[3]D.O.Hummel,Atlas of Plastics Additives—Analysis by Spectrometric Methods,
Springer,Germany,2002.
[4]I.D.Rosca,J.M.Vergnaud,Polym.Test25(2006)532.
[5]D.Thompson,S.J.Parry,R.Benzing,J.Radioanal.Nucl.Chem.213(1996)349.
[6]M.W.Kadi,Asian J.Chem.17(2005)40.
[7]W.Shotyk,M.Krachler,Environ.Sci.Technol.41(2007)1560.
[8]A.Ritter,E.Michel,M.Schmid,S.Affolter,Polym.Test23(2004)467.
[9]R.B.Hayes,Cancer Causes Contr.8(1997)371.
[10]T.Nawrot,M.Plusquin,J.Hogervorst,H.A.Roels,H.Celis,L.Thijs,J.Vangronsveld,
E.Van Hecke,J.A.Staessen,Lancet Oncol.7(2006)119.
[11]H.Sakurai,J.Noro,A.Kawase,M.Fujinami,K.Oguma,Anal.Sci.22(2006)225.
[12]E.Skrzydlewska,M.Balcerzak,Chem.Anal.Wars.48(2003)909.
[13]F.Kubota,M.Goto,Solvent Extr.Res.Dev.13(2006)23.
[14]Z.Li,J.Chang,H.Shan,J.Pan,Rev.Anal.Chem.26(2007)109.
[15]G.Singh,A.Kumar,Indian J.Chem.A47(2008)495.
[16]H.Zhao,S.Xia,P.Ma,J.Chem.Technol.Biotechnol.80(2005)1089.
[17]J.F.Liu,G.B.Jiang,J.A.J?nsson,TrAC,Trends Anal.Chem.24(2005)20.
862 E.M.Martinis et al./Talanta78(2009)857–862
[18]S.Pandey,Anal.Chim.Acta556(2006)38.
[19]M.A.Taher,A.Mostafavi,S.Z.M.Mobarake,D.Afzali,Bull.Chem.Soc.Ethiopia
20(2006)1.
[20]https://www.360docs.net/doc/fc9086542.html,ra,R.G.Wuilloud,J.A.Salonia,R.A.Olsina,L.D.Martinez,Anal.Bioanal.
Chem.371(2001)989.
[21]P.R.Aranda,R.A.Gil,S.Moyano,I.E.De Vito,L.D.Martinez,Talanta75(2008)
307.
[22]J.C.A.De Wuilloud,R.G.Wuilloud,M.F.Silva,R.A.Olsina,L.D.Martinez,Spec-
trochim.Acta,Part B57(2002)365.
[23]E.M.Martinis,R.A.Olsina,J.C.Altamirano,R.G.Wuilloud,Anal.Chim.Acta628
(2008)41.[24]S.Carda-Broch,A.Berthod,D.W.Armstrong,Anal.Bioanal.Chem.375(2003)
191.
[25]J.Nan,Y.Jiang,X.P.Yan,J.Anal.At.Spectrom18(2003)946.
[26]M.Baghdadi,F.Shemirani,Anal.Chim.Acta613(2008)56.
[27]M.Cruz-Vera,R.Lucena,S.Cárdenas,M.Valcárcel,J.Chromatogr.A1202(2008)
1.
[28]K.A.Fletcher,S.Pandey,https://www.360docs.net/doc/fc9086542.html,107(2003)13532.
[29]J.Zhang,W.Wu,T.Jiang,H.Gao,Z.Liu,J.He,B.Han,J.Chem.Eng.Data48(2003)
1315.
[30]M.T.Zafarani-Moattar,R.Majdan-Cegincara,J.Chem.Eng.Data52(2007)2359.
[31]H.Chen,J.Liu,X.Mao,Anal.Chim.Acta370(1998)151.