高压多晶X 射线衍射方法的发展及其在地球深部研究中的应用
Research
Deep Matter &Energy—Review
Development of High-Pressure Multigrain X-Ray Diffraction for Exploring the Earth’s
Interior
Li Zhang a ,?,Hongsheng Yuan a ,Yue Meng b ,Ho-Kwang Mao a ,c
a
Center for High Pressure Science and Technology Advanced Research (HPSTAR),Shanghai 201203,China b
HPCAT,X-Ray Science Division,Argonne National Laboratory,Argonne,IL 60439,USA c
Geophysical Laboratory,Carnegie Institution of Washington,Washington,DC 20015,USA
a r t i c l e i n f o Article history:
Received 3September 2018Revised 16January 2019Accepted 1February 2019Available online 6April 2019Keywords:High pressure
Synchrotron X-ray Multigrain
Diamond anvil cell Minerals Petrology
Earth’s interior
a b s t r a c t
The lower mantle makes up more than a half of our planet’s volume.Mineralogical and petrological experiments on realistic bulk compositions under high pressure–temperature (P –T )conditions are essen-tial for understanding deep mantle processes.Such high P –T experiments are commonly conducted in a laser-heated diamond anvil cell,producing a multiphase assemblage consisting of 100nm to submicron crystallite grains.The structures of these lower mantle phases often cannot be preserved upon pressure quenching;thus,in situ characterization is needed.The X-ray diffraction (XRD)pattern of such a multi-phase assemblage usually displays a mixture of diffraction spots and rings as a result of the coarse grain size relative to the small X-ray beam size (3–5l m)available at the synchrotron facilities.Severe peak overlapping from multiple phases renders the powder XRD method inadequate for indexing new phases and minor phases.Consequently,structure determination of new phases in a high P –T multiphase assemblage has been extremely dif?cult using conventional XRD techniques.Our recent development of multigrain XRD in high-pressure research has enabled the indexation of hundreds of individual crystallite grains simultaneously through the determination of crystallographic orientations for these individual grains.Once indexation is achieved,each grain can be treated as a single crystal.The combined crystallographic information from individual grains can be used to determine the crystal structures of new phases and minor phases simultaneously in a multiphase system.With this new development,we have opened up a new area of crystallography under the high P –T conditions of the deep lower mantle.This paper explains key challenges in studying multiphase systems and demonstrates the unique capabilities of high-pressure multigrain XRD through successful examples of its applications.
ó2019THE AUTHORS.Published by Elsevier LTD on behalf of Chinese Academy of Engineering and Higher Education Press Limited Company.This is an open access article under the CC BY-NC-ND license
(https://www.360docs.net/doc/f518283883.html,/licenses/by-nc-nd/4.0/).
1.Introduction
Various high pressure–temperature (P –T )experimental tech-niques have been developed in order to study mantle minerals existing in the Earth’s interior.Under increasing P –T conditions that correspond to those of the deep Earth,the crystal structures of minerals that are stable under low P –T conditions are replaced by denser structures.The pyrolitic composition of the lower man-tle has been tested using high P –T experiments [1,2].At least ?ve oxide components are required to describe the mantle system.Even in a single bulk composition (e.g.,mid-ocean ridge basalt
(MORB)or pyrolite),phase changes are associated with element partitioning within the assemblage under high P –T conditions.Interactions of subducting slabs with the mantle system further complicate their phase relations [3,4].For example,some amounts of water may be stored in nominally anhydrous lower mantle phases,but the presence of water components in subducting slabs may also stabilize hydrous phases under P –T conditions.Petrolo-gical experiments have been widely conducted in a multi-anvil apparatus up to the P –T range of the top of the lower mantle (<30GPa)[5],and the P –T range can be extended to the middle of the lower mantle ($50GPa)when sintered diamond anvils are used [2].
The ambition to explore the whole interior of the Earth has pro-moted extensive use of the laser-heated diamond anvil cell (DAC).Diamond is the hardest known material and is transparent to
?Corresponding author.
E-mail address:zhangli@https://www.360docs.net/doc/f518283883.html, (L.Zhang).
X-rays.Typically,a sample assembly less than50l m in diameter and about10l m in thickness is compressed between the tips of two diamond anvils and laser-heated from both sides of the sample[6].Megabar pressure was?rst achieved40years ago, allowing the simulation of deep-Earth P–T conditions[7].Through development of the DAC and laser-heating techniques,experiments have been conducted to study the structure of iron(Fe)under the inner-core P–T conditions of up to377GPa and5700K[8].These experiments have mostly been limited to a single mineral phase or a simple system(e.g.,MgO–SiO2).However,interpretations of key enigmatic features in the deep lower mantle—namely,the sharp upper boundary of the D00layer[9],the seismic anisotropy [10],and the large low-shear-velocity provinces in the bottom third of the lower mantle[11]—require information from high P–T petrological experiments on a realistic lower mantle multicomponent system,which produces an assemblage consisting of multiple phases under high P–T conditions in a laser-heated DAC.
In a multiphase assemblage,most diffraction peaks overlap in a powder X-ray diffraction(XRD)pattern;even without overlap, powder XRD alone is inadequate for studying new structures. Single-crystal XRD is regarded as the ideal method for structural analysis,and has been widely developed for high-pressure research in a DAC[12–14].However,single crystals of around 5m m in size,as required for conventional single-crystal XRD experi-ments,are unachievable in a realistic mantle assemblage under the corresponding high P–T conditions.Instead,a polycrystalline multiphase sample is always obtained in phase equilibrium experi-ments corresponding to the deep mantle.In this paper,we review the applications of the multigrain XRD technique for studying multiphase systems under high P–T conditions,including in situ characterization of new phases in a multiphase assemblage,crystal structure determination of selected individual grains in a polycrys-talline sample,and two-dimensional(2D)mapping through the precise determination of unit-cell parameters for individual phases at steps of a few microns.
2.Challenges in experimental petrology under high P–T conditions
Phase identi?cation and structural analysis in a multiphase assemblage have long been recognized as a challenge in high-pressure research.Frost and Fei[15]pointed out dif?culties in identifying the hydrous phases D,F and G,of dense hydrous mag-nesium silicates from powder XRD patterns of recovered samples when the synthesis pressure was as low as22GPa.However,if such a multiphase assemblage contains individual crystals with grain sizes greater than5l m and the structure can be preserved under ambient conditions,these grains can be picked out for single-crystal studies in the recovered sample.
Higher pressure is generated in an apparatus at the expense of sample volume.The sample volume decreases from a few milli-meters in dimension in a multi-anvil apparatus to tens of micrometers at above60GPa in a DAC.Furthermore,most structures obtained at ultrahigh pressures,such as MgSiO3or(Mg,Fe)SiO3post-perovskite (pPv),cannot be preserved under ambient conditions[16–18]. Meanwhile,the grain size in a polycrystalline sample generally decreases with increasing pressure.For example,the grain size of a hydrous phase in a mantle assemblage could be as small as about 100nm under the high P–T conditions of the deep lower mantle [4].The grain size of the hydrous d-phase decreases from about 2l m at68GPa to about200nm at128GPa after heating treat-ment at a similar temperature[4],indicating that pressure has a dominant effect on grain size.Other factors may also in?uence grain size;for example,lower temperature tends to decrease grain size[19].The recovery of tiny crystals(<1l m)for single-crystal diffraction thus becomes practically infeasible.In conclusion, in situ characterization is needed in order to study phase changes and structural details in a multiphase system under the P–T condi-tions of the deep lower mantle.
High P–T conditions produce a wealth of new structures.In a high P–T experiment,a few new peaks often appear in a powder XRD pattern;however,a perfect match to a known structure is not easy to?nd.One type of new structure is due to atom rear-rangement into a denser structure,such as the B1–B2structural transition in NaCl.Another type involves new pressure-induced stoichiometry,such as NaCl3and Na3Cl[20].In situ structure deter-mination of a high-pressure phase can be very challenging when the chemical composition is not known.In a petrological experi-ment,phase transitions are often associated with compositional changes under high P–T conditions.For example,in a high P–T experiment on a natural MORB composition,a four-phase assemblage of the MgSiO3-rich pPv phase,a-PbO2-type SiO2, Ca-perovskite,and CaFe2O4-type Al-phase was identi?ed by a com-bination of in situ powder XRD and ex situ transmission electron microscopy(TEM)under the P–T conditions of the deep lower mantle,in which the pPv phase has a high Na2O content and a high ratio of Fe3+/total Fe[21].Solving the complex structures of the pPv phase under realistic deep lower mantle conditions is beyond the capabilities of existing powder XRD methods.Furthermore,a minor phase will be overshadowed by the diffraction peaks of coexisting phases in a powder XRD pattern of a multiphase assem-blage,making phase identi?cation of a minor phase extremely dif-?cult using the powder XRD technique.
In summary,conventional single-crystal or powder diffraction techniques are inadequate for studying multiphase systems under high P–T conditions.New methods are required in order to explore phase changes and their detailed structures occurring in the deep lower mantle.
3.In situ multigrain synchrotron XRD
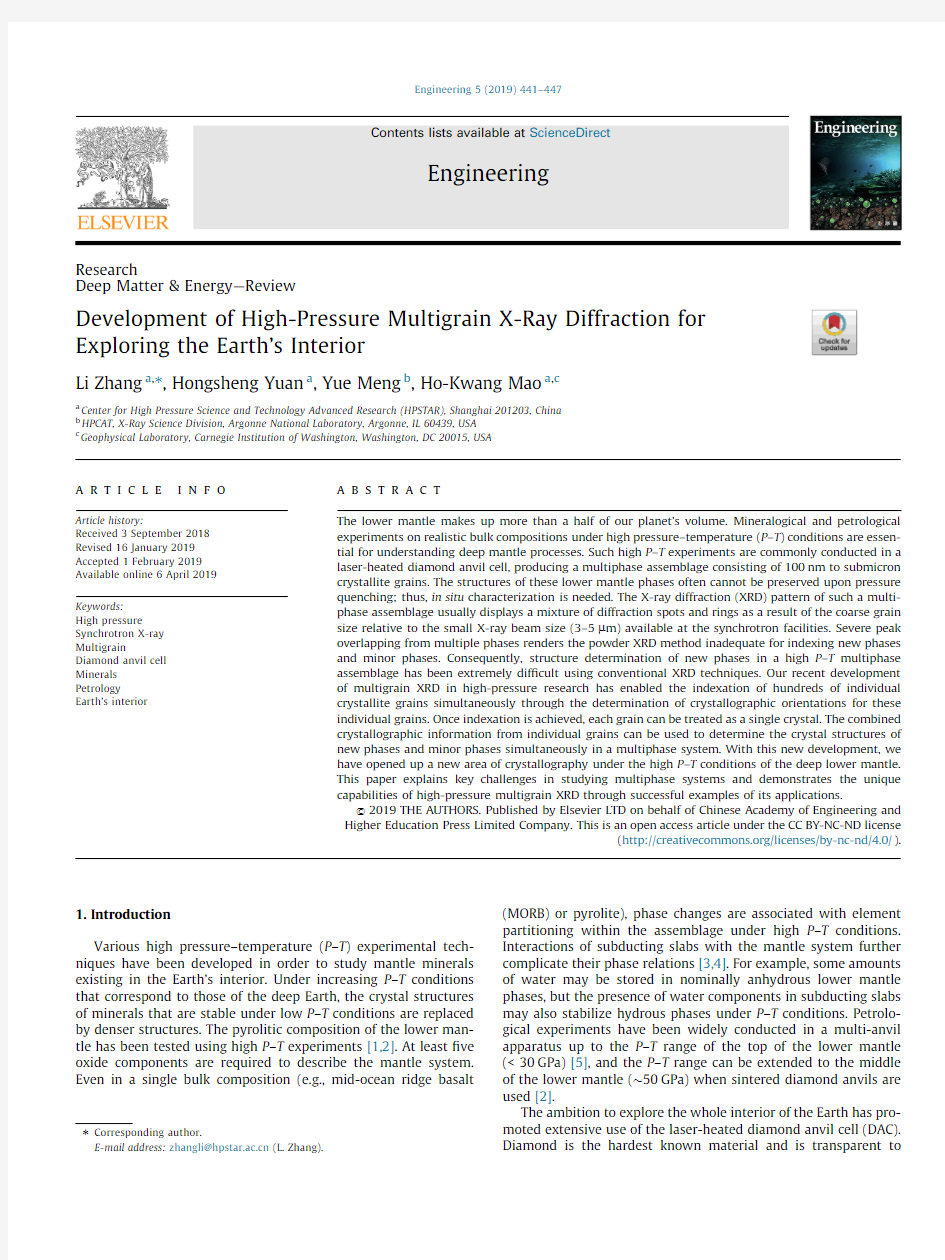
Synchrotron radiation X-rays have been regarded as an ideal probe for in situ studies of materials under high P–T conditions in a laser-heated DAC[22–24].Heat treatment often promotes crystal growth,and spotty powder XRD patterns of mantle phases are obtained under high P–T conditions.Fig.1shows a representative spotty powder XRD pattern of(Mg,Fe)SiO3pPv[25].Such a spotty pattern is a combined result of the small X-ray beam size ($6?8l m2full width at half maximum)and crystal growth upon heating at about2400K.The recent development of high-pressure beamlines has enabled reduction of the X-ray beam to the current 2–3l m[22],which can help to reduce the level of overlapping spots in powder XRD patterns.
The recent achievement of multigrain XRD in high-pressure research has made it possible to index hundreds of individual crys-tallite grains simultaneously through the determination of crystal-lographic orientations for these individual grains[25,26].Once indexation is achieved,a multiphase assemblage can then be trea-ted as an aggregate of thousands of individual single crystals.An accurate and ef?cient indexing algorithm is required to process such datasets.We have found that GrainSpotter[27],which is part of the FABLE package[28],is an ef?cient algorithm that can be readily applied to a rotation-scan dataset for indexing grains in an assemblage contained in a DAC[25,29,30].In some cases,experi-enced crystallographers can index a few grains manually in a high-pressure rotation dataset and solve their crystal structures[6,31]. However,only by applying the multigrain XRD method to search and index tens to hundreds of grains for each individual phase simultaneously,it is possible to systematically study crystal struc-tures of each individual phase including a minor phase.
442L.Zhang et al./Engineering5(2019)441–447
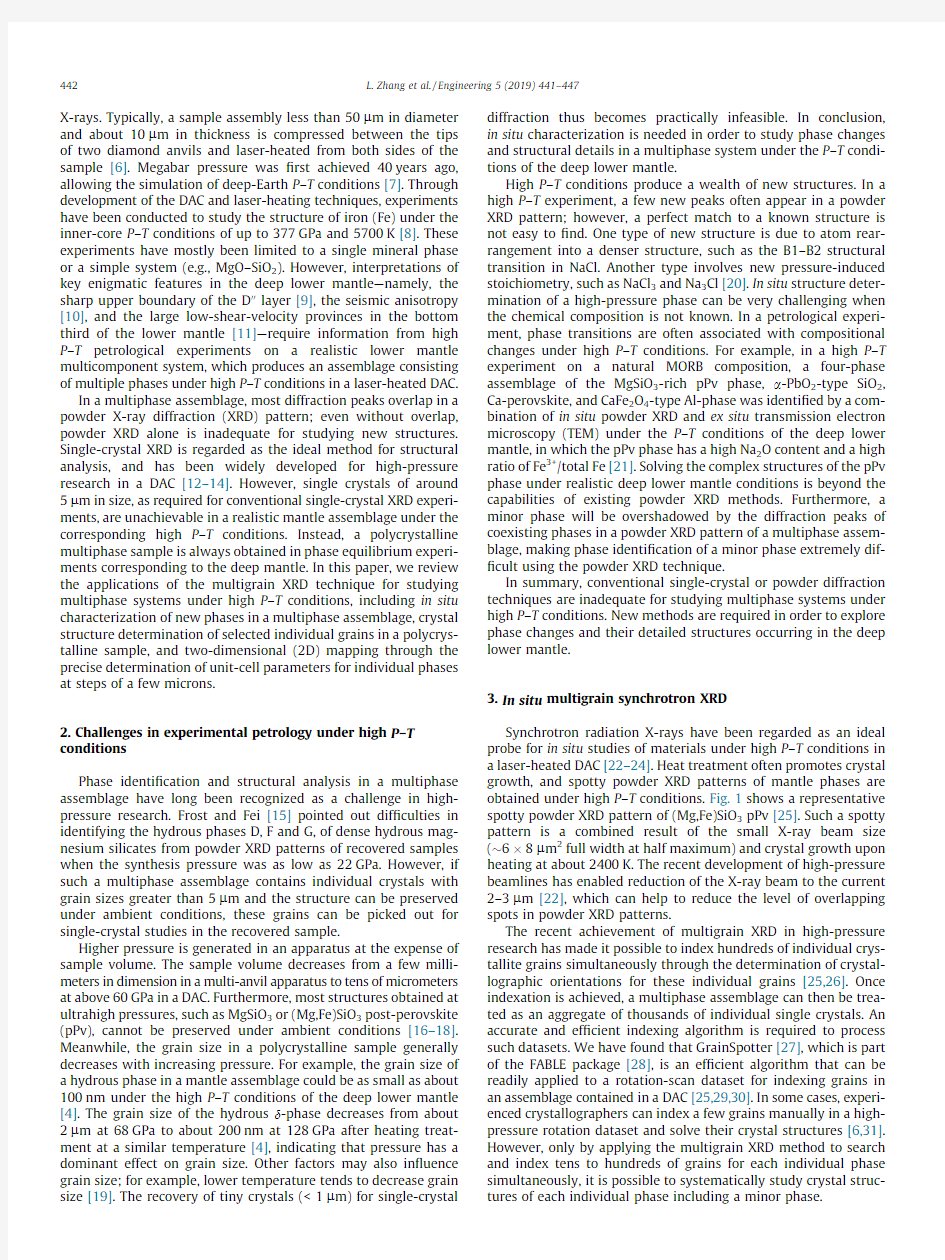
Fig.2shows the setup for high-pressure multigrain XRD data collection.Similar to the ‘‘rotation method”used in conventional single-crystal crystallography,diffraction patterns in step-scans are collected on a rotation stage up to the maximum angular access allowed by the DAC design.We have achieved a good balance between an angular access of 50°–60°for X-rays and the mainte-nance of stable high pressures up to the core-mantle boundary (CMB)at 136GPa.We used angular steps as small as 0.2°to improve the signal-to-noise ratio in XRD patterns.We used an exposure duration ranging from 1to 10s per frame in our experi-ments,and tested the exposure before each collection until the strongest diffraction spots were near intensity saturation.Software packages,including CrysAlis [32],XDS [33],and GSE_ADA/RSV [34],were used to calculate the intensities of the re?ections in a high-pressure dataset.The structure solution and re?nement steps were performed by conventional single-crystal programs,such as,the SHELX package [35].
The synthesis of high-quality individual crystallites within the assemblage is the prerequisite for applying the high-pressure multigrain XRD technique.It has been found that a quasi-hydrostatic sample environment and stable heating signi?cantly promote crystal growth under high P –T conditions in a laser-heated DAC [29].In mantle petrological experiments,phase chem-istry is frozen after temperature quenching;most structures are temperature-quenchable but often not pressure-quenchable,so a multigrain sample is often indexed in situ at high pressure and after temperature quenching.
Spotty diffraction patterns enable multigrain indexation,but such spottiness can result in unreliable intensity measurements in an integrated powder XRD pattern,leading to unreliable estima-tion of phase proportions in an assemblage.Spottiness implies crystal growth in the assemblage,in contrast to the smooth rings that are displayed in an XRD pattern of a ?ne-grained sample.In a sample synthesis,the high-temperature conditions required for crystal growth should facilitate thermodynamic equilibrium.On the other hand,the kinetics in phase transitions in a coarse-grained starting sample can be much slower than that occurring in a ?ne-grained sample under similar P –T conditions,because the higher surface area in a ?ne-grained sample can facilitate the nucleation for a phase transformation.Spotty XRD patterns are commonly observed in high P –T experiments conducted in a laser-heated DAC,and more attention should be paid to the kine-tics issues in phase transitions occurring in coarse-grained samples.4.Applications of multigrain XRD in high-pressure experiments Multigrain XRD enables the phase identi?cation and structural analysis of tiny individual grains in a multiphase assemblage con-tained in a DAC.Here,we summarize the applications of in situ multigrain synchrotron XRD for the phase identi?cation of unknown phases and minor phases,the determination of high-pressure crystal structures,and the re?nement of unit-cell para-meters by merging re?ections from multiple grains for each individual phase.
4.1.Phase identi?cation in a multiphase assemblage
The unique capability of multigrain XRD has been demonstrated for the phase identi?cation of an unknown phase in a mixture.When Fe-bearing bridgmanite (Bdg)decomposes to a nearly Fe-free MgSiO 3Bdg and a Fe-rich phase with a hexagonal structure (H-phase),only three peaks above 2.4?were speci?c to the H-phase,with many peaks of the Bdg phase overlapping with other peaks of the H-phase [29].By searching for the orientation matri-ces of individual grains,154grains of the H-phase were indexed from one rotation XRD dataset.A grain is indexed when tens to hundreds of re?ections are shown to satisfy the stringent geomet-rical angles determined by its particular orientation matrix.Each re?ection has three variables (x ,g ,and 2h )to constrain the orien-tation matrix,where x ,g ,and h represent the rotation,azimuth,and Bragg angles (Fig.2),respectively.Furthermore,154individual crystallites,each with its particular orientation matrix,redundantly con?rmed the same lattice.
Powder XRD patterns only contain d -spacing information,and successful indexing of several obvious peaks for a new phase can sometimes lead to an incorrect unit cell.For example,the recently discovered hexagonal hydrous phase (HH-phase)in (Fe,Al)OOH was examined using the multigrain XRD,and its lattice parameters of a =10.5803(6)?and c =2.5897(3)?were obtained at 110GPa [36].However,if the weak peaks of (211)and (311)in the powder XRD pattern were not selected for indexing,a small orthorhombic lattice was obtained instead,with the lattice parameters
of
Fig. 1.A representative spotty powder XRD pattern of (Mg,Fe)SiO 3pPv.The diffraction pattern was collected at a ?xed x angle at 120GPa after temperature quenching from 2400K,showing the spottiness of the XRD pattern.Ne:neon.Reproduced from Ref.[25]with permission of PNAS,ó
2013.
Fig.2.Experimental setup for high-pressure multigrain XRD data collection in a DAC.The sample is aligned to the rotation center,and a set of 2D XRD patterns are collected at small incremental steps,e.g.,0.2°,to the angular access of a DAC,typically 50°–60°,where x ,g ,and h represent the rotation,azimuth,and Bragg angles of each re?ection,respectively.
L.Zhang et al./Engineering 5(2019)441–447443
a =4.03(2)?,
b =3.699(5)?,and
c =2.78(1)?.However,this orthorhombic lattice di
d not pass th
e three-dimensional (3D)multigrain XRD test because most o
f the re?ections predicted from a speci?c orientation matrix were not found in the measured rota-tion dataset.It was only when the hexagonal lattice was input for searchin
g that 104re?ections were observed at the predicted angles for one of the crystallites and 27individual crystallites were found,eac
h with its particular orientation matrix,con?rming the correct lattice of the HH-phase [36].
The unique power of multigrain XRD has been further demon-strated by its capability to identify a minor phase in an assemblage.Most peaks of a minor phase are overshadowed by the diffraction of major phases in a powder XRD pattern.In a previous experi-ment,seifertite (SiO 2)was found to exist as a minor phase in a lower mantle assemblage;only peak (110)was visible without overlapping with the peaks from the major phase pPv [30],as shown in Fig.3(a).Still,over 100grains of seifertite were con-?rmed by applying multigrain XRD,although most grains showed
weak diffraction due to their tiny grain sizes.The proportion of a minor phase to a major phase can be roughly estimated by the relative intensities in the integrated powder diffraction peaks (Fig.3(a)).In a multigrain XRD dataset,sometimes only a small number of grains can be indexed for a minor phase.Nevertheless,a tiny grain from a minor phase can still be identi?ed and treated as a single crystal,which is otherwise impossible using conventional XRD techniques (Fig.3(b)).Thus,the development of high-pressure multigrain XRD enables these previously impossible tasks and drives forward laboratory exploration of the Earth’s entire interior.4.2.Crystal structure determination
The (Mg,Fe)SiO 3-pPv phase has been a focus of study since its discovery in 2004as a dominant mineral in the bottom of the lower mantle [16–18].Compositional variations in pPv can induce changes in its density and structure;thus,even subtle structural changes have signi?cant implications for interpretations of the seismic and dynamic features observed near the CMB.For example,the pPv phase synthesized in a MORB composition was enriched in Na 2O and had a high ferric content [21].On the other hand,the pPv phase may have become very Fe-enriched at the CMB in contact with the liquid iron core [18].Chemical composition in individual phases can be measured by ex situ TEM on a recovered sample;however,determination of structure changes induced by chemical impurities in the pPv phase is beyond the existing capabilities of powder XRD and theoretical methods.In addition,the pPv struc-ture cannot be preserved after recovery under ambient conditions.Thus,in situ crystal structure determination is required.A high-quality multigrain sample of (Mg,Fe)SiO 3-pPv was synthesized in a quasi-hydrostatic neon (Ne)environment (Fig.1),and in situ crystal structure determination was performed on an individual grain of pPv selected by the multigrain method [25].The structure of this Fe-depleted pPv shows a nearly identical structure to that of the MgSiO 3predicted by theory [16].To the best of our knowledge,this is the ?rst single-crystal structure determination of the pPv phase;it demonstrates the feasibility of in situ crystal structure determination of submicron crystallites above megabar pressures.This technique can then be applied to investigate the structure changes induced by compositional variations in high-pressure minerals in the future.
A DAC has a limited angular access;in a multigrain sample,several grains with different orientations can be scaled and merged to increase the coverage of a structure for the structure determination [30].Clearly,re?ection conditions combined from multiple grains can provide a more de?nite determination of the space group of a high-pressure phase.The intensities of the re?ections from each selected grain were calculated using the XDS software,and com-patibility between the data sets was checked by merging them using the XSCALE software in the XDS package [33].For example,a total of 613re?ections were combined from the merged datasets of six grains to provide a redundancy of 6.6and data completeness of 92%in the d -spacing range down to 0.72?,which allowed high-quality structure re?nement for seifertite at 129GPa [30].Note that CrysAlis and other softwares may also be used for integration and scaling purpose.In situ crystal structure determination enabled by high-pressure multigrain synchrotron XRD opens up a new area of megabar crystallography by providing crystallographic solutions that are otherwise extremely dif?cult to achieve using conventional XRD techniques [25,30].
4.3.Determination of unit-cell parameters in a multiphase assemblage The determination of unit-cell parameters for individual phases in an assemblage is a common task in mineralogical and petrolog-ical studies.To ensure a high-quality sample and reliable
pressure
Fig.3.XRD data of a phase assemblage including a dominant pPv phase and a minor phase of seifertite (SiO 2).(a)An integrated powder XRD pattern showing the weak proportion of SiO 2at 129GPa and after temperature quenching;(b)the multigrain XRD pattern including two Friedel pairs of {221}from one selected grain of seifertite.S:silica.Reproduced from Ref.[30]with permission of GeoScienceWorld,ó2016.
444L.Zhang et al./Engineering 5(2019)441–447
determination,a pressure medium and/or thermal insulator,a pressure calibrator,and sometimes a laser absorber are loaded together with the sample into a DAC chamber of only tens of micrometers in diameter.During high P–T treatment or after tem-perature quenching,most peaks from these materials overlap in a powder XRD pattern.Only a few peaks can be selected for the unit-cell determination of the sample or the pressure scale,which leads to large uncertainties.Fortunately,multigrain XRD makes it possi-ble to constrain the unit-cell parameters from many re?ections belonging to an individual grain.The3D orientation and geometri-cal relationships in the multigrain dataset allow the separation of re?ections with close https://www.360docs.net/doc/f518283883.html,ing seifertite as an example, the uncertainties in the unit-cell parameters were gradually reduced by increasing the number of re?ections merged from mul-tiple grains in the re?nement[30].For this reason,uncertainties of the unit-cell parameters from the multigrain dataset are mainly de?ned by the resolution of the monochromator within0.1%.
Conversely,precise unit-cell parameters can be used to evaluate subtle compositional effects on the mineral phases.Iron enters the crystal structures of all dominant lower mantle phases—silicate Bdg,pPv,and ferropericlase[37,38].Multigrain XRD was applied to calculate the unit-cell parameters of the coexisting pPv and H-phase in(Mg,Fe)SiO3at119GPa[39].Because the uncertainties of the unit-cell parameters were reduced by increasing the number of re?ections in the re?nement(>150re?ections),the re?ned unit-cell parameters were able to resolve small differences of the Fe content across the center area(20–30l m)of a laser-heated area, while the sample pressure remained unchanged in the Ne quasi-hydrostatic environment.The unit-cell volumes of the pPv phase decreased by only0.16%over a10l m distance from the heating center to a colder region,while the unit-cell volume of the H-phase decreased by0.54%over the same distance,indicating that both phases were more Fe-enriched in the slightly hotter center [39].In contrast to the Soret effect that drives heavy elements,such as Fe,from hot to cold regions,we conclude that the observed Fe distribution was caused by a temperature effect on the element partitioning.Thus,high-pressure multigrain XRD can be applied to calculate the unit-cell parameters of each individual phase precisely that allows2D mapping of element partitioning or phase distributions.
https://www.360docs.net/doc/f518283883.html,bination of in situ XRD and ex situ TEM techniques:An example
In high P–T petrological experiments,ex situ chemical analysis on recovered samples is required to connect compositional changes associated with structural transformations determined by in situ XRD.The focus ion beam(FIB)has been widely used to cut and lift out a thin cross-section in a laser-heated sample in a DAC[40].The thin section can then be analyzed in a TEM.Ex situ TEM analysis combining electron diffraction and energy dispersive spectrometer(EDS)chemical analysis can be used to verify the phases under ambient conditions.The consistency between in situ multigrain XRD and ex situ TEM analysis should be carefully checked.To ensure consistency,we always prepared a TEM speci-men from the heating center where in situ XRD data were mea-sured under high P–T.Meanwhile,2D XRD scans were performed to record the phase distribution under high P–T as well as after recovery to ambient conditions.Note that most high-pressure structures are unquenchable to ambient conditions,and the recov-ered sample can sometimes be contaminated in the sample prepa-ration for a TEM thin section.
Here,we provide an example to demonstrate the identi?cation of hydrous phases in a multiphase assemblage through the combi-nation of in situ synchrotron XRD and ex situ TEM.The identi?ca-tion of hydrous phases in realistic lower mantle compositions is essential in order to understand the deep-water storage.We used a hydrous gel as our starting material with a composition of 30mol%Al2O3–10mol%Fe2O3–60mol%MgSiO3containing about 7wt%H2O.As shown in Fig.4,the XRD pattern contains a domi-nant pPv phase and a hydrous d-phase,with only one weak peak indicating the presence of the cubic pyrite-type phase(py-phase).After multigrain indexing,we unambiguously con?rmed the py-phase by sorting out42grains with13–18re?ections con-sistent with the Pa-3space group.Fig.4(b)shows a composition-mapping image of a thin cross-section from the recovered sample prepared by FIB,showing several grains belonging to a very Fe-rich phase.EDS analysis veri?ed only the elements Fe and oxygen(O)in the grains,while hydrogen(H)is undetectable if present.The grains range from50to200nm in size.From the2D element map-ping,the volume proportion of the py-phase is estimated to be less than3vol%in the assemblage.The chemical composition of these Fe-rich grains and their volume proportion in the assemblage are consistent with the in situ XRD observation of the py-phase under the high P–T conditions.
In this experiment,we used a higher Al2O3content than realis-tic compositions in order to enhance the diffraction peaks of the d-phase in the XRD patterns.In general,volatile-bearing phases exist as minor phases in a mantle assemblage.Regardless,this example demonstrated that high-pressure multigrain XRD is capable of identifying individual tiny grains of a minor hydrous phase with less than3vol%in an assemblage through a combination of in situ phase identi?cation and ex situ chemical analysis.
6.Conclusions
This paper provides an overview of the high-pressure multi-grain XRD technique,along with examples of its successful applications in studying multiphase systems under the P–T conditions of Earth’s deep lower mantle.The crystal size in a multiphase assemblage can be as small as about100nm when the sample is synthesized under megabar pressures,making it infeasible to recover individual grains;thus,in situ characteriza-tion is needed.Meanwhile,peak overlapping renders the powder XRD method inadequate for investigating unknown phases and minor phases.
In situ multigrain XRD relies on an intense synchrotron X-ray beam,DAC rotation,and a fast indexing algorithm to identify tens to hundreds of crystallites belonging to each individual phase in a multiphase assemblage;in this way,it enables robust phase identi?cation and structure determination in a multiphase assemblage.Examples were presented to illustrate the unique capabilities of the high-pressure multigrain XRD technique, including detecting the breakdown of iron-bearing Bdg into an iron-rich H-phase and Fe-free Bdg,identifying the HH-phase (Fe,Al)OOH,determining the crystal structures of(Mg,Fe)SiO3-pPv and seifertite(SiO2)under megabar pressures,measuring the unit-cell parameters of seifertite to a precision level of0.1%, and examining subtle variations of Fe content in the coexisting pPv and H-phase over a temperature gradient.In some cases, the in situ high-pressure multigrain XRD technique can be combined with ex situ TEM analysis in order to connect structural transformation with compositional changes,which was demon-strated by the discovery of the py-phase FeOOH coexisting with the pPv phase in a model composition of subducted slabs under high P–T conditions.Through these effective illustrations,we have explained key challenges in studying multiphase systems and showed the important role of high-pressure multigrain XRD in exploring the Earth’s deep interior.
L.Zhang et al./Engineering5(2019)441–447445
Acknowledgements
The authors thank the anonymous reviewers for their construc-tive comments.This work was supported by the National Natural Science Foundation of China (41574080and U1530402).Portions of this work were performed at High Pressure Collaborative Access Team (HPCAT)(Sector 16),Advanced Photon Source (APS),Argonne National Laboratory.HPCAT operations are supported by the Department of Energy (DOE)/National Nuclear Security Adminis-tration (NNSA)’s Of?ce of Experimental Sciences.The APS is a US DOE Of?ce of Science User Facility operated for the DOE Of?ce of Science by Argonne National Laboratory (DE-AC02-06CH11357).Portions of this work were performed at 15U1,Shanghai Synchrotron Radiation Facility (SSRF).Compliance with ethics guidelines
Li Zhang,Hongsheng Yuan,Yue Meng,and Ho-Kwang Mao declare that they have no con?ict of interest or ?nancial con?icts to disclose.
References
[1]Ricolleau A,Fei Y,Cottrell E,Watson H,Deng L,Zhang L,et al.Density
pro?le of pyrolite under the lower mantle conditions.Geophys Res Lett 2009;36(6):36.
[2]Irifune T,Shinmei T,McCammon CA,Miyajima N,Rubie DC,Frost DJ.Iron
partitioning and density changes of pyrolite in Earth’s lower mantle.Science 2010;327(5962):193–5.
[3]Hirose K,Fei Y,Ma Y,Mao HK.The fate of subducted basaltic crust in the
Earth’s lower mantle.Nature 1999;397(6714):53–6.
[4]Ohira I,Ohtani E,Sakai T,Miyahara M,Hirao N,Ohishi Y,et al.Stability of a
hydrous d -phase,AlOOH–MgSiO 2(OH)2,and a mechanism for water transport into the base of lower mantle.Earth Planet Sci Lett 2014;401:12–7.
[5]Bertka CM,Fei Y.Mineralogy of the Martian interior up to core-mantle
boundary pressures.J Geophys Res Solid Earth 1997;102(B3):5251–64.
[6]Lavina B,Meng Y.Unraveling the complexity of iron oxides at high pressure
and temperature:Synthesis of Fe 5O 6.Sci Adv 2015;1(5):e1400260.
[7]Mao HK,Bell PM.High-pressure physics:sustained static generation of 1.36to
1.72megabars.Science 1978;200:1145–7.
[8]Tateno S,Hirose K,Ohishi Y,Tatsumi Y.The structure of iron in Earth’s inner
core.Science 2010;330(6002):359–61.
[9]Lay T.Sharpness of the D 00discontinuity beneath the Cocos Plate:implications
for the perovskite to post-perovskite phase transition.Geophys Res Lett 2008;35(3):35.
[10]Panning M,Romanowicz B.Inferences on ?ow at the base of Earth’s mantle
based on seismic anisotropy.Science 2004;303(5656):351–3
.
Fig.4.A multiphase assemblage contains a dominant pPv phase,a hydrous d -phase,and a minor pyrite-type phase (py-phase)FeOOH.(a,b)TEM mapping shows a few Fe-rich grains,which is consistent with the existence of a minor py-phase suggested by (c)in situ XRD.
446L.Zhang et al./Engineering 5(2019)441–447
[11]Su W,Woodward RL,Dziewonski AM.Degree12model of shear velocity
heterogeneity in the mantle.J Geophys Res1994;99(B4):6945–80.
[12]Miletich R,Allan DR,Kuhs WF.High-pressure single-crystal techniques.Rev
Mineral Geochem2000;41(1):445–519.
[13]Dera P,Zhuravlev K,Prakapenka V,Rivers ML,Finkelstein GJ,Grubor-Urosevic
O,et al.High pressure single-crystal micro X-ray diffraction analysis with GSE_ADA/RSV software.High Press Res2013;33(3):466–84.
[14]Dubrovinsky L,Boffa-Ballaran T,Glazyrin K,Kurnosov A,Frost D,Merlini M,
et al.Single-crystal X-ray diffraction at megabar pressures and temperatures of thousands of degrees.High Press Res2010;30(4):620–33.
[15]Frost DJ,Fei Y.Stability of phase D at high pressure and high temperature.J
Geophys Res Solid Earth1998;103(B4):7463–74.
[16]Murakami M,Hirose K,Kawamura K,Sata N,Ohishi Y.Post-perovskite phase
transition in MgSiO3.Science2004;304(5672):855–8.
[17]Oganov AR,Ono S.Theoretical and experimental evidence for a post-
perovskite phase of MgSiO3in Earth’s D00layer.Nature2004;430(6998):445–8.
[18]Mao WL,Meng Y,Shen G,Prakapenka VB,Campbell AJ,Heinz DL,et al.Iron-
rich silicates in the Earth’s D00layer.Proc Natl Acad Sci USA2005;102
(28):9751–3.
[19]Nishi M,Irifune T,Tsuchiya J,Tange Y,Nishihara Y,Fujino K,et al.Stability of
hydrous silicate at high pressures and water transport to the deep lower mantle.Nat Geosci2014;7(3):224–7.
[20]Zhang W,Oganov AR,Goncharov AF,Zhu Q,Boulfelfel SE,Lyakhov AO,et al.
Unexpected stable stoichiometries of sodium chlorides.Science2013;342 (6165):1502–5.
[21]Hirose K,Takafuji N,Sata N,Ohishi Y.Phase transition and density of
subducted MORB crust in the lower mantle.Earth Planet Sci Lett2005;237(1–
2):239–51.
[22]Shen G,Mao HK.High-pressure studies with x-rays using diamond anvil cells,
reports on progress in physics.Physical Society2017;80:016101.
[23]Duffy TS.Synchrotron facilities and the study of the Earth’s deep interior.Rep
Prog Phys2005;68(8):1811–59.
[24]Mao HK,Chen B,Chen J,Li K,Lin JF,Yang W,et al.Recent advances in high-
pressure science and technology.Matter Radiat Extremes2016;1(1):59–75.
[25]Zhang L,Meng Y,Dera P,Yang W,Mao WL,Mao HK.Single-crystal structure
determination of(Mg,Fe)SiO3postperovskite.Proc Natl Acad Sci USA2013;110
(16):6292–5.[26]Nisr C,Ribárik G,Ungár T,Vaughan GBM,Cordier P,Merkel S.High resolution
three-dimensional X-ray diffraction study of dislocations in grains of MgGeO3 post-perovskite at90GPa.J Geophys Res2012;117(B3):B03201.
[27]Schmidt S.GrainSpotter:a fast and robust polycrystalline indexing algorithm.J
Appl Cryst2014;47(1):276–84.
[28]S?rensen HO,Schmidt S,Wright JP,Vaughan GBM,Techert S,Garman EF,et al.
Multigrain crystallography.Z Kristallogr2012;227(1):63–78.
[29]Zhang L,Meng Y,Yang W,Wang L,Mao WL,Zeng QS,et al.Disproportionation
of(Mg,Fe)SiO3perovskite in Earth’s deep lower mantle.Science2014;344 (6186):877–82.
[30]Zhang L,Popov D,Meng Y,Wang J,Ji C,Li B,et al.In-situ crystal structure
determination of seifertite SiO2at129GPa:studying a minor phase near Earth’s core-mantle boundary.Am Mineral2016;101(1):231–4.
[31]Merlini M,Han?and M,Salamat A,Petitgirard S,Müller H.The crystal structures
of Mg2Fe2C4O13,with tetrahedrally coordinated carbon,and Fe13O19, synthesized at deep mantle conditions.Am Mineral2015;100(8–9):2001–4.
[32]Oxford Diffraction Ltd.CrysAlis Red.Version p171.29.2[software];2006.
[33]Kabsch W.XDS.Acta Crystallogr D Biol Crystallogr2010;D66:125–32.
[34]Dera P.GSE-ADA data analysis program for monochromatic single crystal
diffraction with area detector.Argonne:GSECARS;2007.
[35]Sheldrick GM.A short history of SHELX.Acta Crystallogr A2008;A64:112–22.
[36]Zhang L,Yuan H,Meng Y,Mao HK.Discovery of a hexagonal ultradense
hydrous phase in(Fe,Al)OOH.Proc Natl Acad Sci USA2018;115
(12):2908–11.
[37]Lundin S,Catalli K,Santillán J,Shim SH,Prakapenka VB,Kunz M,et al.Effect of
Fe on the equation of state of mantle silicate perovskite over1Mbar.Phys Earth Planet Inter2008;168(1–2):97–102.
[38]Fei Y,Zhang L,Corgne A,Watson H,Ricolleau A,Meng Y,et al.Spin transition
and equations of state of(Mg,Fe)O solid solutions.Geophys Res Lett2007;34
(17):L17307.
[39]Zhang L,Meng Y,Mao H.Unit cell determination of coexisting post-
perovskite and H-phase in(Mg,Fe)SiO3using multigrain XRD:compositional variation across a laser heating spot at119GPa.Prog Earth Planet Sci 2016;3(1):13.
[40]Miyahara M,Sakai T,Ohtani E,Kobayashi Y,Kamada S,Kondo T,et al.
Application of FIB system to ultra-high-pressure Earth science.J Mineral Petrol Sci2008;103(2):88–93.
L.Zhang et al./Engineering5(2019)441–447447
Engineering 2 (2016) xxx–xxx
Research
Deep Matter & Energy—Review
高压多晶X 射线衍射方法的发展及其在地球深部研究中的应用
张莉 a, *, 苑洪胜 a , 孟悦 b , 毛河光 a, c
a
Center for High Pressure Science and Technology Advanced Research (HPSTAR), Shanghai 201203, China b
HPCAT, X-Ray Science Division, Argonne National Laboratory, Argonne, IL 60439, USA c
Geophysical Laboratory, Carnegie Institution of Washington, Washington, DC 20015, USA
a r t i c l e i n f o
摘要
Article history:
Received 3 September 2018Revised 16 January 2019Accepted 1 February 2019Available online 6 April 2019
下地幔占地球体积一半以上。在高温高压下对下地幔真实组分所开展的矿物学和岩石学实验是了解深部地幔演化过程的必要途径。激光加热的金刚石对顶压砧(laser-heated diamond anvil cell, LH-DAC )是开展这类高温高压实验最常用的工具,实验产物通常包括从上百纳米到数微米尺寸不一的大量晶粒所组成的多相集合体。这些下地幔相的晶体结构往往不能在卸压后保存下来,因此必须对它们进行原位表征。相对于同步辐射光源设备中可用的聚焦X 射线光斑尺寸(3~5 μm ),晶粒尺寸要小一个量级,所得到的X 射线衍射(X-ray diffraction, XRD )图谱通常显示为衍射斑点和衍射环的混合。由于多相衍射峰重叠严重,粉晶X 射线衍射法无法对新相和弱相进行鉴定,因此采用传统XRD 技术测定高温高压下多相混合物非常困难。我们最近在高压研究中所发展的同步辐射多晶X 射线衍射法可以通过测定多相组合中成千上百个晶粒各自的晶面取向,使多相体系中单晶的指标化成为可能。一旦完成指标化,多晶混合物中的每一个晶粒都可以看作是单晶。因此,我们可以同时确定多相体系中新相和弱相的晶体结构。随着这一新方法的发展,我们开辟了深下地幔高温高压条件下的结晶学新领域。本文阐述了多相体系研究中的关键技术挑战,并通过高压多相X 射线衍射法的成功应用实例,论证了该方法的独特能力。
? 2019 THE AUTHORS. Published by Elsevier LTD on behalf of Chinese Academy of Engineering and Higher
Education Press Limited Company This is an open access article under the CC BY-NC-ND license
(https://www.360docs.net/doc/f518283883.html,/licenses/by-nc-nd/4.0/).
关键词高压
同步辐射X 射线多晶
金刚石对顶压砧矿物学岩石学地球内部
1.引言
多种高温高压实验技术被开发出来以用于研究地球内部的矿物性质。地球内部的温度、压力条件随深度增加而增加,矿物在较低温度、压力条件下稳定的晶体结构将会被更致密的结构所取代。通过高温高压实验对下地幔火成岩组分进行了验证[1,2]。描述下地幔体系至少需要5种氧化物组分。即使在单一的成分组成 [如大洋中脊玄武岩(mid-ocean ridge basalt , MORB )或地幔岩]中,矿物相的变化及其组分也与高温高压条件下的元素分配
相关。而俯冲板块与地幔之间的相互作用则使其相关系进一步复杂化[3,4]。例如,一部分水可能储存在名义上无水下地幔相中,但是俯冲板块中的水还可能储存于在该温度、压力条件下稳定的含水相中。岩石学实验在大压机装置中已经得到广泛开展,其可达到的温度、压力范围与下地幔顶部(<30 GPa )相当[5],当使用烧结金刚石压砧取代碳化钨压砧时[2],大压机装置所能获取的温度、压力范围则可扩展至下地幔中部(50 GPa )。
探索整个地球内部的目标促使激光加热的金刚石对顶压砧(diamond anvil cell , DAC )得到了广泛的应用。
* Corresponding author.
E-mail address: zhangli@https://www.360docs.net/doc/f518283883.html,
(L. Zhang).
Contents lists available at ScienceDirect
Engineering
491 Author name et al. / Engineering 2(2016) xxx–xxx
钻石是已知的最坚硬的物质,又是透明的,允许X射线通过。通常,将直径小于50 μm以及厚度约为10 μm的初始矿物样品放在两个金刚石压砧尖端的微小台面之间进行加压,激光可穿过金刚石压砧对样品进行双面加热[6]。在40年前首次报道了静高压实验达到了兆巴压力,这使得模拟地球超深部成为可能[7]。随着DAC和激光加热技术的发展,铁在内核条件下的结构得到了研究,在这一实验中,温度和压力分别达到了5700 K和377 GPa[8]。然而这些实验大多局限于单一的矿物相或简单的二元体系(如氧化镁-二氧化硅),想要解释深下地幔的复杂结构,如D′′层锋利的上边界[9]、地震各向异性[10],以及占据下地幔三分之一的剪切波低速带[11]等主要特征,我们需要在真实的下地幔多组分体系中开展高温高压岩石学实验,实验产物通常为多相混合物。
在多相混合物中,大多数衍射峰在粉晶X射线衍射(X-ray diffraction, XRD)图谱中重叠。即使没有重叠,单靠粉晶X射线衍射也不足以研究新的结构。单晶XRD 被认为是较为理想的结构分析方法,在运用DAC的高压实验研究中得到了广泛的发展[12–14]。然而,传统的单晶XRD实验要求单晶尺寸在5 μm左右,这样的单晶无法在相应的高温高压实验条件下、在真实的地幔组分中合成。相反,在与深部地幔相对应的相平衡实验中,总是得到多晶多相样品。本文将回顾用于高温高压下多相体系中的多晶XRD技术,包括:多相混合物中新相的原位表征、多晶样品中选定的单个晶粒的晶体结构测定以及通过二维扫描精确确定晶胞的晶格常数。2.高温高压实验岩石学面临的挑战
多相混合物中相的识别和结构分析一直是高压研究中的一个难题。Frost和Fei[15]指出,当合成压力低至22 GPa时,从回收样品的粉晶XRD图谱中很难识别出致密含水镁硅酸盐相D、F和G的差别。但是,如果这种多相混合物含有颗粒尺寸大于5 μm的单晶晶粒,并且其结构在常温常压条件下可以保存下来,我们则可以在回收样品中挑选出这些颗粒进行单晶研究。
然而在更高的压力下,样品体积会显著减小。在DAC中,当压力大于60 GPa时,样品腔的尺寸减小到了几十微米。此外,大多数在超高压下获得的结构不能在常压下保存下来,比如MgSiO3和(Mg,Fe)SiO3的后钙钛矿结构(post-perovskite, pPV)[16–18]。同时,多晶样品中晶粒尺寸也通常随压力增加而减小。在深下地幔的高温高压条件下,地幔组分中含水相的晶粒尺寸仅为100 nm左右[4]。在相同温度下,含水相D在68 GPa时晶粒尺寸约为2 μm,而在128 GPa时则减小至200 nm左右[4],这表明压力是晶粒尺寸变化的主要影响因素。其他因素也可能影响晶粒尺寸,例如,在较低的温度下生成的晶粒尺寸通常较小[19]。对微晶颗粒(<1 μm)进行回收并开展单晶X射线衍射,在实际操作中几乎是不可能的。综上所述,为了研究深下地幔温压条件下真实多相体系的相变和晶体结构,原位表征是必不可少的。
高温高压条件下大量新结构产生。在高温高压实验中,粉晶XRD图谱中经常会出现一些新的衍射峰,然而要找到能与之相匹配的结构并不容易。高温高压新结构有两种类型:一种是原子重新排列形成更致密的结构,如NaCl中的B1-B2结构转变;另一种则涉及压力导致的化学计量变化,如NaCl3和Na3Cl [20]。在不知道化学成分的情况下,高压相的原位结构测定非常具有挑战性。另外,在岩石学实验中,高温高压相变也伴随组分变化。例如,在一个使用自然条件下的MORB组分作为初始样品的高温高压实验中,在深下地幔温压条件下,该实验获得了一个由富镁pPv、PbO2型二氧化硅、钙钙钛矿和CaFe2O4型铝相组成的四相混合物。该四相混合物通过原位的粉晶XRD技术以及非原位的透射电镜(transmis-sion electron microscopy, TEM)被分辨出来,其中,后钙钛矿相在Na2O中富集,并且Fe3+在总体铁元素中的占比也较高[21]。现有的粉晶XRD技术不能在实际的深下地幔条件下求解pPv相的复杂结构,此外,在多相混合物的粉晶XRD图谱中,弱相衍射峰通常被强衍射峰或背底所掩盖,使得利用粉晶XRD技术对弱相进行识别极为困难。
总而言之,不论是单晶X射线衍射还是粉晶X射线衍射技术都不足以用于研究高温高压下的多相系统。研究深下地幔中发生的相变以及这些矿物相的具体结构需要发展新的方法。
3.原位多晶同步辐射X射线衍射
在激光加热DAC高温高压实验中,同步辐射X射线被认为是最理想的探测工具[22–24]。通常,高温处理会促进晶体生长,在高温高压实验中,我们获取斑点状的粉晶XRD图谱。图1所示为具有代表性的(Mg,Fe)SiO3 pPv的斑点状粉晶XRD图谱[25]。这种斑点图案是由相对小尺寸的X射线束(约6 μm×8 μm半高宽)照在经过
492Author name et al. / Engineering 2(2016) xxx–xxx
2400 K左右高温加热而导致晶粒迅速生长的多晶样品所
导致的。近年来随着高压同步辐射线站的技术发展,X
射线束尺寸已经缩小至2~3 μm [22],这将有助于降低衍
射斑点在XRD图谱中的重叠程度。
高压多晶XRD技术的发展使得同时确定几百个晶粒
各自的晶面取向成为可能[25,26]。一旦指标化完成,多
相混合物就可以看作是成千上万个单晶晶粒的聚合体。
处理这类数据集需要一种精确、高效的算法。我们发现
Fable程序中的Grain Spotter软件包[27,28]可直接应用于
通过旋转法所收集的DAC中多晶样品的高压X射线衍射
数据,同时分辨出成百上千个晶粒的晶面取向及其基本
晶体学信息分析[25,29,30]。在某些情况下,经验丰富
的晶体学家可以在高压旋转扫描数据集中手动确定几个晶粒,并解出其晶体结构[6,31]。然而,只有利用多晶XRD方法分析属于每个相的数十至数百个晶粒,才有可能系统地研究混合相中包括弱相在内的每个相的晶体结构。
图2为高压多晶XRD数据采集装置的示意图。与传统单晶晶体学中使用的“旋转法”类似,一组多晶衍射图谱是在DAC设计开口角度允许的范围内、样品围绕旋转中心的同时以一定角度为步长所收集的。综合考虑维持稳定的下地幔高压(高达136 GPa)并获得尽可能大的X射线入射角,我们选择了开口大小为50°~60°的DAC。为了提高XRD衍射图谱的信噪比,我们采用的最小角度步长仅为0.2°。在实验中,所使用的曝光时间为每帧1~10 s,并在每次收集之前对曝光时间进行测试,以使最强的衍射点强度接近饱和为标准。接下来,可以采用CrysAlis [32]、XDS [33]、GSE_ADA/RSV [34]等软件包来计算高压衍射数据的衍射强度,然后采用传统的单晶结构分析程序如SHELX [35]进行结构求解和精修。
合成高质量晶粒是应用高压多晶XRD技术的前提。研究发现,晶体在准静水压和稳定加热的高温高压条件下可以生长得更好[29]。在地幔岩石学实验中,高压相的结构通常能在温度淬火后保存下来,而不能在卸压之后保存下来,因此我们通常在加热之后、卸压之前采集多晶X射线衍射数据。
斑点状的衍射图谱使得多晶衍射分析方法成为可能,但这些斑点的存在使得粉晶XRD图谱中衍射峰的强度测量不可靠,从而导致对多相混合物中相比例的估计不准确。斑点状衍射图谱意味着样品中的某些晶粒生长很好,而与之相反,光滑的衍射圆环则意味着晶粒非常细小。在样品合成中,晶体生长所需的高温条件有利于热力学平衡。另一方面,从相变动力学的角度来考虑,在类似的温压条件下粗晶粒为起始样品的相变可能比细小晶粒样品慢得多,因为细晶粒样品中较大的表面积可以促进相变的成核。在激光加热DAC中开展高温高压实验时,我们经常可以观察到斑点状的XRD图谱,此外,高温高压相变中的动力学问题应得到更多的关注。4. 多晶XRD技术在高压实验中的应用
多晶XRD方法能够对DAC中多相样品的微小晶粒进行相鉴别和结构分析。本文总结了原位多晶XRD技术在以下三个方面的应用:未知相和弱相的相识别、高压
图1. 具有代表性的(Mg,Fe)SiO3 pPv的斑点状粉晶XRD图谱。该XRD图谱采集于120 GPa、2400 K淬火之后的样品中,旋转角ω固定(Reproduced from Ref. [25] with permission of PNAS, ? 2013)。图2. DAC中多晶XRD数据采集的实验装置示意图。样品放置在旋转
中心,以0.2°的步长收集一组2D XRD图谱,DAC开口角度一般为50°~60°,其中ω、η和θ分别代表旋转角、方位角和布拉格角。
493 Author name et al. / Engineering 2(2016) xxx–xxx
晶体结构的确定以及通过合并多个晶粒的衍射信息来确定其晶胞参数。
4.1. 多相混合物中的相识别
多晶XRD技术在从混合相中识别未知相上展示了其独特的优越性。当含铁布里奇曼石(bridgmanite, Bdg)分解为几乎不含铁的MgSiO3 Bdg和富铁的六方相(H相)时,H相中只有3个高于2.4 ?的峰是特定的,其他峰基本都与Bdg相衍射峰重叠[29]。在一套高压XRD旋转数据中,通过确定每个晶粒特定的晶面取向矩阵,找到了属于H相的154个晶粒。当晶粒的数十到数百个衍射斑点满足由其特定取向矩阵确定的严格几何角度时,晶粒的存在就可以被确定。每个衍射点由三个角度(ω, η, 2θ)来约束,其中,ω,η, θ分别代表旋转角、方位角以及布拉格角(图2)。此外,154个具有特定取向矩阵的晶粒重复地验证了同一晶格。
粉晶XRD图谱只包含晶面间距d的信息,有时仅对新相的几个主要衍射峰进行拟合会导出不正确的晶胞。以最近发现的(Fe,Al)OOH中六方含水相(hexagonal hy-drous phase, HH相)为例,采用多晶XRD对其进行分析,在110 GPa下得到了它的晶格常数:a = 10.5803(6) ?,c = 2.5897(3) ?[36]。然而,如果不选取粉晶XRD图谱中的弱峰(211)和(311),则会导出到一个较小的正交晶胞,晶格参数为a = 4.03(2) ?,b = 3.699(5) ?,c = 2.78(1) ?。这个晶格不能通过三维(three-dimensional, 3D)多晶XRD检测,因为根据该晶胞及其特征取向矩阵预测得到的多数衍射斑点没有出现在旋转衍射XRD图谱中。当输入六方相晶格参数时,其中符合某一个晶粒取向矩阵的衍射点就有104个,并且同时找到了27个取向矩阵不同的晶粒,它们重复验证了HH-phase的六方相晶胞。
多晶XRD在一个多相混合物中确定一个弱相展示了其独特优越性。在粉晶XRD图谱中,主相的衍射峰通常会遮掩大多数弱相的衍射峰。之前的实验发现在下地幔混合物中,赛石英(seifertite)作为一个弱相存在,可见的衍射峰里只有(110)与主相pPv的衍射峰没有重叠[30],如图3(a)所示。尽管如此,我们还是利用多晶XRD方法找到了100多个晶粒,但由于晶粒尺寸较小,多数晶粒的衍射信号较弱。另一方面,通过对比粉晶衍射谱中衍射峰的相对强度,可以粗略估计出弱相与主相的比例[图3(a)]。在多晶XRD数据里,有时只能确定弱相的少数几个晶粒。然而,属于弱相的微小颗粒仍然可以被识别并作为单晶处理,这在传统的XRD技术中是
不可能实现的[图3(b)]。高压多晶XRD的发展完成了以前不可能完成的任务,并且推动了探索地球深部的实验研究的发展。
4.2. 晶体结构测定
(Mg,Fe)SiO3-pPv相是下地幔底部的主导矿物,自2004年被发现以来一直是研究的热点[16–18]。pPv相的成分变化可引起其密度和结构的变化。因此,研究pPv相的化学组成及其结构变化对解释核幔边界(core-mantle boundary, CMB)附近观测到的地震和动力特征具有重要意义。例如,在MORB组分中合成的pPv相发现Na2O 富集并且铁含量也较高[21]。另一方面,pPv 相可能在
图3. 由主相pPv和弱相SiO2组成的混合相的XRD数据。(a)在129 GPa、温度淬火后采集的粉晶XRD图谱显示SiO2比例很低;(b)多晶XRD图谱,包括某个选定的赛石英晶粒中来自{2,2,1}晶面的两个弗里德对(Reproduced from Ref. [30] with permission of GeoScienceWorld, ? 2016)。
494Author name et al. / Engineering 2(2016) xxx–xxx
CMB与液态铁核接触时变得富铁[18]。利用非原位透射电镜(ex situ TEM)可以在回收样品中测定各个相的化学组分。然而现有的粉晶XRD方法以及理论计算并不能检测由pPv中的杂质成分所引起的结构变化,并且pPv 结构也不能在常压下保存下来,因此需要进行原位晶体结构测定。之前的研究在氖(Ne)气包围样品的准静水压条件下合成了高质量的(Mg,Fe)SiO3-pPv多晶样品(图1),并用多晶分析方法对所选的pPv单晶进行了原位晶体结构的测定[25],这种贫铁pPv的结构与理论预测的MgSiO3的结构几乎相同[16]。据我们所知,这是pPv 相单晶结构的首次实验测定,证明了在超高压下原位测定亚微米晶粒的晶体结构的可行性。该技术可用于研究高压矿物成分变化引起的结构变化。
DAC的开口角度有限,在多晶样品中,可以将多个取向不同的晶粒进行合并,以增加结构的完备性,有助于晶体结构的测定[30]。显然,将多个晶粒的反射条件结合在一起,可以更加明确高压相的空间群。每个选定晶粒的衍射强度由XDS软件计算,检查数据集之间的兼容性以及合并数据集则由XDS程序包中的XSCALE程序来完成[33]。例如,在这套赛石英在129 GPa的多晶数据中,来自6个晶粒的总共613个衍射点被组合在一起,使得这套数据的丰度达到6.6倍,完整度达到92%,获得d 值范围低至0.72 ?的高质量高压晶体结构数据,因此可以对赛石英在129 GPa时的结构进行高质量精修[30]。此外,CrysAlis和其他软件也可以用于这类数据的处理。高压多晶XRD原位晶体结构的测定开辟了兆巴压力晶体学的新领域,提供了传统XRD技术难以实现的晶体学解决方案[25,30]。
4.3. 多相混合物中晶胞参数的测定
在矿物学和岩石学研究中,确定多相混合物中各相的晶胞参数是一个共同的任务。为了获得高质量的样品以及可靠的压力测量,经常将传压介质和(或)绝热层、压标,有时还有吸收激光的物质,与样品一起装入直径只有几十微米的DAC样品腔中。在高温高压实验过程中或者温度淬火之后,这些物质的衍射峰通常在粉晶XRD 图谱上重叠,仅有少数几个衍射峰可以用于定压和测定样品的晶胞参数,因此存在很大的不确定性。幸运的是,应用多晶XRD技术,能通过属于单个晶粒的多个d 值导出样品的晶胞参数。多晶数据所具有的三维旋转和几何关系使来自相近d值的衍射峰得以分离。以赛石英为例,通过增加参与拟合的衍射峰数量,晶胞参数的不确定性能够大大降低[30]。因此,从多晶数据拟合得到的晶胞参数的不确定性主要取决于单色仪在0.1%以内的分辨率。
精确的晶胞参数可以用来评估矿物组分变化对矿物相的微妙影响,铁能进入包括硅酸盐Bdg、pPv和铁方镁石在内的所有下地幔主要相的晶体结构中[37,38]。多晶XRD方法曾用于计算在119 GPa下共存于(Mg,Fe)SiO3中的pPv和H相的晶胞参数[39]。晶胞参数的不确定性可以通过在精修过程中增加衍射峰的个数而减小。因为样品腔中传压介质Ne的存在使得样品腔中间部分的压力不变,因此精修过的晶格常数可以用来探究样品在激光加热区域铁组分随温度梯度的变化。在距离加热中心10 μm的地方,pPv的晶胞体积下降了0.16%,而H相的晶胞体积减少了0.54%,这表明两个相都在较热的区域更加富铁[39]。与驱动铁等重元素从热区向冷区转移的Soret效应相反,我们认为所观测到的铁分布是由温度影响元素分配的结果。因此,利用高压多晶XRD方法可以精确地计算出每个相的晶胞参数,从而根据晶胞参数对元素或相的分布进行二维扫描。
5. 原位XRD和非原位TEM技术的结合实例
在高温高压岩石学实验中,需要对回收的样品进行化学分析,并将原位XRD测定的样品结构变化与组分变化联系起来。利用聚焦离子束(focus ion beam, FIB)对DAC中高压下激光加热过后的样品回收后进行切割和打磨[40],就可以获取用于透射电镜中分析的样品薄片。电子衍射和能谱仪(energy dispersive spectrometer, EDS)化学分析与非原位TEM分析方法相结合可以对常温常压下的相进行验证。实验中应仔细检查原位多晶XRD与非原位TEM分析结果是否具有一致性。为了保证其一致性,我们总是从加热中心选取样品用于制备TEM薄片。同时,可以采用XRD进行二维扫描来记录高温高压条件下以及恢复到常温常压后样品中的相分布。值得注意的是,大多数高压结构在常温常压条件下不能保存下来,此外在制备TEM薄片样品时,回收的样品有时还可能受到污染。
在此,我们提供了一个实例来演示通过原位XRD 和非原位TEM的结合对多相混合物中的含水相进行识别。为了了解地球深部储水,确定真实的下地幔成分中的含水相是必不可少的。我们使用了一种含水约7%(质量分数)的60% MgSiO3-30% Al2O3-10% Fe2O3(摩尔分
495 Author name et al. / Engineering 2(2016) xxx–xxx
数)的胶体作为起始材料。如图4所示,主要相为pPv 和含水δ相,只有一个微弱的衍射峰符合立方黄铁矿结构FeOOH相(py相,pyrite-type phase)。通过多晶XRD 分析,我们找到42颗晶粒,观测到有13~18个衍射点符合Pa-3空间群,因此确定了py相的存在。图4(b)为FIB制备的回收样品薄截面的成分分布图像,显示有几个属于富铁相的颗粒。EDS分析确认了颗粒中的铁和氧元素,而EDS分析检测不了氢元素是否存在。图中颗粒大小从50 nm到200 nm不等。从二维元素分布可以看出,py相的体积占总体积的比例小于3%。在高温高压条件下,这些富铁颗粒的化学成分及其在多晶混合物中的体积比与原位XRD观测到的py相一致。
在本实验中,我们使用了比真实地幔成分更高的Al2O3含量来增强XRD图谱中δ相的衍射峰强度。在地幔混合物中,含挥发分矿物相一般作为弱相存在。无论如何,这个例子表明,高压多晶XRD技术能够通过结合原位相XRD和非原位化学分析,识别出混合物中体积比小于3%的含水相的单个细小晶粒。
6. 结语
本文对高压多晶XRD技术进行了综述,并给出其在深下地幔温压条件下多相体系研究中的成功应用实例。当样品在兆巴压力下合成时,多相混合物中的晶体尺寸
图4. 多相混合物中包括主要相pPv、含水δ相和次要相py相(FeOOH)。TEM测试结果(a、b)显示少量富铁晶粒,这与原位XRD(c)显示的少量py相的存在相一致。
496Author name et al. / Engineering 2(2016) xxx–xxx
小至100 nm,因此无法回收单个晶粒,需要对其进行原位表征。同时,衍射峰的重叠使得粉晶XRD方法不能很好地研究未知相和弱相,原位多晶XRD方法能依靠同步辐射X射线束、DAC旋转和快速算法来识别多相混合物中属于每个相的数十至数百个晶体。通过这种方法,可以在多相混合物中实现可靠的相识别和晶体结构测定。文中实例论证了多晶XRD技术的独特优越性:应用多晶XRD技术探测到含铁的布里奇曼石分解为富铁的H相以及不含铁的布里奇曼石,发现了HH相(Fe,Al)OOH,首次确定了赛石英(SiO2)和pPv (Mg,Fe)SiO3的晶体结构,在兆巴的压力下测量赛石英的晶胞参数并且精度达0.1%,还研究了和pPv共存的H相中铁含量随温度梯度的细微变化。在某些情况下,原位高压多晶XRD技术还可以与非原位TEM分析相结合,来探究结构转变和成分变化之间的关系,应用这一方法,在高温高压条件下的俯冲板模型组分中发现了py相FeOOH与pPv共存。通过这些有效的例证,我们阐明了研究多相体系的关键挑战,并展示了高压多相XRD方法在探索地球深部的重要作用。
致谢
作者感谢匿名评论者的建设性意见。本研究由国家自然科学基金(41574080和U1530402)资助。部分工作是在HPCAT(sector-16)、先进光子源(APS)、阿贡国家实验室进行的。HPCAT的运作得到了美国能源部(DOE)/国家核安全管理局(NNSA)实验科学办公室的支持。先进光子源是美国能源部科学用户办公室的设施,由美国阿贡国家实验室根据编号为DE-AC02-06CH11357的合同为美国能源部科学办公室运作。部分工作在上海同步辐射光源(SSRF)的15U1进行。Compliance with ethics guidelines
Li Zhang, Hongsheng Yuan, Yue Meng, and Ho-Kwang Mao declare that they have no conflict of interest or finan-cial con?icts to disclose. References
[1] Ricolleau A, Fei Y, Cottrell E, Watson H, Deng L, Zhang L, et al. Density profile of
pyrolite under the lower mantle conditions. Geophys Res Lett 2009;36(6):36.
[2] Irifune T, Shinmei T, McCammon CA, Miyajima N, Rubie DC, Frost DJ. Iron
partitioning and density changes of pyrolite in Earth’s lower mantle. Science 2010;327(5962):193–5.
[3] Hirose K, Fei Y, Ma Y, Mao HK. The fate of subducted basaltic crust in the
Earth’s lower mantle. Nature 1999;397(6714):53–6.
[4] Ohira I, Ohtani E, Sakai T, Miyahara M, Hirao N, Ohishi Y, et al. Stability of a
hydrous d-phase, AlOOH–MgSiO2(OH)2, and a mechanism for water transport into the base of lower mantle. Earth Planet Sci Lett 2014;401:12–7.
[5] Bertka CM, Fei Y. Mineralogy of the Martian interior up to core-mantle
boundary pressures. J Geophys Res Solid Earth 1997;102(B3):5251–64.
[6] Lavina B, Meng Y. Unraveling the complexity of iron oxides at high pressure
and temperature: Synthesis of Fe5O6. Sci Adv 2015;1(5):e1400260.
[7] Mao HK, Bell PM. High-pressure physics: sustained static generation of 1.36 to
1.72 megabars. Science 1978;200:1145–7.
[8] Tateno S, Hirose K, Ohishi Y, Tatsumi Y. The structure of iron in Earth’s inner
core. Science 2010;330(6002):359–61.
[9] Lay T. Sharpness of the D00 discontinuity beneath the Cocos Plate:
implications for the perovskite to post-perovskite phase transition. Geophys Res Lett 2008;35(3):35.
[10] Panning M, Romanowicz B. Inferences on flow at the base of Earth’s mantle
based on seismic anisotropy. Science 2004;303(5656):351–3.
[11] Su W, Woodward RL, Dziewonski AM. Degree 12 model of shear velocity
heterogeneity in the mantle. J Geophys Res 1994;99(B4):6945–80.
[12] Miletich R, Allan DR, Kuhs WF. High-pressure single-crystal techniques. Rev
Mineral Geochem 2000;41(1):445–519.
[13] Dera P, Zhuravlev K, Prakapenka V, Rivers ML, Finkelstein GJ, Grubor-Urosevic
O, et al. High pressure single-crystal micro X-ray diffraction analysis with GSE_ADA/RSV software. High Press Res 2013;33(3):466–84.
[14] Dubrovinsky L, Boffa-Ballaran T, Glazyrin K, Kurnosov A, Frost D, Merlini M, et
al. Single-crystal X-ray diffraction at megabar pressures and temperatures of thousands of degrees. High Press Res 2010;30(4):620–33.
[15] Frost DJ, Fei Y. Stability of phase D at high pressure and high temperature. J
Geophys Res Solid Earth 1998;103(B4):7463–74.
[16] Murakami M, Hirose K, Kawamura K, Sata N, Ohishi Y. Post-perovskite phase
transition in MgSiO3. Science 2004;304(5672):855–8.
[17] Oganov AR, Ono S. Theoretical and experimental evidence for a postperovskite
phase of MgSiO3 in Earth’s D0 0 layer. Nature 2004;430(6998):445–8. [18] Mao WL, Meng Y, Shen G, Prakapenka VB, Campbell AJ, Heinz DL, et al.
Ironrich silicates in the Earth’s D0 0 layer. Proc Natl Acad Sci USA 2005;102
(28):9751–3.
[19] Nishi M, Irifune T, Tsuchiya J, Tange Y, Nishihara Y, Fujino K, et al. Stability
of hydrous silicate at high pressures and water transport to the deep lower mantle. Nat Geosci 2014;7(3):224–7.
[20] Zhang W, Oganov AR, Goncharov AF, Zhu Q, Boulfelfel SE, Lyakhov AO, et al.
Unexpected stable stoichiometries of sodium chlorides. Science 2013;342 (6165):1502–5.
[21] Hirose K, Takafuji N, Sata N, Ohishi Y. Phase transition and density of
subducted MORB crust in the lower mantle. Earth Planet Sci Lett 2005;237(1–
2):239–51.
[22] Shen G, Mao HK. High-pressure studies with x-rays using diamond anvil cells,
reports on progress in physics. Physical Society 2017;80:016101.
[23] Duffy TS. Synchrotron facilities and the study of the Earth’s deep interior. Rep
Prog Phys 2005;68(8):1811–59.
[24] Mao HK, Chen B, Chen J, Li K, Lin JF, Yang W, et al. Recent advances in
highpressure science and technology. Matter Radiat Extremes 2016;1(1):59–
75.
[25] Zhang L, Meng Y, Dera P, Yang W, Mao WL, Mao HK. Single-crystal structure
determination of (Mg,Fe)SiO3 postperovskite. Proc Natl Acad Sci USA 2013;110
(16):6292–5.
[26] Nisr C, Ribárik G, Ungár T, Vaughan GBM, Cordier P, Merkel S. High resolution
three-dimensional X-ray diffraction study of dislocations in grains of MgGeO3 post-perovskite at 90 GPa. J Geophys Res 2012;117(B3):B03201. [27] Schmidt S. GrainSpotter: a fast and robust polycrystalline indexing algorithm.
J Appl Cryst 2014;47(1):276–84.
[28] S?rensen HO, Schmidt S, Wright JP, Vaughan GBM, Techert S, Garman EF, et al.
Multigrain crystallography. Z Kristallogr 2012;227(1):63–78.
[29] Zhang L, Meng Y, Yang W, Wang L, Mao WL, Zeng QS, et al. Disproportionation
of (Mg,Fe)SiO3 perovskite in Earth’s deep lower mantle. Science 2014;344 (6186):877–82.
[30] Zhang L, Popov D, Meng Y, Wang J, Ji C, Li B, et al. In-situ crystal structure
determination of seifertite SiO2 at 129 GPa: studying a minor phase near Earth’s core-mantle boundary. Am Mineral 2016;101(1):231–4.
[31] Merlini M, Hanfland M, Salamat A, Petitgirard S, Müller H. The crystal
structures of Mg2Fe2C4O13, with tetrahedrally coordinated carbon, and Fe13O19, synthesized at deep mantle conditions. Am Mineral 2015;100(8–9):2001–4.
[32] Oxford Diffraction Ltd. CrysAlis Red. Version p171.29.2 [software]; 2006.
[33] Kabsch W. XDS. Acta Crystallogr D Biol Crystallogr 2010;D66:125–32.
[34] Dera P. GSE-ADA data analysis program for monochromatic single crystal
diffraction with area detector. Argonne: GSECARS; 2007.
[35] Sheldrick GM. A short history of SHELX. Acta Crystallogr A 2008;A64:112–22.
[36] Zhang L, Yuan H, Meng Y, Mao HK. Discovery of a hexagonal ultradense
hydrous phase in (Fe,Al)OOH. Proc Natl Acad Sci USA 2018;115 (12):2908–11.
[37] Lundin S, Catalli K, Santillán J, Shim SH, Prakapenka VB, Kunz M, et al. Effect
of Fe on the equation of state of mantle silicate perovskite over 1 Mbar. Phys
497 Author name et al. / Engineering 2(2016) xxx–xxx
Earth Planet Inter 2008;168(1–2):97–102.
[38] Fei Y, Zhang L, Corgne A, Watson H, Ricolleau A, Meng Y, et al. Spin transition
and equations of state of (Mg,Fe)O solid solutions. Geophys Res Lett 2007;34
(17):L17307.
[39] Zhang L, Meng Y, Mao H. Unit cell determination of coexisting postperovskite
and H-phase in (Mg,Fe)SiO3 using multigrain XRD: compositional variation across a laser heating spot at 119 GPa. Prog Earth Planet Sci 2016;3(1):13. [40] Miyahara M, Sakai T, Ohtani E, Kobayashi Y, Kamada S, Kondo T, et al.
Application of FIB system to ultra-high-pressure Earth science. J Mineral Petrol Sci 2008;103(2):88–93.
2017X射线衍射及物相分析实验报告写法
请将以下内容手写或打印在中原工学院实验报告纸上。 实验报告内容:文中红体字部分请删除后补上自己写的内容班级学号姓名 综合实验X射线衍射仪的使用及物相分析 实验时间,地点 一、实验目的 1.了解x射线衍射仪的构造及使用方法; 2.熟悉x射线衍射仪对样品制备的要求; 3.学会对x射线衍射仪的衍射结果进行简单物相分析。 二、实验原理 (X射线衍射及物相分析原理分别见《材料现代分析方法》第一、二、三、五章。)三、实验设备 Ultima IV型变温全自动组合粉末多晶X射线衍射仪。 (以下为参考内容) X衍射仪由X射线发生器、测角仪、记录仪等几部分组成。
图1 热电子密封式X射线管的示意图 图1是目前常用的热电子密封式X射线管的示意图。阴极由钨丝绕成螺线形,工作时通电至白热状态。由于阴阳极间有几十千伏的电压,故热电子以高速撞击阳极靶面。为防止灯丝氧化并保证电子流稳定,管内抽成1.33×10⁻⁹~1.33×10⁻¹¹的高真空。为使电子束集中,在灯丝外设有聚焦罩。阳极靶由熔点高、导热性好的铜制成,靶面上被一层纯金属。常用的金属材料有Cr,Fe,Co,Ni,Cu,Mo,W等。当高速电子撞击阳极靶面时,便有部分动能转化为X射线,但其中约有99%将转变为热。为了保护阳极靶面,管子工作时需强制冷却。为了使用流水冷却和操作者的安全,应使X射线管的阳极接地,而阴极则由高压电缆加上负高压。x射线管有相当厚的金属管套,使X射线只能从窗口射出。窗口由吸收系数较低的Be片制成。结构分析用X射线管通常有四个对称的窗口,靶面上被电子袭击的范围称为焦点,它是发射X射线的源泉。用螺线形灯丝时,焦点的形状为长方形(面积常为1mm×10mm),此称为实际焦点。窗口位置的设计,使得射出的X射线与靶面成60角(图2),从长方形的短边上的窗口所看到的焦点为1mm2正方形,称点焦点,在长边方向看则得到线焦点。一般的照相多采用点焦点,而线焦点则多用在衍射仪上。 图2 在与靶面成60角的方向上接收X射线束的示意图 自动化衍射仪采用微计算机进行程序的自动控制。图3为日本生产的Ultima IV型变温全自动组合粉末多晶X射线衍射仪工作原理方框图。入射X射线经狭缝照射到多晶试样上,衍射线的单色化可借助于滤波片或单色器。衍射线被探测器所接收,电脉冲经放大后进人脉冲高度分析器。信号脉冲可送至计数率仪,并在记录仪上画出衍射图。脉冲亦可送至计数器(以往称为定标器),经徽处理机进行寻峰、计算峰积分强度或宽度、扣除背底等处理,并在屏幕上显示或通过打印机将所需的图形或数据输出。控制衍射仪的专用微机可通过带编码器的步进电机控制试样(θ)及探测器(2θ)进行连续扫描、阶梯扫描,连动或分别动作等等。目前,衍射仪都配备计算机数据处理系统,使衍射仪的功能进一步扩展,自动化水平更加提高。衍射仪目前已具有采集衍射资料,处理图形数据,查找管理文件以及自动进行物相定性分析等功能。 物相定性分析是X射线衍射分析中最常用的一项测试,衍射仪可自动完成这一过程。首先,仪器按所给定的条件进行衍射数据自动采集,接着进行寻峰处理并自动启动程序。
X射线衍射分析法原理概述
第十四章 X射线衍射分析法 14.1概述 X射线衍射法是一种研究晶体结构的分析方法,而不是直接研究试样内含有元素的种类及含量的方法。当X射线照射晶态结构时,将受到晶体点阵排列的不同原子或分子所衍射。X射线照射两个晶面距为d的晶面时,受到晶面的反射,两束反射X光程差2dsinθ是入射波长的整数倍时,即 2dsinθ=nλ (n为整数) 两束光的相位一致,发生相长干涉,这种干涉现象称为衍射,晶体对X 射线的这种折射规则称为布拉格规则。θ称为衍射角(入射或衍射X射线与晶面间夹角)。n相当于相干波之间的位相差,n=1,2…时各称0级、1级、2级……衍射线。反射级次不清楚时,均以n=1求d。晶面间距一般为物质的特有参数,对一个物质若能测定数个d及与其相对应的衍射线的相对强度,则能对物质进行鉴定。 X射线衍射分析方法在材料分析与研究工作中具有广泛的用途。在此主要介绍其在物相分析等方面的应用。 14.1.1 物相定性分析 1.基本原理 组成物质的各种相都具有各自特定的晶体结构(点阵类型、晶胞形状与大小及各自的结构基元等),因而具有各自的X射线衍射花样特征(衍射线位置与强度)。对于多相物质,其衍射花样则由其各组成相的衍射花样简单叠加而成。由此可知,物质的X射线衍射花样特征就是分析物质相组成的“指纹脚印”。制备各种标准单相物质的衍射花样并使之规范化(1969年成立了国际性组织“粉末衍射标准联合会(JCPDS)”,由它负责编辑出版“粉末衍射卡片”,称PDF卡片),将待分析物质(样品)的衍射花样与之对照,从而确定物质的组成相,这就是物相定性分析的基本原理与方法。 2.物相定性分析的基本步骤 (1) 制备待分析物质样品,用衍射仪获得样品衍射花样。 (2) 确定各衍射线条d值及相对强度I/I1值(Il为最强线强度)。 (3) 检索PDF卡片。 PDF卡片检索有三种方式: 1)检索纸纸卡片 物相均为未知时,使用数值索引。将各线条d值按强度递减顺序排列;按三强线条d1、d2、d3的d—I/I1数据查数值索引;查到吻合的条目后,核对八强线的d—I/I1值;当八强线基本符合时,则按卡片编号取出PDF卡片。若按d1、d2、d3顺序查找不到相应条目,则可将d1、d2、d3按不同顺序排列查找。查找索引时,d值可有一定误差范围:一般允许
X射线衍射仪的原理
X射线是利用衍射原理,精确测定物质的晶体结构,织构及应力,精确的进行物相分析,定性分析,定量分析.广泛应用于冶金,石油,化工,科研,航空航天,教学,材料生产等领域. X射线是一种波长很短(约为20~0.06┱)的电磁波,能穿透一定厚度的物质,并能使荧光物质发光、照相乳胶感光、气体电离。在用电子束轰击金属“靶”产生的X射线中,包含与靶中各种元素对应的具有特定波长的X射线,称为特征(或标识)X射线。考虑到X 射线的波长和晶体内部原子间的距离(10-8cm)相近,1912年德国物理学家劳厄(M.von Laue)提出一个重要的科学预见:晶体可以作为X射线的空间衍射光栅,即当一束 X射线通过晶体
时将发生衍射,衍射波叠加的结果使射线的强度在某些方向上加强,在其他方向上减弱。分析在照相底片上得到的衍射花样,便可确定晶体结构。这一预见随即为实验所验证。1913年英国物理学家布喇格父子(W.H.Bragg,W.L.Bragg)在劳厄发现的基础上,不仅成功地测定了NaCl、KCl等的晶体结构,并提出了作为晶体衍射基础的著名公式──布喇格定律: 2d sinθ=nλ 式中λ为X射线的波长,n为任何正整数。 当X射线以掠角θ(入射角的余角)入射到某一点阵平面间距为d的原子面上时(图1),在符合上式的条件下,将在反射方向上得到因叠加而加强的衍射线。布喇格定律简洁直观地表达了衍射所必须满足的条件。当 X射线波长λ已知时(选用固定波长的特征X射线),采用细粉末或细粒多晶体的线状样品,可从一堆任意取向的晶体中,从每一θ角符合布喇格条件的反射面得到反射,测出θ后,利用布喇格公式即可确定点阵平面间距、晶胞大小和类型;根据衍射线的强度,还可进一步确定晶胞内原子的排布。这便是X射线结构分析中的粉末法或德拜-谢乐(Debye—Scherrer)法(图2a)的理论基础。而在测定单晶取向的劳厄法中(图2b)所用单晶样品保持固定不变动(即θ不变),以辐射束的波长作为变量来保证晶体中一切晶面都满足布喇格条件,故选用连续X射线束。如果利用结构已知的晶体,则在测定出衍射线的方向θ后,便可计算X射线的波长,从而判定产生特征X射线的元素。这便是X射线谱术,可用于分析金属和合金的成分。
x光衍射实验报告doc
x光衍射实验报告 篇一:X射线衍射实验方法和数据分析 X射线衍射实验报告 摘要: 本实验通过了解到X射线的产生、特点和应用;理解X 射线管产生连续X射线谱和特征X射线谱的基本原理,了解D8xX射线衍射仪的基本原理和使用方法,通过分析软件对测量样品进行定性的物相分析。 关键字:布拉格公式晶体结构,X射线衍射仪,物相分析 引言: X射线最早由德国科学家W.C. Roentgen在1895年在研究阴极射线发现,具有很强的穿透性,又因x射线是不带电的粒子流,所以在电磁场中不偏转。1912年劳厄等人发现了X射线在晶体中的衍射现象,证实了X射线本质上是一种波长很短的电磁辐射,其波长约为10nm到10–2nm之间,与晶体中原子间的距离为同一数量级,是研究晶体结构的有力工具。物相分析中的衍射方法包括X射线衍射,电子衍射和中子衍射三种,其中X射线衍射方法使用最广,它包括德拜照相法,聚集照相法,和衍射仪法。 实验目的:1. 了解X射线衍射仪的结构及工作原理 2. 熟悉X射线衍射仪的操作
3. 掌握运用X射线衍射分析软件进行物相分析的方法 实验原理: (1) X射线的产生和X射线的光谱 实验中通常使用X光管来产生X射线。在抽成真空的X 光管内,当由热阴极发出的电子经高压电场加速后,高速运动的电子轰击由金属做成的阳极靶时,靶就发射X射线。发射出的X射线分为两类:(1)如果被靶阻挡的电子的能量不越过一定限度时,发射的是连续光谱的辐射。这种辐射叫做轫致辐射;(2)当电子的能量超过一定的限度时,可以发射一种不连续的、只有几条特殊的谱线组成的线状光谱,这种发射线状光谱的辐射叫做特征辐射。 对于特征X光谱分为 (1)K系谱线:外层电子填K层空穴产生的特征X射线Kα、Kβ… (2)L系谱线:外层电子填L层空穴产生的特征X射线Lα、Lβ…如下图1图1 特征X射线 X射线与物质的作用 X射线与物质相互作用产生各种复杂过程。就其能量转换而言,一束X射线通过物质分为三部分:散射,吸收,透过物质沿原来的方向传播,如下图2,其中相干散射是产生衍射花样原因。 图2X射线与物质的作用
晶体X射线衍射实验报告全解
晶体X射线衍射实验报告全解
中南大学 X射线衍射实验报告 材料科学与工程学院材料学专业1305班班级 姓名学号0603130500 同组者无 黄继武实验日期2015 年12 月05 日指导教 师 评分分评阅人评阅日 期 一、实验目的 1)掌握X射线衍射仪的工作原理、操作方法; 2)掌握X射线衍射实验的样品制备方法; 3)学会X射线衍射实验方法、实验参数设置,独立完成一个衍射实验测试; 4)学会MDI Jade 6的基本操作方法; 5)学会物相定性分析的原理和利用Jade进行物相鉴定的方法; 6)学会物相定量分析的原理和利用Jade进行物相定量的方法。 本实验由衍射仪操作、物相定性分析、物相定量分析三个独立的实验组成,实验报告包含以上三个实验内容。 二、实验原理
1 衍射仪的工作原理 特征X射线是一种波长很短(约为20~0.06nm)的电磁波,能穿透一定厚度的物质,并能使荧光物质发光、照相乳胶感光、气体电离。在用电子束轰击金属“靶”产生的X射线中,包含与靶中各种元素对应的具有特定波长的X射线,称为特征(或标识)X射线。考虑到X射线的波长和晶体内部原子间的距离相近,1912年德国物理学家劳厄(M.von Laue)提出一个重要的科学预见:晶体可以作为X射线的空间衍射光,即当一束X射线通过晶体时将发生衍射,衍射波叠加的结果使射线的强度在某些方向上加强,在其他方向上减弱。分析在照相底片上得到的衍射花样,便可确定晶体结构。这一预见随即为实验所验证。1913年英国物理学家布拉格父子(W. H. Bragg, W. L Bragg)在劳厄发现的基础上,不仅成功地测定了NaCl、KCl等的晶体结构,并提出了作为晶体衍射基础的著名公式──布拉格定律: 2dsinθ=nλ 式中λ为X射线的波长,n为任何正整数。当X射线以掠角θ(入射角的余角,又称为布拉格角)入射到某一点阵晶格间距为d的晶面面上时,在符合上式的条件下,将在反射方向上得到因叠加而加强的衍射线。 2 物相定性分析原理 1) 每一物相具有其特有的特征衍射谱,没有任何两种物相的衍射谱是完全相同 的 2) 记录已知物相的衍射谱,并保存为PDF文件 3) 从PDF文件中检索出与样品衍射谱完全相同的物相 4) 多相样品的衍射谱是其中各相的衍射谱的简单叠加,互不干扰,检索程序能 从PDF文件中检索出全部物相 3 物相定量分析原理 X射线定量相分析的理论基础是物质参与衍射的体积活重量与其所产生的衍射强度成正比。 当不存在消光及微吸收时,均匀、无织构、无限厚、晶粒足够小的单相时,多晶物质所产生的均匀衍射环上单位长度的积分强度为: 式中R为衍射仪圆半径,V o为单胞体积,F为结构因子,P为多重性因子,M为温度因子,μ为线吸收系数。 三、仪器与材料 1)仪器:18KW转靶X射线衍射仪 2)数据处理软件:数据采集与处理终端与数据分析软件MDI Jade 6 3)实验材料:CaCO3+CaSO4、Fe2O3+Fe3O4
x射线衍射仪原理
x射线衍射仪原理及应用 课程名称材料分析测试技术 系别金属材料工程系 专业金属材料工程 班级材料**** 姓名______ * *_ 学号******** 化学工程与现代材料学院制
x射线衍射仪原理及应用 基本原理: x射线的波长和晶体内部原子面之间的间距相近,晶体可以作为X射线的空间衍射光栅,即一束X射线照射到物体上时,受到物体中原子的散射,每个原子都产生散射波,这些波互相干涉,结果就产生衍射。衍射波叠加的结果使射线的强度在某些方向上加强,在其他方向上减弱。分析衍射结果,便可获得晶体结构。以上是1912年德国物理学家劳厄提出的一个重要科学预见,随即被实验所证实。1913年,英国物理学家布拉格父子,在劳厄发现的基础上,不仅成功的测定了NaCl,KCl等晶体结构,还提出了作为晶体衍射基础的著名公式——布拉格方程:2dsinθ=nλ。 基本特征: X射线及其衍射X射线是一种波长(0.06-20nm)很短的电磁波,能穿透一定厚度的物质,并能使荧光物质发光、照相机乳胶感光、气体电离。用高能电子束轰击金属靶产生X射线,它具有靶中元素相对应的特定波长,称为特征X射线。如铜靶对应的X射线波长为0.154056 nm。对于晶体材料,当待测晶体与入射束呈不同角度时,那些满足布拉格衍射的晶面就会被检测出来,体现在XRD图谱上就是具有不同的衍射强度的衍射峰。对于非晶体材料,由于其结构不存在晶体结构中原子排列的长程有序,只是在几个原子范围内存在着短程有序,故非晶体材料的XRD图谱为一些漫散射馒头峰 基本构成: 1,高稳定度X射线源提供测量所需的X射线, 改变X射线管阳极靶材质可改变X射线的波长, 调节阳极电压可控制X射线源的强度。
x射线衍射实验
X-射线衍射法进行物相分析 一. 实验题目 X射线衍射物相定性分析 二. 实验目的及要求 学习了解X射线衍射仪的结构和工作原理;掌握X射线衍射物相定性分析的方法和步骤;给定实验样品,设计实验方案,做出正确分析鉴定结果。 三. 实验原理 根据晶体对X射线的衍射特征-衍射线的位置、强度及数量来鉴定结晶物质之物相的方法,就是X 射线物相分析法。 每一种结晶物质都有各自独特的化学组成和晶体结构。没有任何两种物质,它们的晶胞大小、质点种类及其在晶胞中的排列方式是完全一致的。因此,当X射线被晶体衍射时,每一种结晶物质都有自己独特的衍射花样,它们的特征可以用各个衍射晶面间距d和衍射线的相对强度I/I0来表征。其中晶面间距d与晶胞的形状和大小有关,相对强度则与质点的种类及其在晶胞中的位置有关。所以任何一种结晶物质的衍射数据d和I/I0是其晶体结构的必然反映,因而可以根据它们来鉴别结晶物质的 物相。 四. 实验仪器 图一X射线衍射仪 页脚内容1
本实验使用的仪器是Y-2000射线衍射仪( 丹东制造)。X射线衍射仪主要由X射线发生器(X射线管)、测角仪、X射线探测器、计算机控制处理系统等组成。衍射仪如图一所示。 1.X射线管 X射线管主要分密闭式和可拆卸式两种。广泛使用的是密闭式,由阴极灯丝、阳极、聚焦罩等组成,功率大部分在1~2千瓦。可拆卸式X射线管又称旋转阳极靶,其功率比密闭式大许多倍,一般为12~60千瓦。常用的X射线靶材有W、Ag、Mo、Ni、Co、Fe、Cr、Cu等。X射线管线焦点为1×10平方毫米,取出角为3~6度。 选择阳极靶的基本要求:尽可能避免靶材产生的特征X射线激发样品的荧光辐射,以降低衍射花样的背底,使图样清晰。 测角仪是粉末X射线衍射仪的核心部件,主要由索拉光阑、发散狭缝、接收狭缝、防散射狭缝、样品座及闪烁探测器等组成。 (1)衍射仪一般利用线焦点作为X射线源S。如果采用焦斑尺寸为1×10平方毫米的常规X射线管,出射角6°时,实际有效焦宽为0.1毫米,成为0.1×10平方毫米的线状X射线源。 (2)从S发射的X射线,其水平方向的发散角被第一个狭缝限制之后,照射试样。这个狭缝称为发散狭缝(DS),生产厂供给1/6°、1/2°、1°、2°、4°的发散狭缝和测角仪调整用0.05毫米宽的狭缝。 (3)从试样上衍射的X射线束,在F处聚焦,放在这个位置的第二个狭缝,称为接收狭缝(RS).生产厂供给0.15毫米、0.3毫米、0.6毫米宽的接收狭缝。 (4)第三个狭缝是防止空气散射等非试样散射X射线进入计数管,称为防散射狭缝(SS)。SS和DS 配对,生产厂供给与发散狭缝的发射角相同的防散射狭缝。 页脚内容2
X射线衍射仪工作原理
X射线衍射仪工作原理-标准化文件发布号:(9556-EUATWK-MWUB-WUNN-INNUL-DDQTY-KII
一 X射线衍射仪工作原理 X射线是利用衍射原理,精确测定物质的晶体结构,织构及应力。对物质进行物相分析、定性分析、定量分析。广泛应用于冶金、石油、化工、科研、航空航天、教学、材料生产等领域。 特征X射线是一种波长很短(约为20~0.06nm)的电磁波,能穿透一定厚度的物质,并能使荧光物质发光、照相乳胶感光、气体电离。在用电子束轰击金属“靶”产生的X射线中,包含与靶中各种元素对应的具有特定波长的X射线,称为特征(或标识)X射线。考虑到X射线的波长和晶体内部原子间的距离相近,1912年德国物理学家劳厄(M.von Laue)提出一个重要的科学预见:晶体可以作为X射线的空间衍射光,即当一束X射线通过晶体时将发生衍射,衍射波叠加的结果使射线的强度在某些方向上加强,在其他方向上减弱。分析在照相底片上得到的衍射花样,便可确定晶体结构。这一预见随即为实验所验证。1913年英国物理学家布拉格父子(W. H. Bragg, W. .L Bragg)在劳厄发现的基础上,不仅成功地测定了NaCl、KCl等的晶体结构,并提出了作为晶体衍射基础的著名公式──布拉格定律: θn λ 2, sin d= 式中λ为X射线的波长,n为任何正整数。当X射线以掠角θ(入射角的余角,又称为布拉格角)入射到某一点阵晶格间距为d的晶面面上时,在符合上式的条件下,将在反射方向上得到因叠加而加强的衍射线。 二,X射线衍射的应用 1、当X射线波长λ已知时(选用固定波长的特征X射线),采用细粉末或细粒多晶体的线状样品,可从一堆任意取向的晶体中,从每一θ角符合布拉格条件的反射面得到反射。测出θ后,利用布拉格公式即可确定点阵平面间距d、晶胞大小和晶胞类型; 2、利用X射线结构分析中的粉末法或德拜-谢乐(Debye—Scherrer)法的理论基础,测定衍射线的强度,就可进一步确定晶胞内原子的排布。 3、而在测定单晶取向的劳厄法中所用单晶样品保持固定不变动(即θ不变),以辐射线束的波长λ作为变量来保证晶体中一切晶面都满足布拉格条件,故选用连续X射线束。再把结构已知晶体(称为分析晶体)用来作测定,则在获得其衍射线方向θ后,便可计算X射线的波长λ,从而判定产生特征X射线的元素。这便是X射线谱术,可用于分析金属和合金的成分 4、X射线衍射在金属学中的应用: X射线衍射现象发现后,很快被用于研究金属和合金的晶体结构,已经成为研究晶体物质和某些非晶态物质微观结构的有效方法。 (1)物相分析是X射线衍射在金属中用得最多的方面,又分为定性分析和定量分析。定性分析是把对待测材料测得的点阵平面间距及衍射强度与标准物相的衍射数据进行比较,以确定材料中存在的物相;定量分析则根据衍射花样的强度,确定待测材料中各相的比例含量。 (2)精密测定点阵参数常用于相图的固态溶解度曲线的绘制。溶解度的变化往往引起点阵常数的变化;当达到溶解限后,溶质的继续增加引起新相的析出,不再引起点阵常数的变化。这个转折点即为溶解限。另外点阵常数的精密测定可获得单位晶胞原子数,从而可确定固溶体类型;还可以计算出密度、膨胀系数等有用的物理常数。
X射线衍射分析原理及其应用
X射线衍射分析原理及其应用 X射线及XRD 1.1 X射线 是由高能电子的减速运动或原子内层轨道电子的跃迁产生的短波电磁辐射。X射线的波长在10-6 ~10nm,在X射线光谱法中常用波长在0.01~2.5nm范围内。 1.2 X射线的产生途径有四种 1)高能电子束轰击金属靶即在一个X射线管中,固体阴极被加热产生大量电子,这些电子在高达100KV的电压下被加速,向金属阳极轰击,在碰撞过程中,电子束的一部分能量转化为X射线; 2)将物质用初级X射线照射以产生二级射线—X射线荧光; 3)利用放射性同位素衰败过程产生的发射,人工放射性同位素为为某些分析应用提供了非常方便的单能量辐射源; 4)从同步加速器辐射源获得。 1.3 X射线的吸收 当一束X射线穿过有一定厚度的物质时,其光强和能量会因吸收和散射而显著减小。物质的原子序数越大,它对X射线的阻挡能力越大,X射线波长越长,即能量越低,越容易被吸收[1] 。 1.4 XRD X射线衍射分析(XRD)是利用晶体形成的X射线衍射,对物质进行内部原子在空间分布状况的结构分析方法。将具有一定波长的X射线照射到结晶性物质上时,X射线因在结晶内遇到规则排列的原子或离子而发生散射,散射的X射线在
某些方向上相位得到加强,从而显示与结晶结构相对应的特有的衍射现象。X射线衍射法是目前测定晶体结构的重要手段,应用极其广泛。在实际的应用中将该分析方法分3为多晶粉末法和单晶衍射法。多晶粉末法常用来测定立方晶系的晶体结构点阵形式、晶胞参数及简单结构的原子坐标,还可以对固体式样进行物相分析等。 衍射X射线满足布拉格(W.L.Bragg)方程:2dsinθ=nλ式中:λ是X射线的长;θ是衍射角;d是结晶面间隔;n是整数。X射线束入射到样品表面后产生衍射,检测器收集衍射X射线信息。当入射波长λ、样品与X射线束夹角θ及样品晶面间距d满足布拉格公式时,检测器可以检测到最强的信息。因此采集入射和衍射X射线的角度信息及强度分布,可以获得晶面点阵类型、点阵常数、晶体取向、缺陷和应力等一系列有关材料结构信息[2],确定点阵参数的主要方法是多晶X射线衍射法[3]。 二、X射线衍射仪的结构 分析物质X射线衍射的仪器,形式多种多样,用途各异,但仪器构成皆如下图所示,其硬件主要有X射线光源、衍射信号检测系统及数据处理和打印图谱系统等几部分构成。 图1.X射线衍射仪
X射线衍射实验
X 射线布拉格衍射实验 一、 实验目的 1) 观察用X 射线对NaCl 单晶的Bragg 衍射。 2) 确定X 射线αK 和βK 线的波长。 3) 验证Bragg 衍射定律 4) 明确X 射线的波长的性质。 二、 实验装置 德国莱宝教具公司生产的X 射线装置是用微处理器控制的可进行多种实验的小型X 射线装置。该装置的高压系统、X 光管和实验区域被完全密封起来,正面装有两扇铅玻璃门,当它们其中任意一扇被打开时会自动切断高压,具有较大的安全性。其测量结果通过计算机实时采集和处理,使用极其方便。 本实验所用装置为554 81X-RAY APPARATUS 。 在X 射线装置中,左侧上方是控制面板,其下方是连接面板。中间是X 光管室,装有Mo (钼)阳极的X 光管,其高度可通过底部的调解螺杆进行调整。右面是实验区域,如图1所示,其中左边装有准直器和锆滤片;中间是靶台,NaCl 和LiF 单晶就安装在靶台上;右边 是测角器,松开锁定杆可调整测角器的位 图1 实验区域图 置,端窗型G-M 计数管也安装在测角器上。X 射线装置的左侧面是主电源开关,右侧面有一圆形的荧光屏,它是一种表面涂有荧光物质的铅玻璃平板,用于在“透照法”实验中观察X 光线,平时用盖板罩起来以避免损坏荧光物质。其下方是空通道,它构成实验区域内外沟通的渠道,被设计成迷宫,以不使X 射线外泄。装置的底部有四个脚,上方有两个提手柄。 如图2,是控制面板的示意图。
b5 图 2 控制面板 其中b1是显示位置,其顶部显示当前计数率,底部显示所用键的设置参数。在“耦合”模式下,靶的角度位置显示在显示区域的底部而顶部则显示传感器的计数率与角度位置。b2是调节旋钮,所有的参数设置均通过它来调节。b3是参数选择区域,它们是:U (管电压)、I (管电流)、△t (测量时间)、△β(测角器转动的角 步幅)、β(测角器的转动范围,即上限角和下限角)。b4扫描模式区域,共有SENSOR (传感器)、TARGET (靶)和COUPLED (耦合,即传感器和靶以2:1的方式运动)三种模式,ZERO 按钮用于复位到系统的零位置。b5是操作键区域,主要有:RESET (复位到系统的缺省值)、REPLAY (将最后的测量数据传送至XY 记录仪或PC 机)、SCAN ON/OFF (开启/关闭自动扫描)、 (开启声音脉冲)、HV ON/OFF (开启/关闭高压),当开启高压时,其上方的指示灯将发出闪烁的红光,表示正在发射X 射线。 三、 实验原理 1) X 射线的产生和性质 X射线的产生一般利用高速电子和物质原子的碰撞实现。常见的X射线管是一个真空二极管,管内阴极是炽热的钨丝,可发射电子,阳极是表面嵌有靶材料的钼块。两极加上几十千伏的高压,由此产生很强的电场使电子到达阳极时获得高速。高速运动的电子打在阳极靶面上,它的动能一部分转化为X射线的能量,其余大部分变为热能使阳极温度迅速升高,工作时需要对阳极散热。 从X射线管发出的X射线可以分为两部分:一是具有连续波长的X射线,构成连续x射线谱;另一部分是具有特定波长的标识谱,又名特征谱,它叠加在连续谱上成为几个尖锐的峰,如图3所示。 产生连续谱和标识谱的机理不同: 连续谱:高速电子到达阳极表面时,电子的运动 突然受阻,根据电磁场理论,这种电子产生韧制辐射, 图3 X 射线光谱图
X射线多晶衍射实验报告
X 射线多晶衍射实验报告 摘要: 本实验主要利用X 射线粉末干涉仪分别测定四种样品A 、B 、C 、D 的衍射图谱,对样品进行了物相分析。通过X 射线粉末衍射分析得到样品A 为的组分为2TiO 晶体;样品B 为ZnO 晶体,且样品B 的晶粒大小为:244.680 A ±0.33600 A ;样品C 为2TiO 和ZnO 的混合物,且2TiO 与ZnO 的质量比例为1:1;样品D 同样是2TiO 和ZnO 的混合物,质量比例为50:11. 关键词: X 射线粉末衍射;物相分析;衍射图谱 引言: X 射线是一种波长很短的电磁波,能穿透一定厚度的物质,并能使荧光物质发光、照相乳胶感光、气体电离。1912年德国物理学家劳厄提出一个重要的科学预见:晶体可以作为X 射线的空间衍射光栅,即当一束 X 射线通过晶体时将发生衍射,衍射波叠加的结果使射线的强度在某些方向上加强,在其他方向上减弱。分析在照相底片上得到的衍射花样,便可确定晶体结构。 获得多晶衍射图的方法有两种:德拜照相法和衍射仪法。20世纪50年代初X 射线粉末衍射仪开始代替德拜照相法记录粉末衍射数据,而德拜照相法逐渐被淘汰,因为x 射线粉末衍射仪法在材料物相的定性、定量测量方面有明显的有优势。 本实验主要通过对X 射线粉末衍射仪的了解与运用,从而进一步熟悉定性物相分析和PDF 数据库的使用方法,了解定性物相分析、精确测定晶格常数以及晶粒大小测量等实验方法。 实验原理: 1、X 射线发生器 X 射线发生器主要是由X 射线管、高压发生器、管压管流稳定电路和各种保护电路组成。实验中的X 射线管主要是利用真空管。在高真空的玻璃管里,被加热的阴极所发射的热电子,经阴极和阳极间的高电压加速后,高速撞击到阳极上,阳极为产生X 射线的靶源。电子与靶物质发生碰撞而迅速减速,发生多次碰撞,逐次丧失能量,直至完全耗尽为止。在碰撞过程中会产生具有确定最短波长的X 射线连续谱,辐射出特定波长的光子,即标识X 射线。
X射线衍射试验指导书
实验指导书 实验一“衍射仪的结构、原理及物相分析” 一.实验目的及要求 学习了解X射线衍射仪的结构和工作原理;掌握X射线衍射物相定性分析的方法和步骤。 二.实验原理 根据晶体对X射线的衍射特征-衍射线的位置、强度及数量来鉴定结晶物质之物相的方法,就是X射线物相分析法。每一种结晶物质都有各自独特的化学组成和晶体结构。没有任何两种物质,它们的晶胞大小、质点种类及其在晶胞中的排列方式是完全一致的。因此,当X射线被晶体衍射时,每一种结晶物质都有自己独特的衍射花样,它们的特征可以用各个衍射晶面间距d和衍射线的相对强度I/I1来表征。其中晶面间距d与晶胞的形状和大小有关,相对强度则与质点的种类及其在晶胞中的位置有关。所以任何一种结晶物质的衍射数据d和I/I1是其晶体结构的必然反映,因而可以根据它们来鉴别结晶物质的物相。 三.实验仪器 本实验使用的仪器是D/max 2500 X射线衍射仪(日本理学)。X射线衍射仪主要由X射线发生器(X射线管)、测角仪、X射线探测器、计算机控制处理系统等组成。图1是D/max 2500 X射线衍射仪。 图1 Rigaku D/max2500
1.X射线管 衍射用X射线管实际都属于热电子二极管,有密闭式和转靶式两种。广泛使用的是密闭式,由阴极灯丝、阳极、聚焦罩等组成,功率大部分在1~2.5千瓦,转靶式一般在10千瓦以上,其特点是阳极以极快的速度转动,使电子轰击面不断改变,即不断改变发热点,从而达到提高功率的目的。本实验中使用的日本理学D/max 2500X射线衍射仪采用旋转靶,最高功率高达18kw。图2是X射线管结构示意图。阴极由钨丝绕成螺线形,工作时通电至白热状态。由于阴阳极间有几十千伏的电压,故热电子以高速撞击阳极靶面。为防止灯丝氧化并保证电子流稳定,转靶X射线管采用机械泵+分子泵二级真空泵系统保持管内真空度。为使电子束集中,在灯丝外设有聚焦罩。阳极靶由熔点高、导热性好的铜制成,靶面上镀一层纯金属。常用的金属材料有Cr,Fe,Co,Ni,Cu,Mo,W等,本实验中靶材料为Cu。当高速电子撞击阳极靶面时,便有部分动能转化为X射线,但其中约有99%将转变为热。为了保护阳极靶面,管子工作时需强制冷却。为了使用流水冷却,也为了操作者的安全,应使X射线管的阳极接地,而阴极则由高压电缆加上负高压。X射线管有相当厚的金属管套,使X射线只能从窗口射出。窗口由吸收系数较低的Be片制成。 图2 X射线管示意图 选择阳极靶的基本要求:尽可能避免靶材产生的特征X射线激发样品的荧光辐射,以降低衍射花样的背底,使图样清晰。 2. 测角仪 测角仪是粉末X射线衍射仪的核心部件,实现对衍射角的测量。本实验中测角仪
实验一-X射线衍射技术及物相分析
实验一 X射线衍射技术及物相分析 一、实验目的与要求 1.学习了解X射线衍射仪的结构和工作原理; 2.掌握X射线衍射物相定性分析的方法和步骤; 3.给定实验样品,设计实验方案,做出正确分析鉴定结果。 二、实验仪器 本实验使用的仪器是Rigaku UltimaⅣX射线衍射仪。主要由冷却循环水系统、X射线衍射仪和计算机控制处理系统三部分组成。X射线衍射仪主要由X射线发生器即X射线管、测角仪、X射线探测器等构成。 1.X射线管 X射线管主要分密闭式和可拆卸式两种。广泛使用的是密闭式,由阴极灯丝、阳极、聚焦罩等组成,功率大部分在1~2千瓦。可拆卸式X射线管又称旋转阳极靶,其功率比密闭式大许多倍,一般为12~60千瓦。常用的X射线靶材有W、Ag、Mo、Ni、Co、Fe、Cr、Cu等。X射线管线焦点为1×10平方毫米,取出角为3~6度。此X射线管为密闭式,功率为2千瓦。X射线靶材为Cu。 选择阳极靶的基本要求:尽可能避免靶材产生的特征X射线激发样品的荧光辐射,以降低衍射花样的背底,使图样清晰。 2.测角仪 测角仪是粉末X射线衍射仪的核心部件,主要由索拉光阑、发散狭缝、接收狭缝、防散射狭缝、样品座及闪烁探测器等组成。 (1)衍射仪一般利用线焦点作为X射线源S。如果采用焦斑尺寸为1×10平方毫米的常规X射线管,出射角6°时,实际有效焦宽为0.1毫米,成为0.1×10平方毫米的线状X射线源。 (2)从S发射的X射线,其水平方向的发散角被第一个狭缝限制之后,照射试样。这个狭缝称为发散狭缝(DS),生产厂供给1/6°、1/2°、1°、2°、4°的发散狭缝和测角仪调整用0.05毫米宽的狭缝。 (3)从试样上衍射的X射线束,在F处聚焦,放在这个位置的第二个狭缝,称为接收狭缝(RS).生产厂供给0.15毫米、0.3毫米、0.6毫米宽的接收狭缝。 (4)第三个狭缝是防止空气散射等非试样散射X射线进入计数管,称为防散射狭缝(SS)。SS和DS配对,生产厂供给与发散狭缝的发射角相同的防散射狭缝。 (5)S1、S2称为索拉狭缝,是由一组等间距相互平行的薄金属片组成,它限制入射X射线和衍射线的垂直方向发散。索拉狭缝装在叫做索拉狭缝盒的框架里。这个框架兼作其他狭缝插座用,即插入DS,
X射线多晶衍射法物相分析
X 射线多晶衍射法物相分析 1 目的要求 (1) 掌握X 射线多晶衍射法的实验原理和技术。 (2) 学会根据X 射线衍射图,使用X 射线粉末衍射索引和卡片进行物相分析。 2 基本原理 若以 代表晶体的一族晶面的指标, 是这族晶面中相邻两平面的间距,入射X 射线与这族晶面的夹角 满足下面布拉格方程时,就可产生衍射。 式中n 为整数,表示相邻两晶面的光程差为n 个波,所以n 又叫衍射级数,式中 常 用 表示, 称为衍射指标,它和晶面指标是整数位关系。 当单色X 射线照到多晶样品上时,由于多晶样品中含有许许多多小晶粒,它们取向随机地聚集在一起,同样一族晶面和X 射线夹角为θ的方向有无数个,产生无数个衍射,形成以 入射线为中心, 为顶角的衍射圆锥,它将对应于X 射线衍射图谱的一个衍射峰。多晶样品中有许多晶面族,当它们符合衍射条件时,相应地会形成许多以入射线为中心轴张角不同的衍射线。不同的晶面其晶面间距不同,可见晶面间距决定了衍射峰的位置,而晶面间距d 是晶胞参数的函数,所以衍射峰的位置是由晶胞参数所决定的。至于衍射峰的强度I 与结构因子|F |2成正比,而|F |2是晶胞内原子的种类、数量、坐标的函数,因此,衍射强度是由晶胞的结构所决定的。由于每一种晶体都有它特定的结构,不可能有两种不同的晶体物质具有完全相同的晶胞参数和晶胞结构,也就不会有两种不同的物质具有完全相同的衍射图,晶体衍射图就象人的指纹一样各不相同,即每种晶体都有它自己的“d/n ~I ”数据,可以据此来鉴别晶体物质的物相。若一物质含有多种物相,这几种物相给出各自的衍射图,彼此独立,互不相干,即由几种物相组成的固体样品的衍射图,是各个物相的衍射图,按各物相的比例,简单叠加在一起构成的。这样就十分有利于对多相体系进行全面的物相分析了。 国际粉末衍射标准联合会(JCPDS)已收集了几万种晶体的衍射标准数据,并编制了一套X 射线粉末衍射卡片(PDF ,其内容和检索方法见附2)。实际工作中只要测得试样的多晶衍射数据,再去查对粉末衍射卡片,即可鉴定试样,进行物相分析。 3 仪器 试剂 X 射线衍射仪 玛瑙研钵 分样筛 粉末样品板 选择若干合适晶体的未知物样品 4 实验步骤 (1)预习:有条件的情况下,利用附1介绍的X 射线多晶衍射法物相分析的模拟软件,预习X 射线多晶衍射法进行物相分析的基本过程。 (2)制样:用玛瑙研钵将样品研细后,通过325目筛,将筛下物放在样品板的槽内,略高于槽面,用不锈钢片适当压紧样品,且表面光滑平整,必要时可滴一层酒精溶液(或溶有少量苯乙烯的甲苯溶液),然后将样品板轻轻地插在测角仪中心的样品架上。 (3)测试: ①首先打开冷却水阀门和总电源及计算机稳压电源。 ②打开X 射线发生器总电源,将稳压、稳流调节至最小值,关好防护罩门,调整好水量,)(l k h '''l k h d ' ''l n k n h n ' ''θλθn d l n k n h n l k h ='''''' sin 2l n k n h n '''hkl hkl θ4
实验2X射线衍射法测定晶胞常数
实验1 Gaussian03初步运用--分子构建、优化和红外光谱模拟计算 一、实验目的 掌握Gaussian软件的安装过程,了解Gaussian软件的作用; 掌握分子几何构型的输入方法;苯、乙炔、乙烯、乙烷、乙酰氯分子 运用高斯软件进行乙酰氯分子模型的构建及优化并且计算乙酰氯分子的相关热力学性质 二、实验过程: (实验软件为guassview 3.07,计算机系统为wins7 32位的。) Ⅰ、Gaussian软件的安装: 第一步:从公共邮箱下载了一个Gaussian03的压缩包,进行解压后得到一个名为Gaussian03的文件夹。 第二步:在名为Gaussian03的文件夹中找到一个后缀名为exe的应用程序文件,双击后安装过程就开始了。安装需要注册码,在名为Gaussian03的文件夹中有一个名为keys的文件中注册码,输入注册码后安装过程来到了下一步。 第三步: 安装的种类有三种:typical,compact和custom,其中typical是一种大多数使用者选择的安装方式,不需要自己选择安装的具体信息,因此选择了这种安装方式。第四步:选择好安装方式后,就需要选择安装路径,选择好E:/应用程序/高斯软件这个安装路径,然后电脑完成了Gaussian03软件的安装。 II、操作过程:(1)乙酰氯分子的优化: 打开gaussian view View→builder 弹出下框:
画完后计算优化:Calculate→gaussian 点击submit进行计算即可,但可能由于软件安装时出了问题,该键不能点击,故优化分子失败。 (2)计算乙酰氯的热力学性质 Calculate→gaussian 在如下图所示的Job Type中选择“opt+freq”:
17 X射线多晶衍射法物相分析
实验十七 X 射线多晶衍射法物相分析 1 目的要求 (1) 掌握X 射线多晶衍射法的实验原理和技术。 (2) 学会根据X 射线衍射图,使用X 射线粉末衍射索引和卡片进行物相分析。 2 基本原理 若以 代表晶体的一族晶面的指标, 是这族晶面中相邻两平面的间距,入射X 射线与这族晶面的夹角 满足下面布拉格方程时,就可产生衍射。 式中n 为整数,表示相邻两晶面的光程差为n 个波,所以n 又叫衍射级数,式中 常 用 表示, 称为衍射指标,它和晶面指标是整数位关系。 当单色X 射线照到多晶样品上时,由于多晶样品中含有许许多多小晶粒,它们取向随机地聚集在一起,同样一族晶面和X 射线夹角为θ的方向有无数个,产生无数个衍射,形成以 入射线为中心, 为顶角的衍射圆锥,它将对应于X 射线衍射图谱的一个衍射峰。多晶样品中有许多晶面族,当它们符合衍射条件时,相应地会形成许多以入射线为中心轴张角不同的衍射线。不同的晶面其晶面间距不同,可见晶面间距决定了衍射峰的位置,而晶面间距d 是晶胞参数的函数,所以衍射峰的位置是由晶胞参数所决定的。至于衍射峰的强度I 与结构因子|F |2成正比,而|F |2是晶胞内原子的种类、数量、坐标的函数,因此,衍射强度是由晶胞的结构所决定的。由于每一种晶体都有它特定的结构,不可能有两种不同的晶体物质具有完全相同的晶胞参数和晶胞结构,也就不会有两种不同的物质具有完全相同的衍射图,晶体衍射图就象人的指纹一样各不相同,即每种晶体都有它自己的“d/n ~I ”数据,可以据此来鉴别晶体物质的物相。若一物质含有多种物相,这几种物相给出各自的衍射图,彼此独立,互不相干,即由几种物相组成的固体样品的衍射图,是各个物相的衍射图,按各物相的比例,简单叠加在一起构成的。这样就十分有利于对多相体系进行全面的物相分析了。 国际粉末衍射标准联合会(JCPDS)已收集了几万种晶体的衍射标准数据,并编制了一套X 射线粉末衍射卡片(PDF ,其内容和检索方法见附2)。实际工作中只要测得试样的多晶衍射数据,再去查对粉末衍射卡片,即可鉴定试样,进行物相分析。 3 仪器 试剂 X 射线衍射仪 玛瑙研钵 分样筛 粉末样品板 选择若干合适晶体的未知物样品 4 实验步骤 (1)预习:有条件的情况下,利用附1介绍的X 射线多晶衍射法物相分析的模拟软件,预习X 射线多晶衍射法进行物相分析的基本过程。 (2)制样:用玛瑙研钵将样品研细后,通过325目筛,将筛下物放在样品板的槽内,略高于槽面,用不锈钢片适当压紧样品,且表面光滑平整,必要时可滴一层酒精溶液(或溶有少量苯乙烯的甲苯溶液),然后将样品板轻轻地插在测角仪中心的样品架上。 (3)测试: ①首先打开冷却水阀门和总电源及计算机稳压电源。 ②打开X 射线发生器总电源,将稳压、稳流调节至最小值,关好防护罩门,调整好水量,)(l k h '''l k h d ' ''l n k n h n ' ''θλθn d l n k n h n l k h ='''''' sin 2l n k n h n '''hkl hkl θ4
X射线衍射实验样品制备要求
X射线衍射实验样品制备要求 金属样品如块状、板状、圆拄状要求磨成一个平面,面积不小于10X10毫米,如果面积太小可以用几块粘贴一起。 对于片状、圆拄状样品会存在严重的择优取向,衍射强度异常。因此要求测试时合理选择响应的方向平面。 对于测量金属样品的微观应力(晶格畸变),测量残余奥氏体,要求样品不能简单粗磨,要求制备成金相样品,并进行普通抛光或电解抛 光,消除表面应变层。 粉末样品要求磨成320目的粒度,约40微米。粒度粗大衍射强度底,峰形不好,分辨率低。要了解样品的物理化学性质,如是否易燃,易潮解,易腐蚀、有毒、易挥发。 粉末样品要求在3克左右,如果太少也需5毫克。 样品可以是金属、非金属、有机、无机材料粉末。 对于研究课题使用的、购买的各种原料一定要进行鉴定,如材料分子式,晶型,结晶度,粒度等。以免用错原料。 对于不同基体的薄膜样品,要了解检验确定基片的取向,X射线测量的膜厚度约20个纳米。 对于纤维样品的测试应该提出测试纤维的照射方向,是平行照射还是垂直照射,因为取向不同衍射强度也不相同。 对于焊接材料,如断口、焊缝表面的衍射分析,要求断口相对平整,
提供断口所含元素。如果一个断口照射面积小则可用两个或三个断口拼起来。 为保证对实验样品有一个好的实验结果,对于特殊的样品可以找老师帮助提出衍射实验方案。 要求研究生、博士生、具备材料X射线衍射数据的分析解析能力,能独立的鉴定对照PDF卡标准衍射数据。实验室为同学们提供PDF数据库的检索。 X射线衍射技术可以分析研究金属固溶体、合金相结构、氧化物相合成、材料结晶状态、金属合金化、金属合金薄膜与取向、焊接金属相、各种纤维结构与取相、结晶度、原料的晶型结构检验、金属的氧化、各种陶瓷与合金的相变、晶格参数测定、非晶态结构、纳米材料粒度、矿物原料结构、建筑材料相分析、水泥的物相分析等。 非金属材料的X射线衍射技术可以分析材料合成结构、氧化物固相相转变、电化学材料结构变化、纳米材料掺杂、催化剂材料掺杂、晶体材料结构、金属非金属氧化膜、高分子材料结晶度、各种沉积物、挥发物、化学产物、氧化膜相分析、化学镀电镀层相分析等。 X射线实验室接受同学们的XRD衍射技术咨询和指导,并提供PDF检索数据库供同学们检索。 如果对样品的成分不了解可以利用X射线荧光光谱仪测定成分为X射线衍射分析提供成分信息。 X射线衍射实验的准确性和实验得到的信息质量好与坏与样品的制备有很大关系,在做XRD衍射实验时合理处理样品和制备样品。