Evidences of spatial (angular) filtering of sound beams by sonic crystals
Fundamentals of Kalman Filtering a Practical Approach
1-6
Numerical Basics
Fundamentals of Kalman Filtering: A Practical Approach
1-7
Numerical Basics Overview
Fundamentals of Kalman Filtering: A Practical Approach
1 - 10
Vector Operations - 2
Vector subtraction
x1 y1 x2 y2 x3 y3 x -y = . - . = . . . . xn yn x1 - y1 x2 - y2 x3 - y3 . . . xn - yn
Fundamentals of Kalman Filtering: A Practical Approach
Paul Zarchan
Fundamentals of Kalman Filtering: A Practical Approach
1-1
Seminar Outline - 1
• Numerical Techniques - Required background - Introduction to source code • Method of Least Squares - How to build batch process least squares filter - Performance and software comparison of different order filters • Recursive Least Squares Filtering - How to make batch process filter recursive - Formulas and properties of various order filters
英语
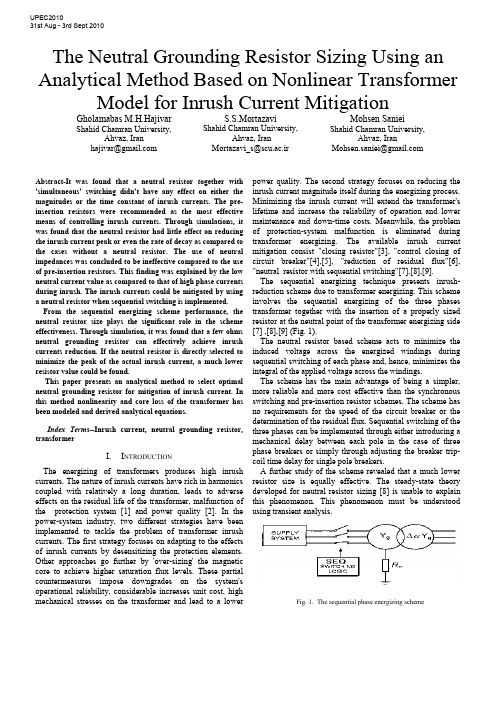
The Neutral Grounding Resistor Sizing Using an Analytical Method Based on Nonlinear Transformer Model for Inrush Current MitigationGholamabas M.H.Hajivar Shahid Chamran University,Ahvaz, Iranhajivar@S.S.MortazaviShahid Chamran University,Ahvaz, IranMortazavi_s@scu.ac.irMohsen SanieiShahid Chamran University,Ahvaz, IranMohsen.saniei@Abstract-It was found that a neutral resistor together with 'simultaneous' switching didn't have any effect on either the magnitudes or the time constant of inrush currents. The pre-insertion resistors were recommended as the most effective means of controlling inrush currents. Through simulations, it was found that the neutral resistor had little effect on reducing the inrush current peak or even the rate of decay as compared to the cases without a neutral resistor. The use of neutral impedances was concluded to be ineffective compared to the use of pre-insertion resistors. This finding was explained by the low neutral current value as compared to that of high phase currents during inrush. The inrush currents could be mitigated by using a neutral resistor when sequential switching is implemented. From the sequential energizing scheme performance, the neutral resistor size plays the significant role in the scheme effectiveness. Through simulation, it was found that a few ohms neutral grounding resistor can effectively achieve inrush currents reduction. If the neutral resistor is directly selected to minimize the peak of the actual inrush current, a much lower resistor value could be found.This paper presents an analytical method to select optimal neutral grounding resistor for mitigation of inrush current. In this method nonlinearity and core loss of the transformer has been modeled and derived analytical equations.Index Terms--Inrush current, neutral grounding resistor, transformerI.I NTRODUCTIONThe energizing of transformers produces high inrush currents. The nature of inrush currents have rich in harmonics coupled with relatively a long duration, leads to adverse effects on the residual life of the transformer, malfunction of the protection system [1] and power quality [2]. In the power-system industry, two different strategies have been implemented to tackle the problem of transformer inrush currents. The first strategy focuses on adapting to the effects of inrush currents by desensitizing the protection elements. Other approaches go further by 'over-sizing' the magnetic core to achieve higher saturation flux levels. These partial countermeasures impose downgrades on the system's operational reliability, considerable increases unit cost, high mechanical stresses on the transformer and lead to a lower power quality. The second strategy focuses on reducing the inrush current magnitude itself during the energizing process. Minimizing the inrush current will extend the transformer's lifetime and increase the reliability of operation and lower maintenance and down-time costs. Meanwhile, the problem of protection-system malfunction is eliminated during transformer energizing. The available inrush current mitigation consist "closing resistor"[3], "control closing of circuit breaker"[4],[5], "reduction of residual flux"[6], "neutral resistor with sequential switching"[7],[8],[9].The sequential energizing technique presents inrush-reduction scheme due to transformer energizing. This scheme involves the sequential energizing of the three phases transformer together with the insertion of a properly sized resistor at the neutral point of the transformer energizing side [7] ,[8],[9] (Fig. 1).The neutral resistor based scheme acts to minimize the induced voltage across the energized windings during sequential switching of each phase and, hence, minimizes the integral of the applied voltage across the windings.The scheme has the main advantage of being a simpler, more reliable and more cost effective than the synchronous switching and pre-insertion resistor schemes. The scheme has no requirements for the speed of the circuit breaker or the determination of the residual flux. Sequential switching of the three phases can be implemented through either introducing a mechanical delay between each pole in the case of three phase breakers or simply through adjusting the breaker trip-coil time delay for single pole breakers.A further study of the scheme revealed that a much lower resistor size is equally effective. The steady-state theory developed for neutral resistor sizing [8] is unable to explain this phenomenon. This phenomenon must be understood using transient analysis.Fig. 1. The sequential phase energizing schemeUPEC201031st Aug - 3rd Sept 2010The rise of neutral voltage is the main limitation of the scheme. Two methods present to control the neutral voltage rise: the use of surge arrestors and saturated reactors connected to the neutral point. The use of surge arresters was found to be more effective in overcoming the neutral voltage rise limitation [9].The main objective of this paper is to derive an analytical relationship between the peak of the inrush current and the size of the resistor. This paper presents a robust analytical study of the transformer energizing phenomenon. The results reveal a good deal of information on inrush currents and the characteristics of the sequential energizing scheme.II. SCHEME PERFORMANCESince the scheme adopts sequential switching, each switching stage can be investigated separately. For first-phase switching, the scheme's performance is straightforward. The neutral resistor is in series with the energized phase and this resistor's effect is similar to a pre-insertion resistor.The second- phase energizing is one of the most difficult to analyze. Fortunately, from simulation studies, it was found that the inrush current due to second-phase energizing is lower than that due to first-phase energizing for the same value of n R [9]. This result is true for the region where the inrush current of the first-phase is decreasing rapidly as n R increases. As a result, when developing a neutral-resistor-sizing criterion, the focus should be directed towards the analysis of the first-phase energizing.III. A NALYSIS OF F IRST -P HASE E NERGIZING The following analysis focuses on deriving an inrush current waveform expression covering both the unsaturatedand saturated modes of operation respectively. The presented analysis is based on a single saturated core element, but is suitable for analytical modelling of the single-phase transformers and for the single-phase switching of three-phase transformers. As shown in Fig. 2, the transformer's energized phase was modeled as a two segmented saturated magnetizing inductance in series with the transformer's winding resistance, leakage inductance and neutral resistance. The iron core non-l inear inductance as function of the operating flux linkages is represented as a linear inductor inunsaturated ‘‘m l ’’ and saturated ‘‘s l ’’ modes of operation respectively. (a)(b)Fig. 2. (a) Transformer electrical equivalent circuit (per-phase) referred to the primary side. (b) Simplified, two slope saturation curve.For the first-phase switching stage, the equivalent circuit represented in Fig. 2(a) can accurately represent behaviour of the transformer for any connection or core type by using only the positive sequence Flux-Current characteristics. Based on the transformer connection and core structure type, the phases are coupled either through the electrical circuit (3 single phase units in Yg-D connection) or through the Magnetic circuit (Core type transformers with Yg-Y connection) or through both, (the condition of Yg-D connection in an E-Core or a multi limb transformer). The coupling introduced between the windings will result in flux flowing through the limbs or magnetic circuits of un-energized phases. For the sequential switching application, the magnetic coupling will result in an increased reluctance (decreased reactance) for zero sequence flux path if present. The approach presented here is based on deriving an analytical expression relating the amount of inrush current reduction directly to the neutral resistor size. Investigation in this field has been done and some formulas were given to predict the general wave shape or the maximum peak current.A. Expression for magnitude of inrush currentIn Fig. 2(a), p r and p l present the total primary side resistance and leakage reactance. c R shows the total transformer core loss. Secondary side resistance sp r and leakage reactance sp l as referred to primary side are also shown. P V and s V represent the primary and secondary phase to ground terminal voltages, respectively.During first phase energizing, the differential equation describing behaviour of the transformer with saturated ironcore can be written as follows:()())sin((2) (1)φω+⋅⋅=⋅+⋅+⋅+=+⋅+⋅+=t V (t)V dtdi di d λdt di l (t)i R r (t)V dt d λdt di l (t)i R r (t)V m P ll p pp n p P p p p n p PAs the rate of change of the flux linkages with magnetizing current dt d /λcan be represented as an inductance equal to the slope of the i −λcurve, (2) can be re-written as follows;()(3) )()()(dtdi L dt di l t i R r t V lcore p p P n p P ⋅+⋅+⋅+=λ (4) )()(L core l p c l i i R dtdi−⋅=⋅λ⎩⎨⎧==sml core L L di d L λλ)(s s λλλλ>≤The general solution of the differential equations (3),(4) has the following form;⎪⎩⎪⎨⎧>−⋅⋅+−⋅+−−⋅+≤−⋅⋅+−⋅+−⋅=(5) )sin(//)()( )sin(//)(s s 22222221211112121111λλψωττλλψωττt B t e A t t e i A t B t e A t e A t i s s pSubscripts 11,12 and 21,22 denote un-saturated and saturated operation respectively. The parameters given in the equation (5) are given by;() )(/12221σ⋅++⎟⎟⎠⎞⎜⎜⎝⎛⋅−++⋅=m p c p m n p c m m x x R x x R r R x V B()2222)(/1σ⋅++⎟⎟⎠⎞⎜⎜⎝⎛⋅−++⋅=s p c p s n p c s m x x R x x R r R x V B⎟⎟⎟⎟⎟⎠⎞⎜⎜⎜⎜⎜⎝⎛⋅−+++=⋅−−⎟⎟⎟⎠⎞⎜⎜⎜⎝⎛−c p m n p m p c m R x x R r x x R x σφψ111tan tan ⎟⎟⎟⎟⎟⎠⎞⎜⎜⎜⎜⎜⎝⎛⋅−+++=⋅−−⎟⎟⎟⎠⎞⎜⎜⎜⎝⎛−c p s n p s p c m R R r x x R x σφψ112tan tan )sin(111211ψ⋅=+B A A )sin(222221s t B A A ⋅−⋅=+ωψ mp n p m p m p m p c xx R r x x x x x x R ⋅⋅+⋅−⋅+−⋅+⋅⋅⋅=)(4)()(21211σστm p n p m p m p m p c xx R r x x x x x x R ⋅⋅+⋅−⋅++⋅+⋅⋅⋅=)(4)()(21212σστ s p n p s p s p s p xx R r x x x x x x c R ⋅⋅+⋅−⋅+−⋅+⋅⋅⋅=)(4)()(21221σστ sp n p s p s p sp c xx R r x x x x x x R ⋅⋅+⋅−⋅++⋅+⋅⋅⋅=)(4)()(21222σστ ⎟⎟⎠⎞⎜⎜⎝⎛−⋅==s rs s ri i λλλ10 cnp R R r ++=1σ21221112 , ττττ>>>>⇒>>c R , 012≈A , 022≈A According to equation (5), the required inrush waveform assuming two-part segmented i −λcurve can be calculated for two separate un-saturated and saturated regions. For thefirst unsaturated mode, the current can be directly calculated from the first equation for all flux linkage values below the saturation level. After saturation is reached, the current waveform will follow the second given expression for fluxlinkage values above the saturation level. The saturation time s t can be found at the time when the current reaches the saturation current level s i .Where m λ,r λ,m V and ωare the nominal peak flux linkage, residual flux linkage, peak supply voltage and angular frequency, respectivelyThe inrush current waveform peak will essentially exist during saturation mode of operation. The focus should be concentrated on the second current waveform equation describing saturated operation mode, equation (5). The expression of inrush current peak could be directly evaluated when both saturation time s t and peak time of the inrush current waveform peak t t =are known [9].(10))( (9) )(2/)(222222121//)()(2B eA t e i A peak peak t s t s n peak n n peak R I R R t +−⋅+−−⋅+=+=ττωψπThe peak time peak t at which the inrush current will reachits peak can be numerically found through setting the derivative of equation (10) with respect to time equal to zero at peak t t =.()(11) )sin(/)(022222221212221/ψωωττττ−⋅⋅⋅−−−⋅+−=+−⋅peak t s t B A t te A i peak s peakeThe inrush waveform consists of exponentially decaying'DC' term and a sinusoidal 'AC' term. Both DC and AC amplitudes are significantly reduced with the increase of the available series impedance. The inrush waveform, neglecting the relatively small saturating current s i ,12A and 22A when extremely high could be normalized with respect to theamplitude of the sinusoidal term as follows; (12) )sin(/)()(2221221⎥⎦⎤⎢⎣⎡−⋅+−−⋅⋅=ψωτt t t e B A B t i s p(13) )sin(/)()sin()( 22221⎥⎦⎤⎢⎣⎡−⋅+−−⋅⋅−⋅=ψωτωψt t t e t B t i s s p ))(sin()( 2s n n t R R K ⋅−=ωψ (14) ωλλλφλφωλλφωmm m r s s t r m s mV t dt t V dtd t V V s=⎪⎭⎪⎬⎫⎪⎩⎪⎨⎧⎥⎥⎦⎤⎢⎢⎣⎡⎟⎟⎠⎞⎜⎜⎝⎛−−+−⋅=+⋅+⋅⋅==+⋅⋅=−∫(8) 1cos 1(7))sin((6))sin(10The factor )(n R K depends on transformer saturation characteristics (s λand r λ) and other parameters during saturation.Typical saturation and residual flux magnitudes for power transformers are in the range[9]; .).(35.1.).(2.1u p u p s <<λ and .).(9.0.).(7.0u p r u p <<λIt can be easily shown that with increased damping 'resistance' in the circuit, where the circuit phase angle 2ψhas lower values than the saturation angle s t ⋅ω, the exponential term is negative resulting in an inrush magnitude that is lowerthan the sinusoidal term amplitude.B. Neutral Grounding Resistor SizingBased on (10), the inrush current peak expression, it is now possible to select a neutral resistor size that can achieve a specific inrush current reduction ratio )(n R α given by:(15) )0(/)()(==n peak n peak n R I R I R α For the maximum inrush current condition (0=n R ), the total energized phase system impedance ratio X/R is high and accordingly, the damping of the exponential term in equation (10) during the first cycle can be neglected; [][](16))0(1)0()0(2212=⋅++⎥⎦⎤⎢⎣⎡⋅−+===⎟⎟⎠⎞⎜⎜⎝⎛+⋅⋅n s p c p s pR x n m n peak R x x R x x r R K V R I c s σ High n R values leading to considerable inrush current reduction will result in low X / R ratios. It is clear from (14) that X / R ratios equal to or less than 1 ensure negative DC component factor ')(n R K ' and hence the exponential term shown in (10) can be conservatively neglected. Accordingly, (10) can be re-written as follows;()[](17) )()(22122n s p c p s n p R x m n n peak R x x R x x R r V R B R I c s σ⋅++⎥⎦⎤⎢⎣⎡⋅−+=≈⎟⎟⎠⎞⎜⎜⎝⎛+⋅Using (16) and (17) to evaluate (15), the neutral resistorsize which corresponds to a specific reduction ratio can be given by;[][][](18) )0()(1)0( 12222=⋅++⋅−⋅++⋅−+⋅+=⎥⎥⎦⎤⎢⎢⎣⎡⎥⎥⎦⎤⎢⎢⎣⎡=n s p c p s p n s p c p s n p n R x x R x x r R x x R x x R r R K σσα Very high c R values leading to low transformer core loss, it can be re-written equation (18) as follows [9]; [][][][](19) 1)0(12222s p p s p n p n x x r x x R r R K +++++⋅+==α Equations (18) and (19) reveal that transformers require higher neutral resistor value to achieve the desired inrush current reduction rate. IV. A NALYSIS OF SECOND-P HASE E NERGIZING It is obvious that the analysis of the electric and magnetic circuit behavior during second phase switching will be sufficiently more complex than that for first phase switching.Transformer behaviour during second phase switching was served to vary with respect to connection and core structure type. However, a general behaviour trend exists within lowneutral resistor values where the scheme can effectively limitinrush current magnitude. For cases with delta winding or multi-limb core structure, the second phase inrush current is lower than that during first phase switching. Single phase units connected in star/star have a different performance as both first and second stage inrush currents has almost the same magnitude until a maximum reduction rate of about80% is achieved. V. NEUTRAL VOLTAGE RISEThe peak neutral voltage will reach values up to peak phasevoltage where the neutral resistor value is increased. Typicalneutral voltage peak profile against neutral resistor size is shown in Fig. 6- Fig. 8, for the 225 KVA transformer during 1st and 2nd phase switching. A del ay of 40 (ms) between each switching stage has been considered. VI. S IMULATION A 225 KVA, 2400V/600V, 50 Hz three phase transformer connected in star-star are used for the simulation study. The number of turns per phase primary (2400V) winding is 128=P N and )(01.0pu R R s P ==, )(05.0pu X X s P ==,active power losses in iron core=4.5 KW, average length and section of core limbs (L1=1.3462(m), A1=0.01155192)(2m ), average length and section of yokes (L2=0.5334(m),A2=0.01155192)(2m ), average length and section of air pathfor zero sequence flux return (L0=0.0127(m),A0=0.01155192)(2m ), three phase voltage for fluxinitialization=1 (pu) and B-H characteristic of iron core is inaccordance with Fig.3. A MATLAB program was prepared for the simulation study. Simulation results are shown in Fig.4-Fig.8.Fig. 3.B-H characteristic iron coreFig.4. Inrush current )(0Ω=n RFig.5. Inrush current )(5Ω=n RFig.6. Inrush current )(50Ω=n RFig.7. Maximum neutral voltage )(50Ω=n RFig.8. Maximum neutral voltage ).(5Ω=n RFig.9. Maximum inrush current in (pu), Maximum neutral voltage in (pu), Duration of the inrush current in (s)VII. ConclusionsIn this paper, Based on the sequential switching, presents an analytical method to select optimal neutral grounding resistor for transformer inrush current mitigation. In this method, complete transformer model, including core loss and nonlinearity core specification, has been used. It was shown that high reduction in inrush currents among the three phases can be achieved by using a neutral resistor .Other work presented in this paper also addressed the scheme's main practical limitation: the permissible rise of neutral voltage.VIII.R EFERENCES[1] Hanli Weng, Xiangning Lin "Studies on the UnusualMaloperation of Transformer Differential Protection During the Nonlinear Load Switch-In",IEEE Transaction on Power Delivery, vol. 24, no.4, october 2009.[2] Westinghouse Electric Corporation, Electric Transmissionand Distribution Reference Book, 4th ed. East Pittsburgh, PA, 1964.[3] K.P.Basu, Stella Morris"Reduction of Magnetizing inrushcurrent in traction transformer", DRPT2008 6-9 April 2008 Nanjing China.[4] J.H.Brunke, K.J.Frohlich “Elimination of TransformerInrush Currents by Controlled Switching-Part I: Theoretical Considerations” IEEE Trans. On Power Delivery, Vol.16,No.2,2001. [5] R. Apolonio,J.C.de Oliveira,H.S.Bronzeado,A.B.deVasconcellos,"Transformer Controlled Switching:a strategy proposal and laboratory validation",IEEE 2004, 11th International Conference on Harmonics and Quality of Power.[6] E. Andersen, S. Bereneryd and S. Lindahl, "SynchronousEnergizing of Shunt Reactors and Shunt Capacitors," OGRE paper 13-12, pp 1-6, September 1988.[7] Y. Cui, S. G. Abdulsalam, S. Chen, and W. Xu, “Asequential phase energizing method for transformer inrush current reduction—part I: Simulation and experimental results,” IEEE Trans. Power Del., vol. 20, no. 2, pt. 1, pp. 943–949, Apr. 2005.[8] W. Xu, S. G. Abdulsalam, Y. Cui, S. Liu, and X. Liu, “Asequential phase energizing method for transformer inrush current reduction—part II: Theoretical analysis and design guide,” IEEE Trans. Power Del., vol. 20, no. 2, pt. 1, pp. 950–957, Apr. 2005.[9] S.G. Abdulsalam and W. Xu "A Sequential PhaseEnergization Method for Transformer Inrush current Reduction-Transient Performance and Practical considerations", IEEE Transactions on Power Delivery,vol. 22, No.1, pp. 208-216,Jan. 2007.。
机器学习题库

机器学习题库一、 极大似然1、 ML estimation of exponential model (10)A Gaussian distribution is often used to model data on the real line, but is sometimesinappropriate when the data are often close to zero but constrained to be nonnegative. In such cases one can fit an exponential distribution, whose probability density function is given by()1xb p x e b-=Given N observations x i drawn from such a distribution:(a) Write down the likelihood as a function of the scale parameter b.(b) Write down the derivative of the log likelihood.(c) Give a simple expression for the ML estimate for b.2、换成Poisson 分布:()|,0,1,2,...!x e p x y x θθθ-==()()()()()1111log |log log !log log !N Ni i i i N N i i i i l p x x x x N x θθθθθθ======--⎡⎤=--⎢⎥⎣⎦∑∑∑∑3、二、 贝叶斯假设在考试的多项选择中,考生知道正确答案的概率为p ,猜测答案的概率为1-p ,并且假设考生知道正确答案答对题的概率为1,猜中正确答案的概率为1,其中m 为多选项的数目。
A Fast and Accurate Plane Detection Algorithm for Large Noisy Point Clouds Using Filtered Normals
A Fast and Accurate Plane Detection Algorithm for Large Noisy Point CloudsUsing Filtered Normals and Voxel GrowingJean-Emmanuel DeschaudFranc¸ois GouletteMines ParisTech,CAOR-Centre de Robotique,Math´e matiques et Syst`e mes60Boulevard Saint-Michel75272Paris Cedex06jean-emmanuel.deschaud@mines-paristech.fr francois.goulette@mines-paristech.frAbstractWith the improvement of3D scanners,we produce point clouds with more and more points often exceeding millions of points.Then we need a fast and accurate plane detection algorithm to reduce data size.In this article,we present a fast and accurate algorithm to detect planes in unorganized point clouds usingfiltered normals and voxel growing.Our work is based on afirst step in estimating better normals at the data points,even in the presence of noise.In a second step,we compute a score of local plane in each point.Then, we select the best local seed plane and in a third step start a fast and robust region growing by voxels we call voxel growing.We have evaluated and tested our algorithm on different kinds of point cloud and compared its performance to other algorithms.1.IntroductionWith the growing availability of3D scanners,we are now able to produce large datasets with millions of points.It is necessary to reduce data size,to decrease the noise and at same time to increase the quality of the model.It is in-teresting to model planar regions of these point clouds by planes.In fact,plane detection is generally afirst step of segmentation but it can be used for many applications.It is useful in computer graphics to model the environnement with basic geometry.It is used for example in modeling to detect building facades before classification.Robots do Si-multaneous Localization and Mapping(SLAM)by detect-ing planes of the environment.In our laboratory,we wanted to detect small and large building planes in point clouds of urban environments with millions of points for modeling. As mentioned in[6],the accuracy of the plane detection is important for after-steps of the modeling pipeline.We also want to be fast to be able to process point clouds with mil-lions of points.We present a novel algorithm based on re-gion growing with improvements in normal estimation and growing process.For our method,we are generic to work on different kinds of data like point clouds fromfixed scan-ner or from Mobile Mapping Systems(MMS).We also aim at detecting building facades in urban point clouds or little planes like doors,even in very large data sets.Our input is an unorganized noisy point cloud and with only three”in-tuitive”parameters,we generate a set of connected compo-nents of planar regions.We evaluate our method as well as explain and analyse the significance of each parameter. 2.Previous WorksAlthough there are many methods of segmentation in range images like in[10]or in[3],three have been thor-oughly studied for3D point clouds:region-growing, hough-transform from[14]and Random Sample Consen-sus(RANSAC)from[9].The application of recognising structures in urban laser point clouds is frequent in literature.Bauer in[4]and Boulaassal in[5]detect facades in dense3D point cloud by a RANSAC algorithm.V osselman in[23]reviews sur-face growing and3D hough transform techniques to de-tect geometric shapes.Tarsh-Kurdi in[22]detect roof planes in3D building point cloud by comparing results on hough-transform and RANSAC algorithm.They found that RANSAC is more efficient than thefirst one.Chao Chen in[6]and Yu in[25]present algorithms of segmentation in range images for the same application of detecting planar regions in an urban scene.The method in[6]is based on a region growing algorithm in range images and merges re-sults in one labelled3D point cloud.[25]uses a method different from the three we have cited:they extract a hi-erarchical subdivision of the input image built like a graph where leaf nodes represent planar regions.There are also other methods like bayesian techniques. In[16]and[8],they obtain smoothed surface from noisy point clouds with objects modeled by probability distribu-tions and it seems possible to extend this idea to point cloud segmentation.But techniques based on bayesian statistics need to optimize global statistical model and then it is diffi-cult to process points cloud larger than one million points.We present below an analysis of the two main methods used in literature:RANSAC and region-growing.Hough-transform algorithm is too time consuming for our applica-tion.To compare the complexity of the algorithm,we take a point cloud of size N with only one plane P of size n.We suppose that we want to detect this plane P and we define n min the minimum size of the plane we want to detect.The size of a plane is the area of the plane.If the data density is uniform in the point cloud then the size of a plane can be specified by its number of points.2.1.RANSACRANSAC is an algorithm initially developped by Fis-chler and Bolles in[9]that allows thefitting of models with-out trying all possibilities.RANSAC is based on the prob-ability to detect a model using the minimal set required to estimate the model.To detect a plane with RANSAC,we choose3random points(enough to estimate a plane).We compute the plane parameters with these3points.Then a score function is used to determine how the model is good for the remaining ually,the score is the number of points belonging to the plane.With noise,a point belongs to a plane if the distance from the point to the plane is less than a parameter γ.In the end,we keep the plane with the best score.Theprobability of getting the plane in thefirst trial is p=(nN )3.Therefore the probability to get it in T trials is p=1−(1−(nN )3)ing equation1and supposing n minN1,we know the number T min of minimal trials to have a probability p t to get planes of size at least n min:T min=log(1−p t)log(1−(n minN))≈log(11−p t)(Nn min)3.(1)For each trial,we test all data points to compute the score of a plane.The RANSAC algorithm complexity lies inO(N(Nn min )3)when n minN1and T min→0whenn min→N.Then RANSAC is very efficient in detecting large planes in noisy point clouds i.e.when the ratio n minN is 1but very slow to detect small planes in large pointclouds i.e.when n minN 1.After selecting the best model,another step is to extract the largest connected component of each plane.Connnected components mean that the min-imum distance between each point of the plane and others points is smaller(for distance)than afixed parameter.Schnabel et al.[20]bring two optimizations to RANSAC:the points selection is done locally and the score function has been improved.An octree isfirst created from point cloud.Points used to estimate plane parameters are chosen locally at a random depth of the octree.The score function is also different from RANSAC:instead of testing all points for one model,they test only a random subset and find the score by interpolation.The algorithm complexity lies in O(Nr4Ndn min)where r is the number of random subsets for the score function and d is the maximum octree depth. Their algorithm improves the planes detection speed but its complexity lies in O(N2)and it becomes slow on large data sets.And again we have to extract the largest connected component of each plane.2.2.Region GrowingRegion Growing algorithms work well in range images like in[18].The principle of region growing is to start with a seed region and to grow it by neighborhood when the neighbors satisfy some conditions.In range images,we have the neighbors of each point with pixel coordinates.In case of unorganized3D data,there is no information about the neighborhood in the data structure.The most common method to compute neighbors in3D is to compute a Kd-tree to search k nearest neighbors.The creation of a Kd-tree lies in O(NlogN)and the search of k nearest neighbors of one point lies in O(logN).The advantage of these region growing methods is that they are fast when there are many planes to extract,robust to noise and extract the largest con-nected component immediately.But they only use the dis-tance from point to plane to extract planes and like we will see later,it is not accurate enough to detect correct planar regions.Rabbani et al.[19]developped a method of smooth area detection that can be used for plane detection.Theyfirst estimate the normal of each point like in[13].The point with the minimum residual starts the region growing.They test k nearest neighbors of the last point added:if the an-gle between the normal of the point and the current normal of the plane is smaller than a parameterαthen they add this point to the smooth region.With Kd-tree for k nearest neighbors,the algorithm complexity is in O(N+nlogN). The complexity seems to be low but in worst case,when nN1,example for facade detection in point clouds,the complexity becomes O(NlogN).3.Voxel Growing3.1.OverviewIn this article,we present a new algorithm adapted to large data sets of unorganized3D points and optimized to be accurate and fast.Our plane detection method works in three steps.In thefirst part,we compute a better esti-mation of the normal in each point by afiltered weighted planefitting.In a second step,we compute the score of lo-cal planarity in each point.We select the best seed point that represents a good seed plane and in the third part,we grow this seed plane by adding all points close to the plane.Thegrowing step is based on a voxel growing algorithm.The filtered normals,the score function and the voxel growing are innovative contributions of our method.As an input,we need dense point clouds related to the level of detail we want to detect.As an output,we produce connected components of planes in the point cloud.This notion of connected components is linked to the data den-sity.With our method,the connected components of planes detected are linked to the parameter d of the voxel grid.Our method has 3”intuitive”parameters :d ,area min and γ.”intuitive”because there are linked to physical mea-surements.d is the voxel size used in voxel growing and also represents the connectivity of points in detected planes.γis the maximum distance between the point of a plane and the plane model,represents the plane thickness and is linked to the point cloud noise.area min represents the minimum area of planes we want to keep.3.2.Details3.2.1Local Density of Point CloudsIn a first step,we compute the local density of point clouds like in [17].For that,we find the radius r i of the sphere containing the k nearest neighbors of point i .Then we cal-culate ρi =kπr 2i.In our experiments,we find that k =50is a good number of neighbors.It is important to know the lo-cal density because many laser point clouds are made with a fixed resolution angle scanner and are therefore not evenly distributed.We use the local density in section 3.2.3for the score calculation.3.2.2Filtered Normal EstimationNormal estimation is an important part of our algorithm.The paper [7]presents and compares three normal estima-tion methods.They conclude that the weighted plane fit-ting or WPF is the fastest and the most accurate for large point clouds.WPF is an idea of Pauly and al.in [17]that the fitting plane of a point p must take into consider-ation the nearby points more than other distant ones.The normal least square is explained in [21]and is the mini-mum of ki =1(n p ·p i +d )2.The WPF is the minimum of ki =1ωi (n p ·p i +d )2where ωi =θ( p i −p )and θ(r )=e −2r 2r2i .For solving n p ,we compute the eigenvec-tor corresponding to the smallest eigenvalue of the weightedcovariance matrix C w = ki =1ωi t (p i −b w )(p i −b w )where b w is the weighted barycenter.For the three methods ex-plained in [7],we get a good approximation of normals in smooth area but we have errors in sharp corners.In fig-ure 1,we have tested the weighted normal estimation on two planes with uniform noise and forming an angle of 90˚.We can see that the normal is not correct on the corners of the planes and in the red circle.To improve the normal calculation,that improves the plane detection especially on borders of planes,we propose a filtering process in two phases.In a first step,we com-pute the weighted normals (WPF)of each point like we de-scribed it above by minimizing ki =1ωi (n p ·p i +d )2.In a second step,we compute the filtered normal by us-ing an adaptive local neighborhood.We compute the new weighted normal with the same sum minimization but keep-ing only points of the neighborhood whose normals from the first step satisfy |n p ·n i |>cos (α).With this filtering step,we have the same results in smooth areas and better results in sharp corners.We called our normal estimation filtered weighted plane fitting(FWPF).Figure 1.Weighted normal estimation of two planes with uniform noise and with 90˚angle between them.We have tested our normal estimation by computing nor-mals on synthetic data with two planes and different angles between them and with different values of the parameter α.We can see in figure 2the mean error on normal estimation for WPF and FWPF with α=20˚,30˚,40˚and 90˚.Us-ing α=90˚is the same as not doing the filtering step.We see on Figure 2that α=20˚gives smaller error in normal estimation when angles between planes is smaller than 60˚and α=30˚gives best results when angle between planes is greater than 60˚.We have considered the value α=30˚as the best results because it gives the smaller mean error in normal estimation when angle between planes vary from 20˚to 90˚.Figure 3shows the normals of the planes with 90˚angle and better results in the red circle (normals are 90˚with the plane).3.2.3The score of local planarityIn many region growing algorithms,the criteria used for the score of the local fitting plane is the residual,like in [18]or [19],i.e.the sum of the square of distance from points to the plane.We have a different score function to estimate local planarity.For that,we first compute the neighbors N i of a point p with points i whose normals n i are close toFigure parison of mean error in normal estimation of two planes with α=20˚,30˚,40˚and 90˚(=Nofiltering).Figure 3.Filtered Weighted normal estimation of two planes with uniform noise and with 90˚angle between them (α=30˚).the normal n p .More precisely,we compute N i ={p in k neighbors of i/|n i ·n p |>cos (α)}.It is a way to keep only the points which are probably on the local plane before the least square fitting.Then,we compute the local plane fitting of point p with N i neighbors by least squares like in [21].The set N i is a subset of N i of points belonging to the plane,i.e.the points for which the distance to the local plane is smaller than the parameter γ(to consider the noise).The score s of the local plane is the area of the local plane,i.e.the number of points ”in”the plane divided by the localdensity ρi (seen in section 3.2.1):the score s =card (N i)ρi.We take into consideration the area of the local plane as the score function and not the number of points or the residual in order to be more robust to the sampling distribution.3.2.4Voxel decompositionWe use a data structure that is the core of our region growing method.It is a voxel grid that speeds up the plane detection process.V oxels are small cubes of length d that partition the point cloud space.Every point of data belongs to a voxel and a voxel contains a list of points.We use the Octree Class Template in [2]to compute an Octree of the point cloud.The leaf nodes of the graph built are voxels of size d .Once the voxel grid has been computed,we start the plane detection algorithm.3.2.5Voxel GrowingWith the estimator of local planarity,we take the point p with the best score,i.e.the point with the maximum area of local plane.We have the model parameters of this best seed plane and we start with an empty set E of points belonging to the plane.The initial point p is in a voxel v 0.All the points in the initial voxel v 0for which the distance from the seed plane is less than γare added to the set E .Then,we compute new plane parameters by least square refitting with set E .Instead of growing with k nearest neighbors,we grow with voxels.Hence we test points in 26voxel neigh-bors.This is a way to search the neighborhood in con-stant time instead of O (logN )for each neighbor like with Kd-tree.In a neighbor voxel,we add to E the points for which the distance to the current plane is smaller than γand the angle between the normal computed in each point and the normal of the plane is smaller than a parameter α:|cos (n p ,n P )|>cos (α)where n p is the normal of the point p and n P is the normal of the plane P .We have tested different values of αand we empirically found that 30˚is a good value for all point clouds.If we added at least one point in E for this voxel,we compute new plane parameters from E by least square fitting and we test its 26voxel neigh-bors.It is important to perform plane least square fitting in each voxel adding because the seed plane model is not good enough with noise to be used in all voxel growing,but only in surrounding voxels.This growing process is faster than classical region growing because we do not compute least square for each point added but only for each voxel added.The least square fitting step must be computed very fast.We use the same method as explained in [18]with incre-mental update of the barycenter b and covariance matrix C like equation 2.We know with [21]that the barycen-ter b belongs to the least square plane and that the normal of the least square plane n P is the eigenvector of the smallest eigenvalue of C .b0=03x1C0=03x3.b n+1=1n+1(nb n+p n+1).C n+1=C n+nn+1t(pn+1−b n)(p n+1−b n).(2)where C n is the covariance matrix of a set of n points,b n is the barycenter vector of a set of n points and p n+1is the (n+1)point vector added to the set.This voxel growing method leads to a connected com-ponent set E because the points have been added by con-nected voxels.In our case,the minimum distance between one point and E is less than parameter d of our voxel grid. That is why the parameter d also represents the connectivity of points in detected planes.3.2.6Plane DetectionTo get all planes with an area of at least area min in the point cloud,we repeat these steps(best local seed plane choice and voxel growing)with all points by descending order of their score.Once we have a set E,whose area is bigger than area min,we keep it and classify all points in E.4.Results and Discussion4.1.Benchmark analysisTo test the improvements of our method,we have em-ployed the comparative framework of[12]based on range images.For that,we have converted all images into3D point clouds.All Point Clouds created have260k points. After our segmentation,we project labelled points on a seg-mented image and compare with the ground truth image. We have chosen our three parameters d,area min andγby optimizing the result of the10perceptron training image segmentation(the perceptron is portable scanner that pro-duces a range image of its environment).Bests results have been obtained with area min=200,γ=5and d=8 (units are not provided in the benchmark).We show the re-sults of the30perceptron images segmentation in table1. GT Regions are the mean number of ground truth planes over the30ground truth range images.Correct detection, over-segmentation,under-segmentation,missed and noise are the mean number of correct,over,under,missed and noised planes detected by methods.The tolerance80%is the minimum percentage of points we must have detected comparing to the ground truth to have a correct detection. More details are in[12].UE is a method from[12],UFPR is a method from[10]. It is important to notice that UE and UFPR are range image methods and our method is not well suited for range images but3D Point Cloud.Nevertheless,it is a good benchmark for comparison and we see in table1that the accuracy of our method is very close to the state of the art in range image segmentation.To evaluate the different improvements of our algorithm, we have tested different variants of our method.We have tested our method without normals(only with distance from points to plane),without voxel growing(with a classical region growing by k neighbors),without our FWPF nor-mal estimation(with WPF normal estimation),without our score function(with residual score function).The compari-son is visible on table2.We can see the difference of time computing between region growing and voxel growing.We have tested our algorithm with and without normals and we found that the accuracy cannot be achieved whithout normal computation.There is also a big difference in the correct de-tection between WPF and our FWPF normal estimation as we can see in thefigure4.Our FWPF normal brings a real improvement in border estimation of planes.Black points in thefigure are non classifiedpoints.Figure5.Correct Detection of our segmentation algorithm when the voxel size d changes.We would like to discuss the influence of parameters on our algorithm.We have three parameters:area min,which represents the minimum area of the plane we want to keep,γ,which represents the thickness of the plane(it is gener-aly closely tied to the noise in the point cloud and espe-cially the standard deviationσof the noise)and d,which is the minimum distance from a point to the rest of the plane. These three parameters depend on the point cloud features and the desired segmentation.For example,if we have a lot of noise,we must choose a highγvalue.If we want to detect only large planes,we set a large area min value.We also focus our analysis on the robustess of the voxel size d in our algorithm,i.e.the ratio of points vs voxels.We can see infigure5the variation of the correct detection when we change the value of d.The method seems to be robust when d is between4and10but the quality decreases when d is over10.It is due to the fact that for a large voxel size d,some planes from different objects are merged into one plane.GT Regions Correct Over-Under-Missed Noise Duration(in s)detection segmentation segmentationUE14.610.00.20.3 3.8 2.1-UFPR14.611.00.30.1 3.0 2.5-Our method14.610.90.20.1 3.30.7308Table1.Average results of different segmenters at80%compare tolerance.GT Regions Correct Over-Under-Missed Noise Duration(in s) Our method detection segmentation segmentationwithout normals14.6 5.670.10.19.4 6.570 without voxel growing14.610.70.20.1 3.40.8605 without FWPF14.69.30.20.1 5.0 1.9195 without our score function14.610.30.20.1 3.9 1.2308 with all improvements14.610.90.20.1 3.30.7308 Table2.Average results of variants of our segmenter at80%compare tolerance.4.1.1Large scale dataWe have tested our method on different kinds of data.We have segmented urban data infigure6from our Mobile Mapping System(MMS)described in[11].The mobile sys-tem generates10k pts/s with a density of50pts/m2and very noisy data(σ=0.3m).For this point cloud,we want to de-tect building facades.We have chosen area min=10m2, d=1m to have large connected components andγ=0.3m to cope with the noise.We have tested our method on point cloud from the Trim-ble VX scanner infigure7.It is a point cloud of size40k points with only20pts/m2with less noise because it is a fixed scanner(σ=0.2m).In that case,we also wanted to detect building facades and keep the same parameters ex-ceptγ=0.2m because we had less noise.We see infig-ure7that we have detected two facades.By setting a larger voxel size d value like d=10m,we detect only one plane. We choose d like area min andγaccording to the desired segmentation and to the level of detail we want to extract from the point cloud.We also tested our algorithm on the point cloud from the LEICA Cyrax scanner infigure8.This point cloud has been taken from AIM@SHAPE repository[1].It is a very dense point cloud from multiplefixed position of scanner with about400pts/m2and very little noise(σ=0.02m). In this case,we wanted to detect all the little planes to model the church in planar regions.That is why we have chosen d=0.2m,area min=1m2andγ=0.02m.Infigures6,7and8,we have,on the left,input point cloud and on the right,we only keep points detected in a plane(planes are in random colors).The red points in thesefigures are seed plane points.We can see in thesefig-ures that planes are very well detected even with high noise. Table3show the information on point clouds,results with number of planes detected and duration of the algorithm.The time includes the computation of the FWPF normalsof the point cloud.We can see in table3that our algo-rithm performs linearly in time with respect to the numberof points.The choice of parameters will have little influence on time computing.The computation time is about one mil-lisecond per point whatever the size of the point cloud(we used a PC with QuadCore Q9300and2Go of RAM).The algorithm has been implented using only one thread andin-core processing.Our goal is to compare the improve-ment of plane detection between classical region growing and our region growing with better normals for more ac-curate planes and voxel growing for faster detection.Our method seems to be compatible with out-of-core implemen-tation like described in[24]or in[15].MMS Street VX Street Church Size(points)398k42k7.6MMean Density50pts/m220pts/m2400pts/m2 Number of Planes202142Total Duration452s33s6900sTime/point 1ms 1ms 1msTable3.Results on different data.5.ConclusionIn this article,we have proposed a new method of plane detection that is fast and accurate even in presence of noise. We demonstrate its efficiency with different kinds of data and its speed in large data sets with millions of points.Our voxel growing method has a complexity of O(N)and it is able to detect large and small planes in very large data sets and can extract them directly in connected components.Figure 4.Ground truth,Our Segmentation without and with filterednormals.Figure 6.Planes detection in street point cloud generated by MMS (d =1m,area min =10m 2,γ=0.3m ).References[1]Aim@shape repository /.6[2]Octree class template /code/octree.html.4[3] A.Bab-Hadiashar and N.Gheissari.Range image segmen-tation using surface selection criterion.2006.IEEE Trans-actions on Image Processing.1[4]J.Bauer,K.Karner,K.Schindler,A.Klaus,and C.Zach.Segmentation of building models from dense 3d point-clouds.2003.Workshop of the Austrian Association for Pattern Recognition.1[5]H.Boulaassal,ndes,P.Grussenmeyer,and F.Tarsha-Kurdi.Automatic segmentation of building facades using terrestrial laser data.2007.ISPRS Workshop on Laser Scan-ning.1[6] C.C.Chen and I.Stamos.Range image segmentationfor modeling and object detection in urban scenes.2007.3DIM2007.1[7]T.K.Dey,G.Li,and J.Sun.Normal estimation for pointclouds:A comparison study for a voronoi based method.2005.Eurographics on Symposium on Point-Based Graph-ics.3[8]J.R.Diebel,S.Thrun,and M.Brunig.A bayesian methodfor probable surface reconstruction and decimation.2006.ACM Transactions on Graphics (TOG).1[9]M.A.Fischler and R.C.Bolles.Random sample consen-sus:A paradigm for model fitting with applications to image analysis and automated munications of the ACM.1,2[10]P.F.U.Gotardo,O.R.P.Bellon,and L.Silva.Range imagesegmentation by surface extraction using an improved robust estimator.2003.Proceedings of Computer Vision and Pat-tern Recognition.1,5[11] F.Goulette,F.Nashashibi,I.Abuhadrous,S.Ammoun,andurgeau.An integrated on-board laser range sensing sys-tem for on-the-way city and road modelling.2007.Interna-tional Archives of the Photogrammetry,Remote Sensing and Spacial Information Sciences.6[12] A.Hoover,G.Jean-Baptiste,and al.An experimental com-parison of range image segmentation algorithms.1996.IEEE Transactions on Pattern Analysis and Machine Intelligence.5[13]H.Hoppe,T.DeRose,T.Duchamp,J.McDonald,andW.Stuetzle.Surface reconstruction from unorganized points.1992.International Conference on Computer Graphics and Interactive Techniques.2[14]P.Hough.Method and means for recognizing complex pat-terns.1962.In US Patent.1[15]M.Isenburg,P.Lindstrom,S.Gumhold,and J.Snoeyink.Large mesh simplification using processing sequences.2003.。
基于稀疏表示的双平行线阵二维DOA_估计

第 21 卷 第 7 期2023 年 7 月太赫兹科学与电子信息学报Journal of Terahertz Science and Electronic Information TechnologyVol.21,No.7Jul.,2023基于稀疏表示的双平行线阵二维DOA估计苏龙,李雪,罗德凌(空军航空维修技术学院,湖南长沙410124)摘要:为了对空域目标的方位角和俯仰角进行有效估计,提出一种基于稀疏表示的双平行线阵二维DOA估计方法。
首先需构建包含目标方位角和俯仰角信息的2个空间复合角;然后利用稀疏表示技术求解其中的一个空间复合角,以此作为前提条件,另一个空间复合角就可以解耦为一维波达方向(DOA)估计问题,利用矩阵运算可以求解出来;最后根据已求解的2个空间复合角对方位角和俯仰角进行配对求解。
与现有算法相比较,所提方法受快拍数的影响较小,在信噪比较高、角度间隔较大的情况下,具有良好的性能。
关键词:稀疏表示;双平行线阵;波达方向;空间复合角中图分类号:TN911.7 文献标志码:A doi:10.11805/TKYDA2020710Two-dimensional DOA estimation of double parallel arrays based onsparse representationSU Long,LI Xue,LUO Deling(Air Force Aviation Maintenance Technical College,Changsha Hunan 410124,China)AbstractAbstract::In order to estimate the azimuth angle and pitch angle of airborne target effectively, a two-dimensional Direction Of Arrival(DOA) estimation method based on sparse representation is presented.Firstly, it is necessary to construct two spatial compound angles containing the azimuth and pitchinformation of the target; then, one of the spatial composite angles is solved by sparse representationtechnology, and the other spatial composite angle can be decoupled into one-dimensional DOAestimation problem, which can be solved by matrix operation; finally, the azimuth angle and pitch angleare solved in pairs according to the solved two spatial compound angles. Compared with the existingalgorithms, the proposed method is less affected by the number of snapshots, and has good performanceunder the condition of high signal-to-noise ratio and large angular interval.KeywordsKeywords::sparse representation;double parallel line array;Direction Of Arrival;spatial compound angle波达方向(DOA)的估计在阵列信号处理当中一直是一个热点,引起了许多学者的关注与研究[1-6],在雷达、通信、声呐领域取得了许多成果。
基于相关滤波器的目标跟踪方法综述

基于相关滤波器的⽬标跟踪⽅法综述0引⾔视觉跟踪是计算机视觉中引⼈瞩⽬且快速发展的领域,主要⽤于获取运动⽬标的位置、姿态、轨迹等基本运动信息,是理解服务对象或对⽬标实施控制的前提和基础。
其涉及许多具有挑战性的研究热点并常和其他计算机视觉问题结合出现,如导航制导、事件检测、⾏为识别、视频监控、⾃动驾驶、移动机器⼈等[1-4]。
虽然跟踪⽅法取得了长⾜进展,但由于遮挡、⽬标的平⾯内/外旋转、快速运动、模糊、光照及变形等因素的存在使其仍然是⾮常具有挑战性的⼯作。
近年来,基于相关滤波器CF(Correlation Filter)的跟踪⽅法得到了极⼤关注[5-9]。
CF 最⼤的优点是计算效率⾼,这归结于其假设训练数据的循环结构,因为⽬标和候选区域能在频域进⾏表⽰并通过快速傅⾥叶变换(FFT)操作。
Bolme [6]等⾸次将CF 应⽤于跟踪提出MOSSE 算法,其利⽤FFT 的快速性使跟踪速度达到了600-700fps 。
瑞典林雪平⼤学的Martin Danelljan 在2016年ECCV 上提出的相关滤波器跟踪算法C -COT [7]取得了VOT2016竞赛冠军,2017年其提出的改进算法ECO [8]在取得⾮常好的精度和鲁棒性的同时,显著提⾼运算速度⾄C-COT 的6倍之多。
基于CF 的跟踪算法如此优秀,已然成为研究热点。
近年和相关滤波有关的论⽂层出不穷,很有必要对这些论⽂及相关滤波的发展等进⾏⼀个归纳和总结,以推动该⽅向的发展。
⽂献[9]虽已做过综述并取得了⼀定效果,但有两点不⾜:(1)过多介绍现有⼏种⽅法的具体细节,没有对更多⽂献进⾏对⽐分析;(2)缺乏对基于相关滤波器跟踪⽅法的分类对⽐分析。
基于此,本⽂的不同基⾦项⽬:陕西理⼯⼤学科研项⽬资助(SLGKY16-03)基于相关滤波器的⽬标跟踪⽅法综述?马晓虹1,尹向雷2(1.陕西理⼯⼤学电⼯电⼦实验中⼼,陕西汉中723000;2.陕西理⼯⼤学电⽓⼯程学院,陕西汉中723000)摘要:⽬标跟踪是计算机视觉中的重要组成部分,⼴泛应⽤于军事、医学、安防、⾃动驾驶等领域。
Cubature Kalman Filters
1254IEEE TRANSACTIONS ON AUTOMATIC CONTROL, VOL. 54, NO. 6, JUNE 2009Cubature Kalman FiltersIenkaran Arasaratnam and Simon Haykin, Life Fellow, IEEEAbstract—In this paper, we present a new nonlinear filter for high-dimensional state estimation, which we have named the cubature Kalman filter (CKF). The heart of the CKF is a spherical-radial cubature rule, which makes it possible to numerically compute multivariate moment integrals encountered in the nonlinear Bayesian filter. Specifically, we derive a third-degree spherical-radial cubature rule that provides a set of cubature points scaling linearly with the state-vector dimension. The CKF may therefore provide a systematic solution for high-dimensional nonlinear filtering problems. The paper also includes the derivation of a square-root version of the CKF for improved numerical stability. The CKF is tested experimentally in two nonlinear state estimation problems. In the first problem, the proposed cubature rule is used to compute the second-order statistics of a nonlinearly transformed Gaussian random variable. The second problem addresses the use of the CKF for tracking a maneuvering aircraft. The results of both experiments demonstrate the improved performance of the CKF over conventional nonlinear filters. Index Terms—Bayesian filters, cubature rules, Gaussian quadrature rules, invariant theory, Kalman filter, nonlinear filtering.• Time update, which involves computing the predictive density(3)where denotes the history of input; is the measurement pairs up to time and the state transition old posterior density at time is obtained from (1). density • Measurement update, which involves computing the posterior density of the current stateI. INTRODUCTIONUsing the state-space model (1), (2) and Bayes’ rule we have (4) where the normalizing constant is given byIN this paper, we consider the filtering problem of a nonlinear dynamic system with additive noise, whose statespace model is defined by the pair of difference equations in discrete-time [1] (1) (2)is the state of the dynamic system at discrete where and are time ; is the known control input, some known functions; which may be derived from a compensator as in Fig. 1; is the measurement; and are independent process and measurement Gaussian noise sequences with zero and , respectively. means and covariances In the Bayesian filtering paradigm, the posterior density of the state provides a complete statistical description of the state at that time. On the receipt of a new measurement at time , we in update the old posterior density of the state at time two basic steps:Manuscript received July 02, 2008; revised July 02, 2008, August 29, 2008, and September 16, 2008. First published May 27, 2009; current version published June 10, 2009. This work was supported by the Natural Sciences & Engineering Research Council (NSERC) of Canada. Recommended by Associate Editor S. Celikovsky. The authors are with the Cognitive Systems Laboratory, Department of Electrical and Computer Engineering, McMaster University, Hamilton, ON L8S 4K1, Canada (e-mail: aienkaran@grads.ece.mcmaster.ca; haykin@mcmaster. ca). Color versions of one or more of the figures in this paper are available online at . Digital Object Identifier 10.1109/TAC.2009.2019800To develop a recursive relationship between the predictive density and the posterior density in (4), the inputs have to satisfy the relationshipwhich is also called the natural condition of control [2]. has sufficient This condition therefore suggests that information to generate the input . To be specific, the can be generated using . Under this condiinput tion, we may equivalently write (5) Hence, substituting (5) into (4) yields (6) as desired, where (7) and the measurement likelihood function obtained from (2). is0018-9286/$25.00 © 2009 IEEEARASARATNAM AND HAYKIN: CUBATURE KALMAN FILTERS1255Fig. 1. Signal-flow diagram of a dynamic state-space model driven by the feedback control input. The observer may employ a Bayesian filter. The label denotes the unit delay.The Bayesian filter solution given by (3), (6), and (7) provides a unified recursive approach for nonlinear filtering problems, at least conceptually. From a practical perspective, however, we find that the multi-dimensional integrals involved in (3) and (7) are typically intractable. Notable exceptions arise in the following restricted cases: 1) A linear-Gaussian dynamic system, the optimal solution for which is given by the celebrated Kalman filter [3]. 2) A discrete-valued state-space with a fixed number of states, the optimal solution for which is given by the grid filter (Hidden-Markov model filter) [4]. 3) A “Benes type” of nonlinearity, the optimal solution for which is also tractable [5]. In general, when we are confronted with a nonlinear filtering problem, we have to abandon the idea of seeking an optimal or analytical solution and be content with a suboptimal solution to the Bayesian filter [6]. In computational terms, suboptimal solutions to the posterior density can be obtained using one of two approximate approaches: 1) Local approach. Here, we derive nonlinear filters by fixing the posterior density to take a priori form. For example, we may assume it to be Gaussian; the nonlinear filters, namely, the extended Kalman filter (EKF) [7], the central-difference Kalman filter (CDKF) [8], [9], the unscented Kalman filter (UKF) [10], and the quadrature Kalman filter (QKF) [11], [12], fall under this first category. The emphasis on locality makes the design of the filter simple and fast to execute. 2) Global approach. Here, we do not make any explicit assumption about the posterior density form. For example, the point-mass filter using adaptive grids [13], the Gaussian mixture filter [14], and particle filters using Monte Carlo integrations with the importance sampling [15], [16] fall under this second category. Typically, the global methods suffer from enormous computational demands. Unfortunately, the presently known nonlinear filters mentioned above suffer from the curse of dimensionality [17] or divergence or both. The effect of curse of dimensionality may often become detrimental in high-dimensional state-space models with state-vectors of size 20 or more. The divergence may occur for several reasons including i) inaccurate or incomplete model of the underlying physical system, ii) informationloss in capturing the true evolving posterior density completely, e.g., a nonlinear filter designed under the Gaussian assumption may fail to capture the key features of a multi-modal posterior density, iii) high degree of nonlinearities in the equations that describe the state-space model, and iv) numerical errors. Indeed, each of the above-mentioned filters has its own domain of applicability and it is doubtful that a single filter exists that would be considered effective for a complete range of applications. For example, the EKF, which has been the method of choice for nonlinear filtering problems in many practical applications for the last four decades, works well only in a ‘mild’ nonlinear environment owing to the first-order Taylor series approximation for nonlinear functions. The motivation for this paper has been to derive a more accurate nonlinear filter that could be applied to solve a wide range (from low to high dimensions) of nonlinear filtering problems. Here, we take the local approach to build a new filter, which we have named the cubature Kalman filter (CKF). It is known that the Bayesian filter is rendered tractable when all conditional densities are assumed to be Gaussian. In this case, the Bayesian filter solution reduces to computing multi-dimensional integrals, whose integrands are all of the form nonlinear function Gaussian. The CKF exploits the properties of highly efficient numerical integration methods known as cubature rules for those multi-dimensional integrals [18]. With the cubature rules at our disposal, we may describe the underlying philosophy behind the derivation of the new filter as nonlinear filtering through linear estimation theory, hence the name “cubature Kalman filter.” The CKF is numerically accurate and easily extendable to high-dimensional problems. The rest of the paper is organized as follows: Section II derives the Bayesian filter theory in the Gaussian domain. Section III describes numerical methods available for moment integrals encountered in the Bayesian filter. The cubature Kalman filter, using a third-degree spherical-radial cubature rule, is derived in Section IV. Our argument for choosing a third-degree rule is articulated in Section V. We go on to derive a square-root version of the CKF for improved numerical stability in Section VI. The existing sigma-point approach is compared with the cubature method in Section VII. We apply the CKF in two nonlinear state estimation problems in Section VIII. Section IX concludes the paper with a possible extension of the CKF algorithm for a more general setting.1256IEEE TRANSACTIONS ON AUTOMATIC CONTROL, VOL. 54, NO. 6, JUNE 2009II. BAYESIAN FILTER THEORY IN THE GAUSSIAN DOMAIN The key approximation taken to develop the Bayesian filter theory under the Gaussian domain is that the predictive density and the filter likelihood density are both Gaussian, which eventually leads to a Gaussian posterior den. The Gaussian is the most convenient and widely sity used density function for the following reasons: • It has many distinctive mathematical properties. — The Gaussian family is closed under linear transformation and conditioning. — Uncorrelated jointly Gaussian random variables are independent. • It approximates many physical random phenomena by virtue of the central limit theorem of probability theory (see Sections 5.7 and 6.7 in [19] for more details). Under the Gaussian approximation, the functional recursion of the Bayesian filter reduces to an algebraic recursion operating only on means and covariances of various conditional densities encountered in the time and the measurement updates. A. Time Update In the time update, the Bayesian filter computes the mean and the associated covariance of the Gaussian predictive density as follows: (8) where is the statistical expectation operator. Substituting (1) into (8) yieldsTABLE I KALMAN FILTERING FRAMEWORKB. Measurement Update It is well known that the errors in the predicted measurements are zero-mean white sequences [2], [20]. Under the assumption that these errors can be well approximated by the Gaussian, we write the filter likelihood density (12) where the predicted measurement (13) and the associated covariance(14) Hence, we write the conditional Gaussian density of the joint state and the measurement(15) (9) where the cross-covariance is assumed to be zero-mean and uncorrelated Because with the past measurements, we get (16) On the receipt of a new measurement , the Bayesian filter from (15) yielding computes the posterior density (17) (10) where is the conventional symbol for a Gaussian density. Similarly, we obtain the error covariance where (18) (19) (20) If and are linear functions of the state, the Bayesian filter under the Gaussian assumption reduces to the Kalman filter. Table I shows how quantities derived above are called in the Kalman filtering framework. The signal-flow diagram in Fig. 2 summarizes the steps involved in the recursion cycle of the Bayesian filter. The heart of the Bayesian filter is therefore how to compute Gaussian(11)ARASARATNAM AND HAYKIN: CUBATURE KALMAN FILTERS1257Fig. 2. Signal-flow diagram of the recursive Bayesian filter under the Gaussian assumption, where “G-” stands for “Gaussian-.”weighted integrals whose integrands are all of the form nonGaussian density that are present in (10), linear function (11), (13), (14) and (16). The next section describes numerical integration methods to compute multi-dimensional weighted integrals. III. REVIEW ON NUMERICAL METHODS FOR MOMENT INTEGRALS Consider a multi-dimensional weighted integral of the form (21) is some arbitrary function, is the region of where for all integration, and the known weighting function . In a Gaussian-weighted integral, for example, is a Gaussian density and satisfies the nonnegativity condition in the entire region. If the solution to the above integral (21) is difficult to obtain, we may seek numerical integration methods to compute it. The basic task of numerically computing the integral (21) is to find a set of points and weights that approximates by a weighted sum of function evaluations the integral (22) The methods used to find can be divided into product rules and non-product rules, as described next. A. Product Rules ), we For the simplest one-dimensional case (that is, may apply the quadrature rule to compute the integral (21) numerically [21], [22]. In the context of the Bayesian filter, we mention the Gauss-Hermite quadrature rule; when the is in the form of a Gaussian density weighting functionis well approximated by a polynomial and the integrand in , the Gauss-Hermite quadrature rule is used to compute the Gaussian-weighted integral efficiently [12]. The quadrature rule may be extended to compute multidimensional integrals by successively applying it in a tensorproduct of one-dimensional integrals. Consider an -point per dimension quadrature rule that is exact for polynomials of points for functional degree up to . We set up a grid of evaluations and numerically compute an -dimensional integral while retaining the accuracy for polynomials of degree up to only. Hence, the computational complexity of the product quadrature rule increases exponentially with , and therefore , suffers from the curse of dimensionality. Typically for the product Gauss-Hermite quadrature rule is not a reasonable choice to approximate a recursive optimal Bayesian filter. B. Non-Product Rules To mitigate the curse of dimensionality issue in the product rules, we may seek non-product rules for integrals of arbitrary dimensions by choosing points directly from the domain of integration [18], [23]. Some of the well-known non-product rules include randomized Monte Carlo methods [4], quasi-Monte Carlo methods [24], [25], lattice rules [26] and sparse grids [27]–[29]. The randomized Monte Carlo methods evaluate the integration using a set of equally-weighted sample points drawn randomly, whereas in quasi-Monte Carlo methods and lattice rules the points are generated from a unit hyper-cube region using deterministically defined mechanisms. On the other hand, the sparse grids based on Smolyak formula in principle, combine a quadrature (univariate) routine for high-dimensional integrals more sophisticatedly; they detect important dimensions automatically and place more grid points there. Although the non-product methods mentioned here are powerful numerical integration tools to compute a given integral with a prescribed accuracy, they do suffer from the curse of dimensionality to certain extent [30].1258IEEE TRANSACTIONS ON AUTOMATIC CONTROL, VOL. 54, NO. 6, JUNE 2009C. Proposed Method In the recursive Bayesian estimation paradigm, we are interested in non-product rules that i) yield reasonable accuracy, ii) require small number of function evaluations, and iii) are easily extendable to arbitrarily high dimensions. In this paper we derive an efficient non-product cubature rule for Gaussianweighted integrals. Specifically, we obtain a third-degree fullysymmetric cubature rule, whose complexity in terms of function evaluations increases linearly with the dimension . Typically, a set of cubature points and weights are chosen so that the cubature rule is exact for a set of monomials of degree or less, as shown by (23)Gaussian density. Specifically, we consider an integral of the form (24)defined in the Cartesian coordinate system. To compute the above integral numerically we take the following two steps: i) We transform it into a more familiar spherical-radial integration form ii) subsequently, we propose a third-degree spherical-radial rule. A. Transformation In the spherical-radial transformation, the key step is a change of variable from the Cartesian vector to a radius and with , so direction vector as follows: Let for . Then the integral (24) can be that rewritten in a spherical-radial coordinate system as (25) is the surface of the sphere defined by and is the spherical surface measure or the area element on . We may thus write the radial integral (26) is defined by the spherical integral with the unit where weighting function (27) The spherical and the radial integrals are numerically computed by the spherical cubature rule (Section IV-B below) and the Gaussian quadrature rule (Section IV-C below), respectively. Before proceeding further, we introduce a number of notations and definitions when constructing such rules as follows: • A cubature rule is said to be fully symmetric if the following two conditions hold: implies , where is any point obtainable 1) from by permutations and/or sign changes of the coordinates of . on the region . That is, all points in 2) the fully symmetric set yield the same weight value. For example, in the one-dimensional space, a point in the fully symmetric set implies that and . • In a fully symmetric region, we call a point as a generator , where if , . The new should not be confused with the control input . zero coordinates and use • For brevity, we suppress to represent a complete fully the notation symmetric set of points that can be obtained by permutating and changing the sign of the generator in all possible ways. Of course, the complete set entails where; are non-negative integers and . Here, an important quality criterion of a cubature rule is its degree; the higher the degree of the cubature rule is, the more accurate solution it yields. To find the unknowns of the cubature rule of degree , we solve a set of moment equations. However, solving the system of moment equations may be more tedious with increasing polynomial degree and/or dimension of the integration domain. For example, an -point cubature rule entails unknown parameters from its points and weights. In general, we may form a system of equations with respect to unknowns from distinct monomials of degree up to . For the nonlinear system to have at least one solution (in this case, the system is said to be consistent), we use at least as many unknowns as equations [31]. That is, we choose to be . Suppose we obtain a cu. In this case, we solve bature rule of degree three for nonlinear moment equations; the re) sulting rule may consist of more than 85 ( weighted cubature points. To reduce the size of the system of algebraically independent equations or equivalently the number of cubature points markedly, Sobolev proposed the invariant theory in 1962 [32] (see also [31] and the references therein for a recent account of the invariant theory). The invariant theory, in principle, discusses how to restrict the structure of a cubature rule by exploiting symmetries of the region of integration and the weighting function. For example, integration regions such as the unit hypercube, the unit hypersphere, and the unit simplex exhibit symmetry. Hence, it is reasonable to look for cubature rules sharing the same symmetry. For the case considered above and ), using the invariant theory, we may con( cubature points struct a cubature rule consisting of by solving only a pair of moment equations (see Section IV). Note that the points and weights of the cubature rule are in. Hence, they can be computed dependent of the integrand off-line and stored in advance to speed up the filter execution. where IV. CUBATURE KALMAN FILTER As described in Section II, nonlinear filtering in the Gaussian domain reduces to a problem of how to compute integrals, whose integrands are all of the form nonlinear functionARASARATNAM AND HAYKIN: CUBATURE KALMAN FILTERS1259points when are all distinct. For example, represents the following set of points:Here, the generator is • We use . set B. Spherical Cubature Rule. to denote the -th point from theWe first postulate a third-degree spherical cubature rule that takes the simplest structure due to the invariant theory (28) The point set due to is invariant under permutations and sign changes. For the above choice of the rule (28), the monomials with being an odd integer, are integrated exactly. In order that this rule is exact for all monomials of degree up to three, it remains to require that the rule is exact , 2. Equivalently, to for all monomials for which find the unknown parameters and , it suffices to consider , and due to the fully symmonomials metric cubature rule (29) (30) where the surface area of the unit sphere with . Solving (29) and (30) , and . Hence, the cubature points are yields located at the intersection of the unit sphere and its axes. C. Radial Rule We next propose a Gaussian quadrature for the radial integration. The Gaussian quadrature is known to be the most efficient numerical method to compute a one-dimensional integration [21], [22]. An -point Gaussian quadrature is exact and constructed as up to polynomials of degree follows: (31) where is a known weighting function and non-negative on ; the points and the associated weights the interval are unknowns to be determined uniquely. In our case, a comparison of (26) and (31) yields the weighting function and and , respecthe interval to be tively. To transform this integral into an integral for which the solution is familiar, we make another change of variable via yielding. The integral on the right-hand side of where (32) is now in the form of the well-known generalized GaussLaguerre formula. The points and weights for the generalized Gauss-Laguerre quadrature are readily obtained as discussed elsewhere [21]. A first-degree Gauss-Laguerre rule is exact for . Equivalently, the rule is exact for ; it . is not exact for odd degree polynomials such as Fortunately, when the radial-rule is combined with the spherical rule to compute the integral (24), the (combined) spherical-radial rule vanishes for all odd-degree polynomials; the reason is that the spherical rule vanishes by symmetry for any odd-degree polynomial (see (25)). Hence, the spherical-radial rule for (24) is exact for all odd degrees. Following this argument, for a spherical-radial rule to be exact for all third-degree polyno, it suffices to consider the first-degree genermials in alized Gauss-Laguerre rule entailing a single point and weight. We may thus write (33) where the point is chosen to be the square-root of the root of the first-order generalized Laguerre polynomial, which is orthogonal with respect to the modified weighting function ; subsequently, we find by solving the zeroth-order moment equation appropriately. In this case, we , and . A detailed account have of computing the points and weights of a Gaussian quadrature with the classical and nonclassical weighting function is presented in [33]. D. Spherical-Radial Rule In this subsection, we describe two useful results that are used to i) combine the spherical and radial rule obtained separately, and ii) extend the spherical-radial rule for a Gaussian weighted integral. The respective results are presented as two propositions: Proposition 4.1: Let the radial integral be computed numer-point Gaussian quadrature rule ically by theLet the spherical integral be computed numerically by the -point spherical ruleThen, an by-point spherical-radial cubature rule is given(34) Proof: Because cubature rules are devised to be exact for a subspace of monomials of some degree, we consider an integrand of the form(32)1260IEEE TRANSACTIONS ON AUTOMATIC CONTROL, VOL. 54, NO. 6, JUNE 2009where are some positive integers. Hence, we write the integral of interestwhereFor the moment, we assume the above integrand to be a mono. Making the mial of degree exactly; that is, change of variable as described in Section IV-A, we getWe use the cubature-point set to numerically compute integrals (10), (11), and (13)–(16) and obtain the CKF algorithm, details of which are presented in Appendix A. Note that the above cubature-point set is now defined in the Cartesian coordinate system. V. IS THERE A NEED FOR HIGHER-DEGREE CUBATURE RULES? In this section, we emphasize the importance of third-degree cubature rules over higher-degree rules (degree more than three), when they are embedded into the cubature Kalman filtering framework for the following reasons: • Sufficient approximation. The CKF recursively propagates the first two-order moments, namely, the mean and covariance of the state variable. A third-degree cubature rule is also constructed using up to the second-order moment. Moreover, a natural assumption for a nonlinearly transformed variable to be closed in the Gaussian domain is that the nonlinear function involved is reasonably smooth. In this case, it may be reasonable to assume that the given nonlinear function can be well-approximated by a quadratic function near the prior mean. Because the third-degree rule is exact up to third-degree polynomials, it computes the posterior mean accurately in this case. However, it computes the error covariance approximately; for the covariance estimate to be more accurate, a cubature rule is required to be exact at least up to a fourth degree polynomial. Nevertheless, a higher-degree rule will translate to higher accuracy only if the integrand is well-behaved in the sense of being approximated by a higher-degree polynomial, and the weighting function is known to be a Gaussian density exactly. In practice, these two requirements are hardly met. However, considering in the cubature Kalman filtering framework, our experience with higher-degree rules has indicated that they yield no improvement or make the performance worse. • Efficient and robust computation. The theoretical lower bound for the number of cubature points of a third-degree centrally symmetric cubature rule is given by twice the dimension of an integration region [34]. Hence, the proposed spherical-radial cubature rule is considered to be the most efficient third-degree cubature rule. Because the number of points or function evaluations in the proposed cubature rules scales linearly with the dimension, it may be considered as a practical step for easing the curse of dimensionality. According to [35] and Section 1.5 in [18], a ‘good’ cubature rule has the following two properties: (i) all the cubature points lie inside the region of integration, and (ii) all the cubature weights are positive. The proposed rule equal, positive weights for an -dimensional entails unbounded region and hence belongs to a good cubature family. Of course, we hardly find higher-degree cubature rules belonging to a good cubature family especially for high-dimensional integrations.Decomposing the above integration into the radial and spherical integrals yieldsApplying the numerical rules appropriately, we haveas desired. As we may extend the above results for monomials of degree less than , the proposition holds for any arbitrary integrand that can be written as a linear combination of monomials of degree up to (see also [18, Section 2.8]). Proposition 4.2: Let the weighting functions and be and . such that , we Then for every square matrix have (35) Proof: Consider the left-hand side of (35). Because a positive definite matrix, we factorize to be , we get Making a change of variable via is .which proves the proposition. For the third-degree spherical-radial rule, and . Hence, it entails a total of cubature points. Using the above propositions, we extend this third-degree spherical-radial rule to compute a standard Gaussian weighted integral as follows:ARASARATNAM AND HAYKIN: CUBATURE KALMAN FILTERS1261In the final analysis, the use of higher-degree cubature rules in the design of the CKF may marginally improve its performance at the expense of a reduced numerical stability and an increased computational cost. VI. SQUARE-ROOT CUBATURE KALMAN FILTER This section addresses i) the rationale for why we need a square-root extension of the standard CKF and ii) how the square-root solution can be developed systematically. The two basic properties of an error covariance matrix are i) symmetry and ii) positive definiteness. It is important that we preserve these two properties in each update cycle. The reason is that the use of a forced symmetry on the solution of the matrix Ricatti equation improves the numerical stability of the Kalman filter [36], whereas the underlying meaning of the covariance is embedded in the positive definiteness. In practice, due to errors introduced by arithmetic operations performed on finite word-length digital computers, these two properties are often lost. Specifically, the loss of the positive definiteness may probably be more hazardous as it stops the CKF to run continuously. In each update cycle of the CKF, we mention the following numerically sensitive operations that may catalyze to destroy the properties of the covariance: • Matrix square-rooting [see (38) and (43)]. • Matrix inversion [see (49)]. • Matrix squared-form amplifying roundoff errors [see (42), (47) and (48)]. • Substraction of the two positive definite matrices present in the covariant update [see (51)]. Moreover, some nonlinear filtering problems may be numerically ill-conditioned. For example, the covariance is likely to turn out to be non-positive definite when i) very accurate measurements are processed, or ii) a linear combination of state vector components is known with greater accuracy while other combinations are essentially unobservable [37]. As a systematic solution to mitigate ill effects that may eventually lead to an unstable or even divergent behavior, the logical procedure is to go for a square-root version of the CKF, hereafter called square-root cubature Kalman filter (SCKF). The SCKF essentially propagates square-root factors of the predictive and posterior error covariances. Hence, we avoid matrix square-rooting operations. In addition, the SCKF offers the following benefits [38]: • Preservation of symmetry and positive (semi)definiteness of the covariance. Improved numerical accuracy owing to the fact that , where the symbol denotes the condition number. • Doubled-order precision. To develop the SCKF, we use (i) the least-squares method for the Kalman gain and (ii) matrix triangular factorizations or triangularizations (e.g., the QR decomposition) for covariance updates. The least-squares method avoids to compute a matrix inversion explicitly, whereas the triangularization essentially computes a triangular square-root factor of the covariance without square-rooting a squared-matrix form of the covariance. Appendix B presents the SCKF algorithm, where all of the steps can be deduced directly from the CKF except for the update of the posterior error covariance; hence we derive it in a squared-equivalent form of the covariance in the appendix.The computational complexity of the SCKF in terms of flops, grows as the cube of the state dimension, hence it is comparable to that of the CKF or the EKF. We may reduce the complexity significantly by (i) manipulating sparsity of the square-root covariance carefully and (ii) coding triangularization algorithms for distributed processor-memory architectures. VII. A COMPARISON OF UKF WITH CKF Similarly to the CKF, the unscented Kalman filter (UKF) is another approximate Bayesian filter built in the Gaussian domain, but uses a completely different set of deterministic weighted points [10], [39]. To elaborate the approach taken in the UKF, consider an -dimensional random variable having with mean and covariance a symmetric prior density , within which the Gaussian is a special case. Then a set of sample points and weights, are chosen to satisfy the following moment-matching conditions:Among many candidate sets, one symmetrically distributed sample point set, hereafter called the sigma-point set, is picked up as follows:where and the -th column of a matrix is denoted ; the parameter is used to scale the spread of sigma points by from the prior mean , hence the name “scaling parameter”. Due to its symmetry, the sigma-point set matches the skewness. Moreover, to capture the kurtosis of the prior density closely, it is sug(Appendix I of [10], gested that we choose to be [39]). This choice preserves moments up to the fifth order exactly in the simple one-dimensional Gaussian case. In summary, the sigma-point set is chosen to capture a number as correctly as of low-order moments of the prior density possible. Then the unscented transformation is introduced as a method that are related to of computing posterior statistics of by a nonlinear transformation . It approximates the mean and the covariance of by a weighted sum of projected space, as shown by sigma points in the(36)(37)。
李政道诺贝尔领奖辞lee-lecture.pdf
The interactions (not including the gravitational forces) between these par-ticles can be classified into three distinct groups:1. Strong Interactions. This group is responsible for the production and thescattering of nucleons, pions, hyperons (i.e. etc.) and K mesons. It ischaracterized by a couplinggC> = (1/137).3.Weak Interactions. This group includes all known non-electromagnetic de-cay interactions of these elementary particles and the recently observed ab-sorption process of neutrinoes by nucleons2.These interactions are charac-terized by coupling constants1957 T.D.L E EFig. 2.YThe law of conservation of parity is valid for both the strong and the elec-tromagnetic interactions but is not valid for the weak interactions. Today’s discussions will be mainly on the recently observed effects of nonconserva-tion of parity in the various weak interactions.IIThe weak interactions cover a large variety of reactions. At present there are about 20 known phenomenologically independent reactions ranging from the decay of various hyperons to the decay of light particles. Within the last year, many critical experiments have been performed to test the validity of the law of conservation of parity in these reactions. We shall first summarize the experimental results together with their direct theoretical implications.Next, we shall discuss some further possible consequences and theoretical considerations.W E A K I N T E R A C T I O N S A N D P A R I T Y M i r r o r r e f l e c t i o n409Fig. 3.(1)emitted, differentiates in a mostdirect way a right-handed system from a left-handed system. Thus the non-conservation of parity or the non-invariance under a mirror reflection can be established without reference to any theory.Furthermore from the large amount of angular asymmetry observed itcan also be established 4that the (1)in which each particle is described by a quantized wave equation. In partic-ular the neutrino is described by the Dirac equation6are the four (4 × 4)anti-commuting Dirac matrices and= ict are the four space-time coordinates. For each given mo-mentum there exists two spin states for the neutrino and two spin states for the anti-neutrino. These may be denoted by If we define thehelicity H to bewith the unit vector along the momentum direc-tion, then these four states have, respectively, helicities equal to + I, - I, -I and + I (Fig. 4). M a thand a left-handed part=(6)andIt is easy to see that both separately satisfy the Dirac equationt s ecomposition the β process of a nucleus A can be rep-[Eq. (2)]. With hi dresented schematically asFig. 4.and and+(7’)(8’)with as the corresponding amplitudes for emission ofUnder the charge conjugation operator we change a particle to its anti-particle but we do not change its spatial or spin wave functions. Conse-quently it must have the same helicity. Thus, if the β-decay process is in-variant under the charge conjugation operator, then we should expect pro-cess (7) to proceed with the same amplitude as process (8’). The condition for invariance under charge conjugation is, thenz (9)for all i = S, T, V, P, A.In the decay of 60Co, because there is a difference of spin values between 6O Co and 60Ni, only the terms i = T and i = A contribute. From the large angular-asymmetry observed it can be safely concluded that for bot h i = T, Awhich contradicts Eq. (9)and proves the non-invariance of β-interaction under charge conjugation. For illustration purposes, we assume in the abovethe neutrino to be described by a 4-component theory and further we assume that in the412 1957T.D.L E ERecently many more experiments7 have been performed on the longi-tudinal polarization of electrons and positrons, th e β−γ, correlation together with the circular polarization of the γ radiation and the β angular distribu-tion with various polarized nuclei other than 60Co. The results of all these experiments confirm the main conclusions of the first 60Co experiment, that both the parity operator and the charge conjugation operator are not con-served in β-decay processes.Another interesting question is whether the β-decay interaction is invariant under the product operation of (charge conjugation x mirror reflection). Under such an operation we should compare the decay of A with that ofa n dd e c a yThe π± meson decays into a µ± meson and a neutrino. The µ± meson, in turn, decays into an e± and two neutrinoes (or anti-neutrinoes). If parity is not conserved in π-decay, the µ meson emitted could be longitudinally po-Fig. 5.WEAK INTERACTIONS AND PARITY413 larized. If in the subsequentmeson (Fig. 5). Consequently in themeson measured in the rest system of measured in the restsystem ofThe experimental results8 on these angular correlations appeared within a few days after the results onLater, direct measurements9 on the longitudinal polarization of the posi-tron fromdecayIn this case we have instead of themeson and a neutrino (Fig. 6). Experiment10 on the angular correlation between theestablishes that in K-decay the par-ity as well as the charge conjugation operator is not conserved.(4)on proton. TheFig. 6.subsequently decays into a proton plus aπ− (Fig. 7). The observation of an a symmetrical distribution with respect to the sign of the product(Ginx the mo-mentum of the lambda particle,,,,,and that of the decay pionandFurthermore, from the amount of the large up-down asymmetry it can be concluded that the Λο-decay interaction is also not invariant under the charge conjugation operation.From all these results it appears that the property of nonconservation of parity in the variou s weak interactions and the noninvariance property of these interactions under charge conjugation are well established. In connec-tion with these properties we find an entirely new and rich domain of nat-ural phenomena which, in turn, gives us new tools to probe further into the structure of our physical world. These interactions offer us natural ways to polarize and to analyze the spins of various elementary particles. Thus, for example, the magnetic moment of the µ meson can now be measured to an extremely high degree of accuracy12which, otherwise, would be unattain-W E A K I N T E R A C T I O N S A N D P A R I T Y415 able; the spins of some hyperons now may perhaps be determined13 un-ambiguously through the observed angular asymmetries in their decays; new aspects of the electromagnetic fields of various gas, liquid and solid materials can now be studied by using these unstable, polarized particles. However, perhaps the most significant consequences are the opening of new possibil-ities and the re-examination of our old concepts concerning the structure of elementary particles. We shall next discuss two such considerations - the two-component theory of neutrino, and the possible existence of a law of con-servation of leptons.IIIBefore the recent developments on nonconservation of parity, it was cus-tomary to describe the neutrino by a four-component theory in which, as we mentioned before, to each definite momentum there are the two spin states of the neutrino plus the two spin states of the antineutrinoIn the two-component theory, however, we assume two of thesestates, say, simply do not exist in nature. The spin of the neutrinois then always parallel to its momentum while the spin of the antineutrino is always antiparallel to its momentum. Thus in the two-component theory we have only half of the degrees of freedom as in the four-component the-ory. Graphically we may represent the spin and the velocity of the neutrino by the spiral motion of a right-handed screw and that of the antineutrino by the motion of a left-handed screw (Fig. 8).The possibility of a two-component relativistic theory of a spin ½ particle was first discussed by H. Weyl14 as early as 1929. However, in the past, be-cause parity is not manifestly conserved in the Weyl formalism, it was always rejected15.With the recent discoveries such an objection becomes com-pletely invalid16.To appreciate the simplicity of this two-component theory in the present situation it is best if we assume further the existence of a conservation law for leptons17. This law is in close analogy with the corresponding conserva-tion law for the heavy particles. We assign to each lepton a leptonic num-ber l equal to +1or -1and to any other particle the leptonic number zero. The leptonic number for a lepton must be the negative of that for its antiparticle. The law of conservation of leptons then states that « in all physical processes the algebraic sum of leptonic numbers must be con-served ».W E A K I N T E R A C T I O N S A N D P A R I T Y417 two-component theory we have to investigate in detail all the neutrino pro-cesses. For example inor4181957T.D.L E E1. C. N. Yang, Nobel Lecture, this volume, p. 393.2. C. L. Cowan, Jr., F. Rines, F. B. Harrison, H. W. Kruse, and A. D. McGuire,Science, 124 (1956) 103.3. C. S. Wu, E. Ambler, R. W. Hayward, D. D. Hoppes, and R. P. Hudson,Phys.Rev., 105 (1957) 1413.4. T. D. Lee, R. Oehme, and C. N. Yang, Phys. Rev., 106 (1957) 340; B. L. Ioffe, L.B. Okun, and A. P. Rudik, J.E.T.P. (U.S.S.R.), 32 (1957) 396.5. We remark here that if the neutrino is described by a two-component theory (seeSection III) then the result of the large angular asymmetry in60Co decay estab-lishes in a trivial way the non-Invariance property of β-decay under the charge conjugation operation. However, this non-invariance property can also be provedunder a much wider framework. In this section we take as an example the case ofa four-component theory of neutrino to illustrate such a proof6.For notations and definitions of γmatrices see, e.g., W. Pauli,Handbuch der Physik,Julius Springer Verlag, Berlin, 1933, Vol. 24.7. For a summary of these experiments see, e.g., Proceedings of the Seventh AnnualRochester Conference,Interscience, New York, 1957.8. R. L. Garwin, L. M. Lederman, and M. Weinrich,Phys. Rev., 105 (1957) 1415;J. I. Friedman and V. L. Telegdi,Phys. Rev., 105 (1957) 1681.9. G. Culligan, S. G. F. Frank, J. R. Holt, J. C. Kluyver, and T. Massam, Nature, 180(1957) 751.10. C. A. Coombes, B. Cork, W. Galbraith, G. R. Lambertson, and W. A. Wenzel,Phys. Rev., 108 (1957) 1348.11. J. Crawford, et. al., Phys. Rev., 108 (1957) 1102; F. Eisler et al.,Phys. Rev., 108(1957) 1353; R. Adair and L. Leipuner, Phys. Rev., (to be published).12. T. Coffin, R. L. Garwin, L. M. Lederman, S. Penman, and A. M. Sachs, Phys.Rev., 107 (1957) 1108.13. T. D. Lee and C. N. Yang, Phys. Rev., 109 (1958) 1755.14. H. Weyl, Z. Physik, 56 (1929) 330.15. Cf. W. Pauli, Handbuch der Physik, Julius Springer Verlag, Berlin, 1933, Vol. 24,pp. 226-227.16. The possible use of a two-component theory for expressing the nonconservationproperty of parity in neutrino processes was independently proposed and dis-cussed by T. D. Lee and C. N. Yang, Phys. Rev., 105 (1957) 1671; A. Salam, Nuovo Cimento, 5 (1957) 299; and L. Landau,Nucl. Phys., 3 (1957)127.17. The possible existence of a conservation law for leptons has been discussed beforethe discovery of nonconservation of parity. Cf. E. Konopinski and H. M. Mah-moud, Phys. Rev., 92 (1953) 1045.。
- 1、下载文档前请自行甄别文档内容的完整性,平台不提供额外的编辑、内容补充、找答案等附加服务。
- 2、"仅部分预览"的文档,不可在线预览部分如存在完整性等问题,可反馈申请退款(可完整预览的文档不适用该条件!)。
- 3、如文档侵犯您的权益,请联系客服反馈,我们会尽快为您处理(人工客服工作时间:9:00-18:30)。
Evidences of spatial (angular)filtering of sound beams by soniccrystalsR.Picóa ,⇑,I.Pérez-Arjona a ,V.J.Sánchez-Morcillo a ,K.Staliunas ba Instituto de Investigación para la Gestión Integrada de Zonas Costeras,Universidad Politécnica de Valencia,Paranimf 1,46730Grao de Gandia,Spain bICREA,Departament de Fisica i Enginyeria Nuclear,Universitat Politècnica de Catalunya,Colom,11,E-08222Terrassa,Barcelona,Spaina r t i c l e i n f o Article history:Received 16January 2012Received in revised form 24December 2012Accepted 7January 2013Keywords:Spatial filtering Sonic crystala b s t r a c tWe report experimental evidences of spatial (angular)filtering of sound beams propagating through sonic crystals.We show that at specific frequencies of the incident wave the paraxial plane wave compo-nents of the beam can be efficiently transmitted through the crystal,whereas the components propagat-ing at large angles are strongly reflected or deflected (filtered out)by the crystal.The modification of the angular field distribution results in formation of sound beams of relatively high spatial quality.Ó2013Elsevier Ltd.All rights reserved.1.IntroductionIt is known that transmission of waves through spatially modu-lated materials,where the modulation period is of the order of magnitude of the wavelength (photonic crystals in optics,sonic or phononic crystals in acoustics)can be sensible to the direction of propagation.Modulated materials can be transparent for the waves propagating along one direction,but can be strongly reflect-ing or deflecting for the waves of the same frequency but propagat-ing at other angles.The material can be strongly anisotropic,or in other words,can show angular band-gaps.An idea has been re-cently proposed in optics,that the angular sensitivity of wave transmission could be utilized for spatial filtering of monochro-matic wave beams [1–4].The proposals are based on the observa-tion that the modulation of the material can be chosen so,that the paraxial plane wave components (those forming small angles to the beam axis)can propagate through the material,but non-parax-ial components (those forming larger angles to the beam axis)can be efficiently reflected or deflected.This results in narrowing of the angular distribution (spatial spectrum)of the beam,and leads to low-pass angular filtering.The phenomenon of spatial filtering is analogous to the well known effect of frequency filtering in one-dimensionally modulated materials,which is based on the exis-tence of frequency band-gaps.The wave components with the fre-quencies within the propagation bands can be transmitted through,whereas the frequencies in band-gaps experience strong reflection from such band-gap materials.The frequency band-gaps have been extensively studied in optics,for photonic crystals [5],and more recently in acoustics,for sonic crystals (SC)[6].We note that one-dimensional modulation (i.e.the layering)is sufficient for the observation of frequency band-gaps,therefore is also sufficient for realization of the frequency filtering.The spatial filtering is possible only for materials with two-or three-dimensional modulation in space.After the theoretical pro-posals [1–4]some experimental evidences of spatial filtering have been reported in optics,for photonic crystals [7].The spatial filter-ing has been also proposed for matter waves (Bose-Einstein con-densates in spatially and temporally modulated potentials)[8].Recently the spatial filtering has been theoretically predicted in acoustics,for two-dimensional sonic crystals of rhombic symmetry [9].Here we demonstrate experimentally the spatial filtering phe-nomenon in acoustics for the first time.Differently from the theo-retical predictions in [9]we consider in this work a square geometry of the crystal.Differently from the experimental demon-stration in optics [7]the effect in acoustics is very strong:a sub-stantial portion of off-axis radiation can be filtered-out from the beam.In the present letter we show,that the effect of spatial filter-ing can be efficient enough,and can be utile for cleaning the spatial structure of the beam,i.e.for formation of high spatial quality beams from the low quality sources.2.Experimental setupThe experimental scheme used to demonstrate the spatial filter-ing is shown in Fig.1.The SC is a matrix of 9Â10cylindrical (methacrylate)scatterers of radius r =1cm,in square lattice with lattice constant a =4.7cm,surrounded by air.The Bragg frequency for the given geometry,i.e.the frequency corresponding to the cen-ter of the first bang-gap,is f b =c /2a =3600Hz,c being the sound velocity in air.The filling fraction of the crystal f ¼p ðr =a Þ2¼0:14was chosen relatively small in order to keep the transmittance0003-682X/$-see front matter Ó2013Elsevier Ltd.All rights reserved./10.1016/j.apacoust.2013.01.003Corresponding author.E-mail address:rpico@fis.upv.es (R.Picó).high.The experiment was performed inside an anechoic chamber,in order to avoid undesired sound reflections from the room walls.The emitter was a broad band loudspeaker emitting white noise,and the receiver was a microphone mounted on a rotating axis controlled by a robot.The fast Fourier transformation was com-puted from the signals in time domain recorded by a microphone in order to get the frequency spectra.The frequency resolution is 1/48th of the central frequency of the band,and the angular preci-sion was the robot rotation step (D h =2.5°).Measurements cov-ered the range from 0°to 180°(not all 360°because of the symmetry of the system).That makes in total the measurement at 73scattering angles.3.Band structure and isofrequency contoursA theoretical analysis was performed for the parameters cor-responding to the experimental setup.Angular gaps are most clearly evidenced by calculating and plotting the dispersion dia-grams by plane wave expansion method [10],and plotting the isofrequency contours in k space.Fig.2shows the band struc-ture in standard C XM C representation [2(a)],and the isofre-quency contours [2(b)and 2(c)]at two frequencies where the spatial filtering is expected.The x (k )dispersion curves in Fig.2a show the frequency band-gaps.For a low filling factor considered here,only a partial gap (fre-quency gap for some particular directions)is obtained.Close to the top of the bands (in the case shown in Fig.2,close to the top of the second band)the isofrequency contours are strongly distorted with respect to those in homogeneous space (the concentric circles).It is known that the isofrequency contours can show flat segments at particular frequencies,which are at the basis of the self-collima-tion theoretically predicted [11]and experimentally observed [12]for the SCs.For larger frequencies,the dispersion lines with positive sign of curvature appear around the X -point,responsible for the negative diffraction.However between the isofrequency curve in the second band (around the X -point)and strongly curved isofrequency lines in the third band,the angular band-gaps appear,as indicated by the shadowed areas in Fig.2b and c:the plane wave components at corresponding angles cannot propagate and are re-flected back or deflected.The position and width of the angular band-gaps depends on the frequency as Fig.2b and c evidence.The angular band-gaps are at the basis of the spatial filtering and cleaning of beams.For initially broad beams,with relatively narrow angular spectrum,the spatial filtering effect would result in a nar-rowing of the far field distributions of the beams.For narrow beams,with relatively broad angular spectrum,the filtering could result in depletion of particular angular ranges of the spatial spectra.The predictions by the plane wave expansion have been checked by numerical simulation of the beam propagation through the SC using the finite element method [13].The domain of the model is bounded (absorbing boundaries)at a distance corre-sponding to the measurement positions in the experimental set-up.The acoustic excitation has been introduced in the model as a Gaussian profile for the pressure in the form p (y )=exp(Ày 2/r 2),where r is related with the width of the source.In all simulations in this work r =0.01m.Due to extremely high contrast of acoustic impedance between material and air,all the scatters have been considered as rigid.A Perfectly Matched Layer (PML)has been used at the external bounds of the domain in order to avoid undesired reflections.The hardware used for the simulations is a Fujitsu Cel-sius R670-2with 24cores,48G,which resulted in computational time for one frequency excitation less than 5s.The computation time for the complete model is less than 1min.4.Numerical resultsThe results are summarized in Fig.3,which shows the angular distributions of the sound (horizontal axis)versus the frequency (vertical axis)in Fig.3a,and also the spatial distribution of the sound intensity in the beams at particular frequencies,behind the crystal Fig.3b–e.For comparison,in order to highlight the fil-tering effect of the crystal,also the distributions of the field dif-fracted by a rigid block with the size of the SC,also the freely propagating beam are shown in Fig.3f and g respectively.The frequency was varied in a broad range,covering several fre-quency band-gaps and also covering the expected area of spatial filtering (as following from the analysis of the spatial dispersion curves presented above).For low frequencies f <f b ,well below the first band-gap in the considered C X direction,the sound field spread strongly.The spatial structure of the crystal is ‘‘invisible’’,i.e.the sound waves propagate in the crystal as in a homogeneous medium with effective parameters (the so-called homogenization limit).For frequencies corresponding to the second propagation band the angular transmission spectrum becomes very sensitive to the frequency and the angular band-gaps appear at particular directions (see e.g.the field plot for f =4.5kHz).At the top of the second band,according to the spatial dispersion diagrams,the expected effect of spatial filtering is observed (see field plots for(C)X(B)(A)(c) (b)946R.Picóet al./Applied Acoustics 74(2013)945–948different frequencies,Fig.3c and e.Increasing the frequency the transmission angle decreases,and the beam well behind the SC becomes narrower.For higher frequencies,Bloch modes from the third and higher propagation bands come into play.The spatial filtering is possible only for the beams of relatively narrow angular spectrum.For beams with broad angular spectrum depletion appears in the transmitted angular spectrum,and no‘‘clean’’low-pass angularfiltering is possible.5.Experimental resultsThe experimental measurements were performed under condi-tions corresponding to those used in the numerical simulations. The results are shown in Fig.4,which are directly comparable with the theoretical ones in Fig.3.Thefield angular distributions for varying frequency were experimentally recorded,showing agree-ment with the corresponding numerical simulations results shownin Fig.3.Due to the mirror symmetry of the experimental set-up, the measurements were performed only in a half hemispace(from 0°to90°),and thefigure was completed with its mirror image in order to have a straightforward comparison with the results in Fig.3.Fig.4b–d shows the angular soundfield distribution at a distance R=1m from the output face of the SC at the particular frequencies f=5158,5543and6043Hz(solid lines),and illustrate the spatialfiltering effects in propagation through the SC.The spa-tiallyfiltered angular regions are shaded.In all cases,the transmis-sion through the crystal is compared with the free propagation (shown by dashed line).Note that for instance,the beam shown in Fig.4b presents aÀ30dB minimum at30°.Thisfiltering angle defines the separation between the central beam and side lobes.Fig.3.(a)Farfield(angular)distributions of the amplitude of the sound beam transmitted through the crystal,as obtained by FEM numerical simulations in terms the input frequency.Fig.(b–e)shows the spatial sound distribution at the indicated frequencies.The parameters are as in Fig.2.6.ConclusionWe report thefirst experimental demonstration of spatialfilter-ing of sound beams in acoustics,using the SCs as a low-angle-pass spatialfilter.We support the experimental measurements by numerical simulations.The result could be of technological utility in applied acoustics, since beams of good spatial quality are desired for numerous appli-cations.High quality beams are of lower propagation divergence, and can be focused into a tighter spot.They present also reduced side-lobes(or no side-lobes in an ideal case).All these properties improve the performance of ultrasonic applications(medical,as surgery or imaging,or non-destructive testing).We demonstrate, as a prototype,the formation of a beam of a good spatial quality, which is obtained from a source with a really‘‘bad’’angular distri-bution of the emission.The formation of a good spatial quality beam is possible in a narrow frequency range for a particular SC(withfixed parameters such asfilling factor and geometry).Then particular angular areas arefiltered out from the angular spectrum of the source.If the source has a too broad angular spectrum(significantly broader than the angular band-gaps)then multiplefiltering is possible by a serial propagation through two or several SCfilters.Also chirped SCs could be used,where the longitudinal period or/andfilling fac-tor varies continuously along the SC.The study offiltering by chirped SCs is in progress.The phenomenon has been demonstrated for two-dimensional SCs.However the band calculation of the three-dimensional SCs shows the existence of the two-dimensional angular band-gaps, as well as full two-dimensional self-collimation of the beams [14].This envisages the possibility of the full two-dimensional spatialfiltering with three-dimensional SCs,which could be highly utile in technological applications.The corresponding experiments are in advance.AcknowledgementsThe work wasfinancieall supported by Spanish Ministry of since and Innovation and European Union FEDER through projects FIS2011-29731-C02-01and-02,Generalitat Valenciana through the procect GV/2011/2055and the UPV through PAID-05-12. References[1]Lee YJ,Yeo J,Mittra R,Park WS.IEEE Trans.Antennas Propag.2005;53:224.[2]Staliunas K,Sánchez-Morcillo VJ.Phys.Rev.A2009;79:053807.[3]Serebryannikov AE,Petrov AY,Ozbay E.Appl.Phys.Lett.2009;94:181101.[4]Colak E,Cakmak AO,Serebryannikov AE,Ozbay E.J.Appl.Phys.2010;108:113106.[5]Yablonovitch E.Phys.Rev.Lett.1987;58:2059;John S.Phys.Rev.Lett.1987;58:2486.[6]Sánchez-Pérez JV,Caballero D,Martínez-Sánchez R,Rubio C,Sánchez-Dehesa J,Meseguer F,et al.Phys.Rev.Lett.1998;80:5325.[7]Maigyte L,Gertus T,Peckus M,Trull J,Cojocaru C,Sirutkaitis V,et al.Phys.Rev.A2010;82:043819.[8]Staliunas K.Phys.Rev.A2011;84:013626.[9]PicóR,Sánchez-Morcillo VJ,Pérez-Arjona I,Staliunas K.Appl.Acoustics2012;73:302.[10]Kushwaha MS,Halevi P.Appl.Phys.Lett.1996;69:31.[11]Pérez-Arjona I,Sánchez-Morcillo VJ,Redondo J,Espinosa V,Staliunas K.Phys.Rev.B2007;75:014304.[12]Espinosa V,Sánchez-Morcillo VJ,Staliunas K,Pérez-Arjona I,Redondo J.Phys.Rev.B2007;76:140302.R.[13]The commercial package COMSOL Multiphysics3.3a was used.[14]Soliveres E,Espinosa V,Pérez-Arjona I,Sánchez-Morcillo VJ,Staliunas K.Appl.Phys.Lett.2009;94:164101.948R.Picóet al./Applied Acoustics74(2013)945–948。