正官庄的品牌资质分析报告
正官庄高丽参的品牌介绍

正官庄高丽参的品牌介绍正官庄,是一个韩国高丽参的品牌老字号,从1899年创立人参专卖以来,已经有一百多年的历史,曾经历专卖厅、韩国烟草人参公社、韩烟人参股份等的时代。
下面一起看下正官庄高丽参的品牌介绍。
品牌愿景韩国人参公社一路走来的发展道路,充满着红参的香气。
依靠传承着100多年的制作秘方,通过为期六年的栽培合同确保原料的稳定且高的品质;适用在每一道产品的制作流程确保品质安全性;多达730多家的正官庄连锁加盟店;致力于红参功效及产品开发的研究等,韩国人参公社名副其实地成长为了代表大韩民国的健康食品企业。
借助红参事业的发展,韩国人参公社通过“愿景2015”开始向着实现国际综合健康企业大步进发。
“愿景2015”即是韩国人参公社全新的里程碑,它包括通过实现世界第一的红参企业,韩国健康食品事业的领军企业,进军健康服务事业等,成为名副其实的国际综合健康企业。
◦在充满红参气息的韩国人参公社的发展历程中,以健康为主题,添加更加丰富多彩的浓郁香气的“愿景2015”,约定为人类带来更加健康的未来。
名品品牌“正官庄”是秉持透彻的匠人精神而成就的名健康食品。
正官庄蕴含着体现100多年的制作秘方和数千年以来高丽参名誉的名品精神。
如今,正官庄名列健康食品知名度第一位那么耀眼。
严格遴选优秀的六年根新鲜人参,通过蒸汽蒸参之后,经过干燥过程,将水分含量控制在14%以下,如此加工而成的正官庄红参以优秀的品质和功效自豪。
正官庄的价值不仅在韩国国内得到认可,而且在海外也备受肯定,比如在台湾、日本、中国、美国等世界60多个国家和地区公认为是“韩国名品”。
正官庄怀着灵魂和热情的匠人精神,是世界级的名品品牌。
正官庄是拥有远大梦想的韩国人参公社的无限可能性和希望。
安全性韩国人参公社获得的名声得益于建立在不断的研究开发上实现的产品安全性。
为了产品的安全性和功效的极大化,韩国人参公社在研究开发上投入了巨大的精力,仅2009年就投入了115亿韩元的研究开发费用,平均每年销售额的2%都用于研究开发上。
韩国KT&G研究报告
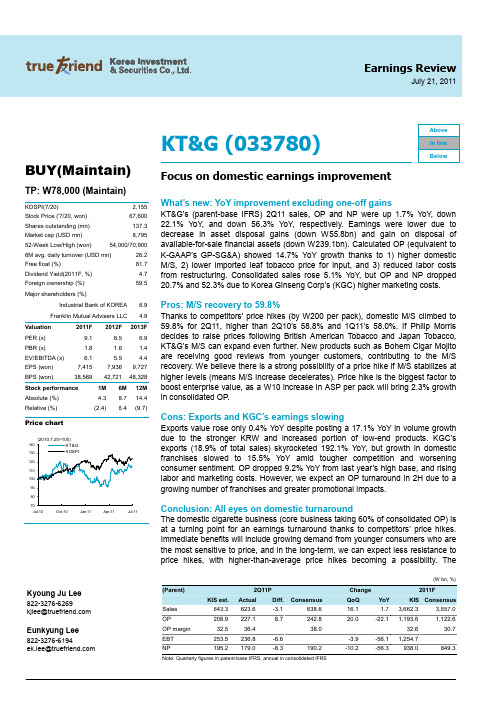
Earnings ReviewJuly 21, 2011AboveKT&G (033780)BUY(Maintain)TP: W78,000 (Maintain)KOSPI(7/20) Stock Price ('7/20, won) Shares outstanding (mn) Market cap (USD mn) 52-Week Low/High (won) Free float (%) Dividend Yield(2011F, %) Foreign ownership (%) Major shareholders (%) Industrial Bank of KOREA Franklin Mutual Advisers LLC Valuation PER (x) PBR (x) EV/EBITDA (x) EPS (won) BPS (won) 2011F 9.1 1.8 6.1 7,415 38,569 2012F 8.5 1.6 5.5 7,936 42,721 1M 4.3 (2.4) 6M 8.7 6.4 6.9 4.9 2013F 6.9 1.4 4.4 9,727 48,328 12M 14.4 (9.7) 6M avg. daily turnover (USD mn) 2,155 67,600 137.3 8,795 54,000/70,900 26.2 81.7 4.7 59.5In line BelowFocus on domestic earnings improvementWhat’s new: YoY improvement excluding one-off gainsKT&G’s (parent-base IFRS) 2Q11 sales, OP and NP were up 1.7% YoY, down 22.1% YoY, and down 56.3% YoY, respectively. Earnings were lower due to decrease in asset disposal gains (down W55.8bn) and gain on disposal of available-for-sale financial assets (down W239.1bn). Calculated OP (equivalent to K-GAAP’s GP-SG&A) showed 14.7% YoY growth thanks to 1) higher domestic M/S, 2) lower imported leaf tobacco price for input, and 3) reduced labor costs from restructuring. Consolidated sales rose 5.1% YoY, but OP and NP dropped 20.7% and 52.3% due to Korea Ginseng Corp’s (KGC) higher marketing costs.Pros: M/S recovery to 59.8%Thanks to competitors’ price hikes (by W200 per pack), domestic M/S climbed to 59.8% for 2Q11, higher than 2Q10’s 58.8% and 1Q11’s 58.0%. If Philip Morris decides to raise prices following British American Tobacco and Japan Tobacco, KT&G’s M/S can expand even further. New products such as Bohem Cigar Mojito are receiving good reviews from younger customers, contributing to the M/S recovery. We believe there is a strong possibility of a price hike if M/S stabilizes at higher levels (means M/S increase decelerates). Price hike is the biggest factor to boost enterprise value, as a W10 increase in ASP per pack will bring 2.3% growth in consolidated OP.Stock performance Absolute (%) Relative (%)Price chart(2010.7.20=100) 140 KT&G KOSPI 130120 110 100 90 80 70 Jul-10 Oct-10 Jan-11 Apr-11 Jul-11Cons: Exports and KGC’s earnings slowingExports value rose only 0.4% YoY despite posting a 17.1% YoY in volume growth due to the stronger KRW and increased portion of low-end products. KGC’s exports (18.9% of total sales) skyrocketed 192.1% YoY, but growth in domestic franchises slowed to 15.5% YoY amid tougher competition and worsening consumer sentiment. OP dropped 9.2% YoY from last year’s high base, and rising labor and marketing costs. However, we expect an OP turnaround in 2H due to a growing number of franchises and greater promotional impacts.Conclusion: All eyes on domestic turnaroundThe domestic cigarette business (core business taking 60% of consolidated OP) is at a turning point for an earnings turnaround thanks to competitors’ price hikes. Immediate benefits will include growing demand from younger consumers who are the most sensitive to price, and in the long-term, we can expect less resistance to price hikes, with higher-than-average price hikes becoming a possibility. The(W bn, %)Kyoung Ju Lee822-3276-6269 kjlee@(Parent) KIS est. Sales OP OP margin EBT NP 643.3 208.9 32.5 253.5 195.22Q11P Actual 623.6 227.1 36.4 236.8 179.0 -6.6 -8.3 190.2 Diff. -3.1 8.7 Consensus 638.6 242.8 38.0Change QoQ 16.1 20.0 -3.9 -10.2 YoY 1.7 -22.1 -56.1 -56.3 3,662.3 1,193.6 32.6 1,254.7 938.02011F KIS Consensus 3,657.0 1,122.6 30.7 849.3Eunkyung Lee822-3276-6194 ek.lee@Note: Quarterly figures in parent-base IFRS, annual in consolidated IFRSKT&G (033780)2011F consolidated PER stands at 9.1x, lower than the 2011F market average and global peer average of 11.0x and 14.9x respectively. Considering the high ROE (2011F 19.7%) and 2011-2013 EPS CAGR of 14.5%, which is above the market and global peer average, we believe the stock is undervalued. If price hike does take place, resulting in upward earnings, valuation merits will be greater.2Q11P preliminary results (Non-consolidated, K-IFRS)2Q11P Sales Gross profit Other profit SG&A Other OP EBT NP COGS-to-sales SG&A-to-sales OP margin EBT margin NP margin 623.6 382.5 4.9 145.1 15.2 227.1 236.8 179.0 38.7 23.3 36.4 38.0 28.7 2Q10 613.2 368.7 90.9 161.7 6.3 291.5 539.6 409.7 39.9 26.4 47.5 88.0 66.8 YoY 1.7 3.7 -94.6 -10.3 139.6 -22.1 -56.1 -56.3 1Q11 537.0 335.8 9.2 138.5 17.1 189.3 246.5 199.2 37.5 25.8 35.3 45.9 37.1 QoQ 16.1 13.9 -46.5 4.7 -11.4 20.0 -3.9 -10.2 KIS est. 643.3 398.9 1.1 160.8 30.2 208.9 253.5 195.2 38.0 25.0 32.5 39.4 30.3 29.8 38.0 % diff Consensus -3.1 -4.1 363.3 -9.8 -49.7 8.7 -6.6 -8.3 190.2 242.8 638.6(W bn, %)% diff -2.3-6.4 -5.9Source: Company data, Korea Investment & Securities, FnGuide2Q11P preliminary results (Non-consolidated, K-GAAP)2Q11P Sales Gross profit SG&A OP EBT NP COGS-to-sales SG&A-to-sales OP margin EBT margin NP margin 623.6 382.5 145.1 237.4 236.8 179.0 38.7 23.3 38.1 38.0 28.7 2Q10 613.2 368.7 161.7 206.9 539.6 409.7 39.9 26.4 33.7 88.0 66.8 YoY 1.7 3.7 -10.3 14.7 -56.1 -56.3 1Q11 537.0 335.8 138.5 197.2 246.5 199.2 37.5 25.8 36.7 45.9 37.1 QoQ 16.1 13.9 4.7 20.4 -3.9 -10.2 KIS est. 643.3 398.9 160.8 238.0 253.5 195.2 38.0 25.0 37.0 39.4 30.3 38.1 39.7 30.9 % diff Consensus -3.1 -4.1 -9.8 -0.3 -6.6 -8.3 241.1 251.4 195.6 633.3(W bn, %)% diff -1.5-1.5 -5.8 -8.5Source: Company data, Korea Investment & Securities, FnGuideKT&G’s domestic M/S (quarterly)75 (%)7065605550 1Q07 3Q07 1Q08 3Q08 1Q09 3Q09 1Q10 3Q10 1Q11Source: Company data, Korea Investment & Securities2KT&G (033780)2011F PER comparison with global peers(X) 25 2011F PER Global peer average excluding KT&G 2015105 14.78 0 Philip Morris International British American Tobacco Japan Tobacco Imperial Tobacco Group Gudang Garam Tbk Sw edish Match Lorillard KT&G 14.28 12.36 11.12 19.91 17.76 14.23 9.12Source: Bloomberg, Korea Investment & SecuritiesSales and gross profit by division (Non-consolidated, K-IFRS)1Q09 Sales Tobacco Domestic sales Exports Real estate Pre-sale revenue Rental revenue Others COGS Tobacco Domestic sales Exports Real estate Others Gross profit Tobacco Domestic sales Exports Real estate Others GP margin Tobacco Domestic sales Exports Real estate Others 675.7 563.3 451.0 112.3 104.0 98.2 5.8 8.4 277.8 206.7 149.7 57.0 67.7 3.5 397.8 356.7 301.3 55.4 36.3 4.9 58.9 63.3 66.8 49.3 34.9 58.4 2Q09 685.1 654.5 513.4 141.1 17.5 12.0 5.4 13.2 263.9 247.7 174.3 73.5 9.2 6.9 421.2 406.7 339.1 67.6 8.3 6.2 61.5 62.1 66.1 47.9 47.4 47.3 3Q09 706.0 671.9 524.7 147.2 24.3 18.8 5.5 9.8 284.5 262.2 182.1 80.1 13.7 8.6 421.5 409.7 342.7 67.0 10.6 1.2 59.7 61.0 65.3 45.5 43.6 12.2 4Q09 709.7 582.3 430.1 152.2 112.3 106.6 5.7 15.0 328.7 243.5 148.1 95.4 75.2 10.0 380.9 338.8 282.1 56.7 37.1 5.1 53.7 58.2 65.6 37.3 33.0 33.7 1Q10 540.4 500.2 391.3 108.9 33.1 27.1 6.0 7.0 212.7 189.3 130.4 58.9 19.7 3.7 327.6 310.9 260.9 50.0 13.3 3.3 60.6 62.2 66.7 45.9 40.3 47.5 2Q10 613.2 592.0 454.5 137.5 14.0 8.5 5.6 7.2 244.5 233.6 159.6 74.0 6.8 4.1 368.7 358.3 294.8 63.5 7.2 3.1 60.1 60.5 64.9 46.2 51.7 42.5 3Q10 681.7 656.6 478.3 178.2 18.4 11.8 6.6 6.8 272.4 258.5 161.8 96.7 9.6 4.3 409.3 398.0 316.5 81.5 8.8 2.5 60.0 60.6 66.2 45.7 48.0 36.3 4Q10 664.6 617.5 432.4 185.1 35.0 28.7 6.3 12.2 272.5 244.4 136.6 107.8 20.3 7.8 392.2 373.1 295.8 77.3 14.7 4.4 59.0 60.4 68.4 41.8 41.9 36.2 537.0 518.9 391.3 127.6 6.1 0.0 6.1 12.0 201.3 191.9 125.2 66.7 1.0 8.3 335.8 327.0 266.1 60.8 5.1 3.7 62.5 63.0 68.0 47.7 83.0 30.9(W bn, %)1Q11 2Q11P 623.6 599.9 461.9 138.0 7.1 7.1 16.6 241.2 227.9 147.4 80.5 1.2 12.1 382.5 371.9 314.5 57.5 6.0 4.5 61.3 62.0 68.1 41.6 83.9 27.3YoY 1.7 1.3 1.6 0.4 -49.0 28.6 131.2 -1.4 -2.4 -7.7 8.9 -83.0 192.4 3.7 3.8 6.7 -9.5 -17.3 48.40.0 -100.0Source: Company data, Korea Investment & Securities3KT&G (033780)KT&G and KGC’s 2Q11P earnings (consolidated, K-IFRS)2Q11P Sales KT&G KGC Others COGS KT&G KGC Others Gross profit KT&G KGC Others Other income SG&A Other costs OP KT&G KGC Others EBT NP KT&G KGC Others Combined profit COGS-to-sales KT&G KGC Others GP margin KT&G KGC Others SG&A-to-sales OP margin KT&G KGC Others EBT margin NP margin KT&G KGC Others 898.6 623.6 233.9 41.0 380.4 241.2 114.8 24.4 518.2 382.5 119.1 16.6 10.4 225.0 22.1 281.4 227.1 57.2 -2.9 291.6 215.3 179.0 43.8 -7.5 212.8 42.3 38.7 49.1 59.5 57.7 61.3 50.9 40.5 25.0 31.3 36.4 24.4 -7.1 32.4 24.0 28.7 18.7 -18.3 2Q10 855.2 613.2 202.5 39.5 357.9 244.5 90.6 22.8 497.3 368.7 111.9 16.7 94.6 228.2 8.9 355.1 291.5 63.0 0.3 603.0 451.4 409.7 48.2 -6.5 267.7 41.9 39.9 44.7 57.8 58.1 60.1 55.3 42.2 26.7 41.5 47.5 31.1 0.7 70.5 52.8 66.8 23.8 -16.4 YoY 5.1 1.7 15.5 3.9 6.3 -1.4 26.8 7.1 4.2 3.7 6.4 -0.4 -89.1 -1.4 149.1 -20.7 -22.1 -9.2 -1,145.7 -51.6 -52.3 -56.3 -9.0 -16.1 -20.5 1Q11 824.4 537.0 231.7 55.7 346.8 201.3 107.2 38.3 477.6 335.8 124.5 17.3 12.1 217.8 22.6 249.4 189.3 59.8 0.3 257.4 183.1 199.2 43.3 -59.3 172.0 42.1 37.5 46.3 68.8 57.9 62.5 53.7 31.2 26.4 30.3 35.3 25.8 0.5 31.2 22.2 37.1 18.7 -106.6 QoQ Consensus 9.0 16.1 1.0 -26.3 9.7 19.8 7.1 -36.3 8.5 13.9 -4.4 -4.3 -14.7 3.3 -1.8 12.8 20.0 -4.3 -1,058.3 13.3 17.6 -10.2 1.4 87.3 23.7 221.6 288.6 889.1(W bn, %)% diff 1.1-2.5-2.8Source: Company data, Korea Investment & Securities4KT&G (033780)Balance sheetFY-ending Dec. (W bn) Current assets Cash & cash equivalent Accounts & other receivables Inventory Non-current assets Investment assets Tangible assets Intangible assets Total assets Current liabilities Accounts & other payables ST debt & bond Current portion of LT debt Non-current liabilities Debentures LT debt & financial liabilities Total liabilities Controlling interest Capital stock Capital surplus Capital adjustments Retained earnings Minority interest Shareholders' equity 2009A 2010A 2011F 2012F 2013F 2,700 317 576 1,509 2,471 519 1,472 56 5,172 924 327 95 0 240 0 2 1,164 3,981 955 474 -227 2,649 27 4,008 3,362 981 606 1,497 2,415 431 1,511 63 5,777 925 301 67 1 253 0 2 1,179 4,556 955 487 -217 3,318 42 4,598 3,529 3,972 4,495 898 1,251 1,613 630 655 760 1,708 1,753 1,753 2,641 2,754 3,018 549 67 925 319 67 1 268 0 2 558 71 900 338 67 1 285 0 2 687 84 906 401 67 1 337 0 2 1,581 1,653 1,688 6,171 6,726 7,513Income statementFY-ending Dec. (W bn) Sales Gross profit SG&A expense Other operating gains Operating profit Financial income Interest income Financial expense Interest expense Other non-operating profit Gains (Losses) in associates, subsidiaries and JV Earnings before tax Income taxes Net profit Net profit of controlling interest Other comprehensive profit Total comprehensive profit Total comprehensive profit of controlling interest EBITDA 2009A 2010A 2011F 2012F 2013F 3,626 2,073 867 -50 1,156 13 12 7 5 0 0 1,162 312 850 851 118 969 969 1,309 3,461 2,015 934 59 1,140 270 28 4 3 0 0 1,406 375 1,031 1,032 -125 906 907 1,289 3,662 3,889 4,605 2,171 2,317 2,755 977 1,039 1,209 0 -12 01,194 1,265 1,545 107 41 45 3 0 0 114 41 47 3 0 0 132 48 53 3 0 01,255 1,332 1,625 318 937 938 -14 923 924 336 4041,193 1,184 1,242 4,949 5,519 6,289 955 487 -346 41 955 487 -346 40 955 487 -346996 1,221 997 1,222 0 03,854 4,424 5,194 39996 1,221 997 1,2224,990 5,559 6,3281,329 1,409 1,693Cash flowFY-ending Dec. (W bn) C/F from operating Net profit Depreciation Amortization Net incr. in W/C Others C/F from investing CAPEX Decr. in fixed assets Incr. in investment Net incr. in intangible assets Others C/F from financing Incr. in equity Incr. in debts Dividends Others C/F from others Increase in cashNote: Based on K-IFRS (consolidated)Key financial data2009A 2010A 2011F 2012F 2013F 831 850 152 1 -176 4 -148 -152 19 1 -6 -10 -478 0 -8 -360 -110 2 206 845 1,031 148 1 -194 -140 154 -212 36 258 -13 85 -333 45 -18 -356 -4 -2 665 811 937 134 1 -265 3 -369 -239 35 -132 -5 -28 -512 0 0 -383 -130 0 -70 1,009 1,216 996 1,221 142 2 -134 4 -249 -249 35 -9 -6 -20 -402 0 0 -402 0 0 358 146 2 -163 11 -388 -217 35 -129 -15 -63 -427 0 0 -427 0 0 401 FY-ending Dec. per share data (KRW) EPS BPS DPS Growth (%) Sales growth OP growth NP growth EPS growth EBITDA growth Profitability (%) OP margin NP margin EBITDA margin ROA ROE Dividend yield Stability Net debt (W bn) Debt/equity ratio (%) Valuation (X) PER PBR PSR EV/EBITDA 9.7 2.1 2.5 6.4 8.0 1.9 2.6 6.0 9.1 1.8 2.5 6.1 8.5 1.6 2.4 5.5 6.9 1.4 2.0 4.4 -248 2 -949 1 -868 1 -1,224 1 -1,593 1 31.9 23.5 36.1 16.9 22.8 4.3 32.9 29.8 37.2 18.8 24.2 4.6 32.6 25.6 36.3 15.7 19.7 4.7 32.5 25.6 36.2 15.4 19.1 5.0 33.6 26.5 36.8 17.1 20.7 5.3 9.5 -6.6 -5.2 -3.9 -5.9 -4.5 -1.4 21.2 22.3 -1.5 5.8 4.7 -9.1 -8.6 3.1 6.2 6.0 6.3 7.0 6.0 18.4 22.1 22.6 22.6 20.2 6,630 30,649 2,800 8,109 34,765 3,000 7,415 38,569 3,200 7,936 42,721 3,400 9,727 48,328 3,600 2009A 2010A 2011F 2012F 2013F5KT&G (033780)Changes to recommendation and price targetCompany (Code) KT&G (033780) Date 10-13-09 01-21-10 07-14-10 12-10-10 Recommendation BUY BUY BUY BUY100, 000 90, 000 80, 000 70, 000 60, 000 50, 000 40, 000 30, 000 20, 000 10, 000 0 Ju l -09 N o v-09 M ar-10 Ju l -10 N o v-10 M ar-11 Ju l -11Price target W94,000 W87,000 W82,000 W78,0006KT&G (033780)■Guide to Korea Investment & Securities Co., Ltd. stock ratings based on absolute 12-month forward share price performance BUY: Expected to give a return of +15% or more Hold: Expected to give a return between -15% and 15% Underweight: Expected to give a return of +15% or less Guide to Korea Investment & Securities Co., Ltd. sector ratings for the next 12 months Overweight: Recommend increasing the sector’s weighting in the portfolio compared to its respective weighting in the Kospi (Kosdaq) based on market capitalization. Neutral: Recommend maintaining the sector’s weighting in the portfolio in line with its respective weighting in the Kospi (Kosdaq) based on market capitalization. Underweight: Recommend reducing the sector’s weighting in the portfolio compared to its respective weighting in the Kospi (Kosdaq) based on market capitalization. Analyst Certification I/We, as the research analyst/analysts who prepared this report, do hereby certify that the views expressed in this research report accurately reflect my/our personal views about the subject securities and issuers discussed in this report. I/We do hereby also certify that no part of my/our compensation was, is, or will be directly or indirectly related to the specific recommendations or views contained in this research report.■■■ Important Disclosures As of the end of the month immediately preceding the date of publication of the research report or the public appearance (or the end of the second most recent month if the publication date is less than 10 calendar days after the end of the most recent month), Korea Investment & Securities Co., Ltd., or its affiliates does not own 1% or more of any class of common equity securities of KT&G. There is no actual, material conflict of interest of the research analyst or Korea Investment & Securities Co., Ltd., or its affiliates known at the time of publication of the research report or at the time of the public appearance. Korea Investment & Securities Co., Ltd., or its affiliates has not managed or co-managed a public offering of securities for KT&G in the past 12 months; Korea Investment & Securities Co., Ltd., or its affiliates has not received compensation for investment banking services from KT&G in the past 12 months; Korea Investment & Securities Co., Ltd., or its affiliates does not expect to receive or intends to seek compensation for investment banking services from KT&G in the next 3 months. Korea Investment & Securities Co., Ltd., or its affiliates was not making a market in KT&G’s securities at the time that the research report was published. Korea Investment & Securities Co., Ltd. does not own over 1% of KT&G shares as of July 21, 2011. Korea Investment & Securities Co., Ltd. has not provided this report to various third parties. Neither the analysts covering these companies nor their associates own any shares of as of July 21, 2011. Korea Investment & Securities Co., Ltd. has issued ELW with underlying stocks of KT&G and is the liquidity provider. Prepared by: Kyoung Ju Lee and Eunkyung LeeThis report was written by Korea Investment & Securities Co., Ltd. to help its clients invest in securities. This material is copyrighted and may not be copied, redistributed, forwarded or altered in any way without the consent of Korea Investment & Securities Co., Ltd. This report has been prepared by Korea Investment & Securities Co., Ltd. and is provided for information purposes only. Under no circumstances is it to be used or considered as an offer to sell, or a solicitation of any offer to buy. We make no representation as to its accuracy or completeness and it should not be relied upon as such. The company accepts no liability whatsoever for any direct or consequential loss arising from any use of this report or its contents. The final investment decision is based on the client’s judgment, and this report cannot be used as evidence in any legal dispute related to investment decisions.7。
正官庄资料

正官庄基本资料正官庄正官庄,丽参的品牌老字号,1899年创立人参专卖,具有111年的历史,曾经历专卖厅、韩国烟草人参公社、韩国人参股份等的时代。
正官庄的前身就是韩国人参公社。
于1899年由朝鲜王国政府所创立,是韩国的国营企业,为专门掌管高丽参制造及输出的官方机构。
所出产的《正官庄高丽参》更是由大韩民国政府直接监制,其品质受到国际的认可与信赖。
以正直的企业,醒的企业,共存的企业,理念的韩国人参公社,除将珍惜及维护世界人参宗主企业的传统和名誉外,也将持续为人类的健康幸福而努力,致力成为世界一流的综合健康企业。
正官庄含义“正官庄”是韩国人参公社生产的6年根高丽参产品的注册商标。
“正官庄”产品的商标标识由体现其作为大韩民国特产的太极标志和面向未来的高丽参形象,以及象征6年根高丽参的6颗星组成。
“正”代表公道、公正;“官”代表政府、官方;“庄”代表庄稼和工厂,“正官庄”的含义就是由政府主导开发生产的可信赖的产品。
市场情况2011年5月在韩国不完全统计已经达到900多家直营店。
2009年开始设立台湾、美国、中国海外支舌社法人开拓国外市场。
目前中国市场分布:北京5家、上海3家、深圳3家、临沂2家、杭州2家、庆阳2家、青岛1家、潍坊1家、厦门1家、天津1家、香港1家、一共中国22家。
主要产品:原支参、制品类。
原支参天参:红参的特级商品,内部组织密,无发病的痕迹,外形美观,有一个笔直的支根,几乎没有内孔、内白,内部组织优良(占6年根人参总生产量的0.5%左右)。
地参:属于天参下一个等级,内部组织紧密和外形美观的红参。
良参:属于地参下一个等级,外形优美的红参。
切参:红参的内部组织和外形条件达不到天、地、良参等级,是将整个红参的中间部位进行横切的产品。
规格:重量单位:600g, 300g, 150g/罐支数:10支, 15支, 20支, 30支, 40支, 50支, 60支, 70支600g (一斤)中有10支, 15支的是原来支数+4片, 20~70支的是原来的支数+8片红参按支数及包装单位(600g, 300g, 150g, 75g, 37.5g)的根数在韩国‘人参产业法施行规则’中有具体规定。
海参品牌需挖掘
电子商务正在以前所未有的速度改变着中国商业的零售模式,早先进入电商行业的商家现在已经尝到了甜头,更多的传统行业商家也在加快进入电商行业,作为高端滋补品代表的海参行业也不例外,上网买海参也逐渐成为很多海参消费者的购买选择,一些海参品牌更是早早就布局海参网购市场,中国海参行业迎来的不仅仅是海参需求的不断增长,也迎来了网购海参品牌的崛起。
电子商务在中国根据2011年中国电子商务市场最新发布的相关报告显示,2011年上半年,中国电子商务整体交易规模达3.2万亿元,网络消费总量达4734亿元,较2010年全年增幅48.8%。
同时,一些电商巨头的巨额销量也引起了众多零售企业对电商发展前景的重视,据了解,淘宝商城仅11.11日一天销售额就超过33亿,而一些大型淘宝商城商家当日销量也过千万。
电子商务的发展,尤其是网购的发展,正在改变着中国人的消费习惯,也在改变着中国零售业的结构,电商销量占比零售销售总量的比例也在逐渐增长。
尽管如此,也有一些企业表示出对加入电商队伍的担忧,尤其是一些传统行业的老牌企业,由于其线下网络已经很成熟,一旦加入电商队伍,处理不好可能对现有线下网络的既得利益造成影响,甚至可能引发线下合作伙伴相对稳定的契约关系的不稳定,但是如果不加入电商队伍,也可能不断丢失一些客户,自己的市场份额也可能逐渐减少。
尽管这是一个两难的选择,一些有战略眼光的品牌毅然选择了发展自己的电子商务,加入电商大军,海参行业就有这么一家企业早早就开始发展自己的电子商务,经过几年的发展和运营模式的不断创新,现在已经发展成为海参行业最具影响力的品牌之一。
海参品牌掘金网购宫品海参先行海参行业作为高端滋补品行业的代表,过去一直都是以实体专卖店或者商场专柜经营为主,在北京、天津、上海、济南等地,海参专卖店几乎随处可见。
但是随着近几年电子商务的发展,一些海参品牌也在寻求新的突破点,这个突破点就是网络销售。
而淘金海参网购市场的先行者就是宫品海参。
正官庄(高丽参)年度品牌推广策划
【如何选人】途径一:从正官庄会员中抽选 途径二:从“文化周”、“俱乐部圈子营销”的互动活动中产生 途径三:某个月份购买金额的前50名消费者
【基地之旅】具体内容设计:
正官庄高丽参生态环境行
体验韩国养生文化
正官庄高丽参制作工艺
通过基地观光、韩国养生文化体 验、感受高丽参制作工艺,形成良好 的口碑效应。推动品牌认可。
从李一、张悟本事件说起,两个小人物如何在社会呼风唤雨?绿豆门说 明什么?
全民养生热潮运动的流行。从媒体到消费者,养生已经成为最热门的话题之一。
对健康的期望、对长寿的膜拜!
同时,保健品市场传统感恩文化影响深远。
子女总是希望父母健康长寿,并且乐意更好的回报他们。
结论——
养生与感恩的诉求,是目前正官庄消费
养生
提高免疫力 改善肠道健康 改善血液循环
强精作用 抗糖尿作用 改善肝功能
保健
正官庄产品消费需求洞察
消费行为
消费目的
消费倾向
自用
保健、养生
以延年益寿为主要目的,注重产品 的质量、使用方法,看重功效。
他用
馈赠礼品
送健康理念的背后的社会动力
社会需求形态洞察
感受高丽参养生——系列养生产品展示
体验高丽参养生——产品现场品鉴
韩国养生专 家现场制作 高丽参养生 汤或茶,让 参观者品尝
此外,还可以设计“参与 高丽参养生——现场互动” 活动。
事件策划2
韩国御用养生文化之旅
【活动目的】提升中国消费者对正官庄的了解 打造养生文化认同
【活动内容】正官庄高丽参基地寻源 组织50名中国消费者前往正官庄高丽参韩国基地参观。了解高丽参生态环境 与严格、先进制作工艺。加深对产品品质认同。 一年两次:春季、秋季
韩国正官庄公司介绍

韩国人参公社伴韩国人参公社伴增进健康,分享幸福韩国人参公社宫内府内藏院设立参政课制订并颁布红参专卖法财务部专卖局盐参课划,选定忠南扶余为试验栽培地开城专卖支局转移至忠南扶余Korea Ginseng Corp.6. 7K Gc’s History & Evolution首屈一指的品牌——正官庄大韩民国珍贵人参最初的固有标志“高丽参”正在以“正官庄”这一品牌闻名于世。
作为品牌的摇篮 ——高丽人参厂始终坚守着这一名声。
2010 .04. 02. PM. 03:24正官庄产品包装室111年悠久历史的胎动1899年,大韩帝国宫内府内藏院设立参正课,成为韩国红参重要起始点。
它是韩国人参公社的前身,也是红参事业开始。
2010 气势恢宏的高丽人参厂扶余高丽人参厂散发着红参香以及健康的气味。
坐落在18万5796平方米辽阔大地上的高丽人参厂是展现人参鼻祖国以及作为健康食品业界领军企业的地位。
2010. 06. 02. AM. 09:25 扶余高丽人参厂红参制造厂竣工泰国出口人参类产品越南、澳洲、英国、西德、意大利、丹麦出口人参类产品人参类产品人参类产品人参研讨会高丽人参厂竣工高丽人参厂竣工升级为专卖厅之后,红参事业开始蓬勃发展。
1956年,在忠南扶余建立了红参制造厂——高丽人参厂,此后红参事业更加蒸蒸日上。
随着人参出口台湾、香港、泰国等世界各地,1978年,世界最大规模的高丽人参厂竣工,在韩国的红参制造历史上留下了划时代的一笔。
事业法创立韩国人参烟草研究所1亿美元创立韩国专卖公社香港有限公司法人拓展海外市场高丽参的价值在海外也得到了认可,1987年人参出口额达到了1亿美元。
之后,更改成专卖公社体制,创建了现在的前身——韩国烟草人参公社。
1991年,设立了韩国烟草人参公社香港支社,从而奠定了开拓海外市场的发展。
世界公认的正官庄的价值“正官庄”的标志醒目地坐落在世界名品汇集的天堂——香港的中心地带。
香港市场流通着占全世界70%的人参,正官庄是其中首屈一指的名品,售价是中国参的10倍,美国参的5倍。
加盟必看!正典燕窝的品牌实力分析

加盟必看!正典燕窝的品牌实力分析后疫情时代,提升了人们对大健康的重视程度。
据《2023年618健康消费及营销趋势洞察报告》显示,基础免疫、心理健康和医学科普三项成为大众关注的主流健康话题。
通过此次618的消费数据来看,呈现出以下方面的健康消费趋势:消费人群年轻化、地域下沉态势明显、日常保养持续化、社交出行场景回暖、品牌心智强化。
滋养行业的佳品当属燕窝,燕窝本身不仅拥有特殊的营养成分——燕窝酸,而且兼具多重属性——送礼必备、高端食材、滋补养颜等。
行业内的头部品牌、品质标杆——正典燕窝,以不断升级的燕窝食用方式、强化创新的燕窝品类、针对痛点的市场调整,受到广大消费者的热烈吹捧,成为全网口有良好口碑,名副其实的强劲实力品牌。
产业深耕——品质溯源、把控全链正典燕窝自2010年就开始深耕燕窝市场,秉持着“正心诚意、传承经典”的初心,以国际视野打造滋补养生新世代。
目前,正典燕窝已蝉联7年的马来西亚出口中国食用燕窝总量NO.1,在马来西亚和中国两地,四区坐拥4大燕窝加工中心,拥有发达的供应链条和强悍的创新研发能力;同时,正典已形成采燕、燕窝加工、科研、储存、进出口贸易、品牌运营为一体的全产业链战略布局,开创燕窝溯源体系,推动行业规范化。
正典燕窝的核心竞争力,来源于对消费者的需求调查、对产品线的迭代创新、对市场的深度调研、对服务的精准把握。
纵观正典的产业链,为了打造高标准、严要求的天然好燕窝,正典经过多地寻访,对生产燕窝的地区进行实地勘察,最终选定马来西亚的燕屋。
正典安排专员,为金丝燕进行燕屋清扫、幼燕保育等工作,保证金丝燕的生存环境,温湿合宜、燕食丰富、远离污染。
从源头方面,保证采摘的燕盏产量足、杂质少、色泽好、纯度高。
后续,正典会在马来西亚十万级GMP燕窝加工中心,进行多道工序加工——除杂、研磨、挑毛、定型、风干、检验、包装。
正典加工中心拥有31项专利著作权,配置多条自动化生产线和专业设备,建设专业的古法挑毛手工车间,以科学维度和手工匠心,打造更好品质的燕窝。
三养的品牌资质分析报告
“三养”品牌资质分析报告
尊敬的用户:
随着经济全球化的深入发展,各市场领域的竞争已逐渐表现为品牌竞争。
根据中国互联网络信息中心(CNNIC)公布的最新数据显示,中国网民规模已达8.02亿,互联网普及率57.7%。
而网民规模增长的推动力正是由于互联网商业模式的不断创新以及线上线下服务融合的加速,因此,互联网时代的到来也意味着网络品牌标识的价值提升。
习总书记不断强调知识产权战略的重要性,同时每年5月10日“中国品牌日”的确立也标志着品牌建设与保护已经刻不容缓。
根据您查询的“三养”品牌,及“制造业-食品药品”行业,三养的品牌分析报告如下:
目录
一、三养品牌商标分析
1、行业注册分析
1.1 制造业-食品药品行业注册分析
1.1.1 制造业-食品药品行业品牌注册量
1.1.2 三养品牌在制造业-食品药品行业的主要注册情况
1.1.3 制造业-食品药品行业下三养同名品牌的主要竞争对手
2、三养品牌商标注册分析
2.1 制造业-食品药品行业类别分析
2.2 三养品牌在制造业-食品药品行业的保护现状
3、三养品牌字样在各行业的注册情况表
二、三养品牌域名分析
1、全球知名品牌案例
2、三养品牌域名匹配分析
3、品牌域名注册概况
4、相关域名潜在竞争企业
5、Typo域名
三、品牌保护建议
正文
1.1.2 -。
- 1、下载文档前请自行甄别文档内容的完整性,平台不提供额外的编辑、内容补充、找答案等附加服务。
- 2、"仅部分预览"的文档,不可在线预览部分如存在完整性等问题,可反馈申请退款(可完整预览的文档不适用该条件!)。
- 3、如文档侵犯您的权益,请联系客服反馈,我们会尽快为您处理(人工客服工作时间:9:00-18:30)。
“正官庄”品牌资质分析报告
尊敬的用户:
随着经济全球化的深入发展,各市场领域的竞争已逐渐表现为品牌竞争。
根据中国互联网络信息中心(CNNIC)公布的最新数据显示,中国网民规模已达8.02亿,互联网普及率57.7%。
而网民规模增长的推动力正是由于互联网商业模式的不断创新以及线上线下服务融合的加速,因此,互联网时代的到来也意味着网络品牌标识的价值提升。
习总书记不断强调知识产权战略的重要性,同时每年5月10日“中国品牌日”的确立也标志着品牌建设与保护已经刻不容缓。
根据您查询的“正官庄”品牌,及“制造业-食品药品”行业,正官庄的品牌分析报告如下:
目录
一、正官庄品牌商标分析
1、行业注册分析
1.1 制造业-食品药品行业注册分析
1.1.1 制造业-食品药品行业品牌注册量
1.1.2 正官庄品牌在制造业-食品药品行业的主要注册情况
1.1.3 制造业-食品药品行业下正官庄同名品牌的主要竞争对手
2、正官庄品牌商标注册分析
2.1 制造业-食品药品行业类别分析
2.2 正官庄品牌在制造业-食品药品行业的保护现状
3、正官庄品牌字样在各行业的注册情况表
二、正官庄品牌域名分析
1、全球知名品牌案例
2、正官庄品牌域名匹配分析
3、品牌域名注册概况
4、Typo域名
三、品牌保护建议
正文
一、正官庄品牌商标分析
1.1.2 -
“正官庄”品牌在制造业-食品药品行业,主要注册了以下几个类别:1、05类,2、30类,3、35。