美国大学生数学建模特等奖论文全集F43181
美国大学生数学建模竞赛优秀论文
For office use onlyT1________________ T2________________ T3________________ T4________________Team Control Number7018Problem ChosencFor office use onlyF1________________F2________________F3________________F4________________ SummaryThe article is aimed to research the potential impact of the marine garbage debris on marine ecosystem and human beings,and how we can deal with the substantial problems caused by the aggregation of marine wastes.In task one,we give a definition of the potential long-term and short-term impact of marine plastic garbage. Regard the toxin concentration effect caused by marine garbage as long-term impact and to track and monitor it. We etablish the composite indicator model on density of plastic toxin,and the content of toxin absorbed by plastic fragment in the ocean to express the impact of marine garbage on ecosystem. Take Japan sea as example to examine our model.In ask two, we designe an algorithm, using the density value of marine plastic of each year in discrete measure point given by reference,and we plot plastic density of the whole area in varies locations. Based on the changes in marine plastic density in different years, we determine generally that the center of the plastic vortex is East—West140°W—150°W, South—North30°N—40°N. According to our algorithm, we can monitor a sea area reasonably only by regular observation of part of the specified measuring pointIn task three,we classify the plastic into three types,which is surface layer plastic,deep layer plastic and interlayer between the two. Then we analysis the the degradation mechanism of plastic in each layer. Finally,we get the reason why those plastic fragments come to a similar size.In task four, we classify the source of the marine plastic into three types,the land accounting for 80%,fishing gears accounting for 10%,boating accounting for 10%,and estimate the optimization model according to the duel-target principle of emissions reduction and management. Finally, we arrive at a more reasonable optimization strategy.In task five,we first analyze the mechanism of the formation of the Pacific ocean trash vortex, and thus conclude that the marine garbage swirl will also emerge in south Pacific,south Atlantic and the India ocean. According to the Concentration of diffusion theory, we establish the differential prediction model of the future marine garbage density,and predict the density of the garbage in south Atlantic ocean. Then we get the stable density in eight measuring point .In task six, we get the results by the data of the annual national consumption ofpolypropylene plastic packaging and the data fitting method, and predict the environmental benefit generated by the prohibition of polypropylene take-away food packaging in the next decade. By means of this model and our prediction,each nation will reduce releasing 1.31 million tons of plastic garbage in next decade.Finally, we submit a report to expediction leader,summarize our work and make some feasible suggestions to the policy- makers.Task 1:Definition:●Potential short-term effects of the plastic: the hazardeffects will be shown in the short term.●Potential long-term effects of the plastic: thepotential effects, of which hazards are great, willappear after a long time.The short- and long-term effects of the plastic on the ocean environment:In our definition, the short-term and long-term effects of the plastic on the ocean environment are as follows.Short-term effects:1)The plastic is eaten by marine animals or birds.2) Animals are wrapped by plastics, such as fishing nets, which hurt or even kill them.3)Deaden the way of the passing vessels.Long-term effects:1)Enrichment of toxins through the food chain: the waste plastic in the ocean has no natural degradation in theshort-term, which will first be broken down into tinyfragments through the role of light, waves,micro-organisms, while the molecular structure has notchanged. These "plastic sands", easy to be eaten byplankton, fish and other, are Seemingly very similar tomarine life’s food,causing the enrichment and delivery of toxins.2)Accelerate the greenhouse effect: after a long-term accumulation and pollution of plastics, the waterbecame turbid, which will seriously affect the marineplants (such as phytoplankton and algae) inphotosynthesis. A large number of plankton’s deathswould also lower the ability of the ocean to absorbcarbon dioxide, intensifying the greenhouse effect tosome extent.To monitor the impact of plastic rubbish on the marine ecosystem:According to the relevant literature, we know that plastic resin pellets accumulate toxic chemicals , such as PCBs、DDE , and nonylphenols , and may serve as a transport medium and soure of toxins to marine organisms that ingest them[]2. As it is difficult for the plastic garbage in the ocean to complete degradation in the short term, the plastic resin pellets in the water will increase over time and thus absorb more toxins, resulting in the enrichment of toxins and causing serious impact on the marine ecosystem.Therefore, we track the monitoring of the concentration of PCBs, DDE, and nonylphenols containing in the plastic resin pellets in the sea water, as an indicator to compare the extent of pollution in different regions of the sea, thus reflecting the impact of plastic rubbish on ecosystem.To establish pollution index evaluation model: For purposes of comparison, we unify the concentration indexes of PCBs, DDE, and nonylphenols in a comprehensive index.Preparations:1)Data Standardization2)Determination of the index weightBecause Japan has done researches on the contents of PCBs,DDE, and nonylphenols in the plastic resin pellets, we illustrate the survey conducted in Japanese waters by the University of Tokyo between 1997 and 1998.To standardize the concentration indexes of PCBs, DDE,and nonylphenols. We assume Kasai Sesside Park, KeihinCanal, Kugenuma Beach, Shioda Beach in the survey arethe first, second, third, fourth region; PCBs, DDE, andnonylphenols are the first, second, third indicators.Then to establish the standardized model:j j jij ij V V V V V min max min --= (1,2,3,4;1,2,3i j ==)wherej V max is the maximum of the measurement of j indicator in the four regions.j V min is the minimum of the measurement of j indicatorstandardized value of j indicator in i region.According to the literature [2], Japanese observationaldata is shown in Table 1.Table 1. PCBs, DDE, and, nonylphenols Contents in Marine PolypropyleneTable 1 Using the established standardized model to standardize, we have Table 2.In Table 2,the three indicators of Shioda Beach area are all 0, because the contents of PCBs, DDE, and nonylphenols in Polypropylene Plastic Resin Pellets in this area are the least, while 0 only relatively represents the smallest. Similarly, 1 indicates that in some area the value of a indicator is the largest.To determine the index weight of PCBs, DDE, and nonylphenolsWe use Analytic Hierarchy Process (AHP) to determine the weight of the three indicators in the general pollution indicator. AHP is an effective method which transforms semi-qualitative and semi-quantitative problems into quantitative calculation. It uses ideas of analysis and synthesis in decision-making, ideally suited for multi-index comprehensive evaluation.Hierarchy are shown in figure 1.Fig.1 Hierarchy of index factorsThen we determine the weight of each concentrationindicator in the generall pollution indicator, and the process are described as follows:To analyze the role of each concentration indicator, we haveestablished a matrix P to study the relative proportion.⎥⎥⎥⎦⎤⎢⎢⎢⎣⎡=111323123211312P P P P P P P Where mn P represents the relative importance of theconcentration indicators m B and n B . Usually we use 1,2,…,9 and their reciprocals to represent different importance. The greater the number is, the more important it is. Similarly, the relative importance of m B and n B is mn P /1(3,2,1,=n m ).Suppose the maximum eigenvalue of P is m ax λ, then theconsistency index is1max --=n nCI λThe average consistency index is RI , then the consistencyratio isRICI CR = For the matrix P of 3≥n , if 1.0<CR the consistency isthougt to be better, of which eigenvector can be used as the weight vector.We get the comparison matrix accoding to the harmful levelsof PCBs, DDE, and nonylphenols and the requirments ofEPA on the maximum concentration of the three toxins inseawater as follows:⎥⎥⎥⎦⎤⎢⎢⎢⎣⎡=165416131431P We get the maximum eigenvalue of P by MATLAB calculation0012.3max =λand the corresponding eigenvector of it is()2393.02975.09243.0,,=W1.0042.012.1047.0<===RI CI CR Therefore,we determine the degree of inconsistency formatrix P within the permissible range. With the eigenvectors of p as weights vector, we get thefinal weight vector by normalization ()1638.02036.06326.0',,=W . Defining the overall target of pollution for the No i oceanis i Q , among other things the standardized value of threeindicators for the No i ocean is ()321,,i i i i V V V V = and the weightvector is 'W ,Then we form the model for the overall target of marine pollution assessment, (3,2,1=i )By the model above, we obtained the Value of the totalpollution index for four regions in Japanese ocean in Table 3T B W Q '=In Table3, the value of the total pollution index is the hightest that means the concentration of toxins in Polypropylene Plastic Resin Pellets is the hightest, whereas the value of the total pollution index in Shioda Beach is the lowest(we point up 0 is only a relative value that’s not in the name of free of plastics pollution)Getting through the assessment method above, we can monitor the concentration of PCBs, DDE and nonylphenols in the plastic debris for the sake of reflecting the influence to ocean ecosystem.The highter the the concentration of toxins,the bigger influence of the marine organism which lead to the inrichment of food chain is more and more dramatic.Above all, the variation of toxins’ concentration simultaneously reflects the distribution and time-varying of marine litter. We can predict the future development of marine litter by regularly monitoring the content of these substances, to provide data for the sea expedition of the detection of marine litter and reference for government departments to make the policies for ocean governance.Task 2:In the North Pacific, the clockwise flow formed a never-ending maelstrom which rotates the plastic garbage. Over the years, the subtropical eddy current in North Pacific gathered together the garbage from the coast or the fleet, entrapped them in the whirlpool, and brought them to the center under the action of the centripetal force, forming an area of 3.43 million square kilometers (more than one-third of Europe) .As time goes by, the garbage in the whirlpool has the trend of increasing year by year in terms of breadth, density, and distribution. In order to clearly describe the variability of the increases over time and space, according to “Count Densities of Plastic Debris from Ocean Surface Samples North Pacific Gyre 1999—2008”, we analyze the data, exclude them with a great dispersion, and retain them with concentrated distribution, while the longitude values of the garbage locations in sampled regions of years serve as the x-coordinate value of a three-dimensional coordinates, latitude values as the y-coordinate value, the Plastic Count per cubic Meter of water of the position as the z-coordinate value. Further, we establish an irregular grid in the yx plane according to obtained data, and draw a grid line through all the data points. Using the inverse distance squared method with a factor, which can not only estimate the Plastic Count per cubic Meter of water of any position, but also calculate the trends of the Plastic Counts per cubic Meter of water between two original data points, we can obtain the unknown grid points approximately. When the data of all the irregular grid points are known (or approximately known, or obtained from the original data), we can draw the three-dimensional image with the Matlab software, which can fully reflect the variability of the increases in the garbage density over time and space.Preparations:First, to determine the coordinates of each year’s sampled garbage.The distribution range of garbage is about the East - West 120W-170W, South - North 18N-41N shown in the “Count Densities of Plastic Debris from Ocean Surface Samples North Pacific Gyre 1999--2008”, we divide a square in the picture into 100 grids in Figure (1) as follows:According to the position of the grid where the measuring point’s center is, we can identify the latitude and longitude for each point, which respectively serve as the x- and y- coordinate value of the three-dimensional coordinates.To determine the Plastic Count per cubic Meter of water. As the “Plastic Count per cubic Meter of water” provided by “Count Densities of P lastic Debris from Ocean Surface Samples North Pacific Gyre 1999--2008”are 5 density interval, to identify the exact values of the garbage density of one year’s different measuring points, we assume that the density is a random variable which obeys uniform distribution in each interval.Uniform distribution can be described as below:()⎪⎩⎪⎨⎧-=01a b x f ()others b a x ,∈We use the uniform function in Matlab to generatecontinuous uniformly distributed random numbers in each interval, which approximately serve as the exact values of the garbage density andz-coordinate values of the three-dimensional coordinates of the year’s measuring points.Assumptions(1)The data we get is accurate and reasonable.(2)Plastic Count per cubic Meter of waterIn the oceanarea isa continuous change.(3)Density of the plastic in the gyre is a variable by region.Density of the plastic in the gyre and its surrounding area is interdependent , However, this dependence decreases with increasing distance . For our discussion issue, Each data point influences the point of each unknown around and the point of each unknown around is influenced by a given data point. The nearer a given data point from the unknown point, the larger the role.Establishing the modelFor the method described by the previous,we serve the distributions of garbage density in the “Count Pensities of Plastic Debris from Ocean Surface Samples North Pacific Gyre 1999--2008”as coordinates ()z y,, As Table 1:x,Through analysis and comparison, We excluded a number of data which has very large dispersion and retained the data that is under the more concentrated the distribution which, can be seen on Table 2.In this way, this is conducive for us to get more accurate density distribution map.Then we have a segmentation that is according to the arrangement of the composition of X direction and Y direction from small to large by using x co-ordinate value and y co-ordinate value of known data points n, in order to form a non-equidistant Segmentation which has n nodes. For the Segmentation we get above,we only know the density of the plastic known n nodes, therefore, we must find other density of the plastic garbage of n nodes.We only do the sampling survey of garbage density of the north pacificvortex,so only understand logically each known data point has a certain extent effect on the unknown node and the close-known points of density of the plastic garbage has high-impact than distant known point.In this respect,we use the weighted average format, that means using the adverse which with distance squared to express more important effects in close known points. There're two known points Q1 and Q2 in a line ,that is to say we have already known the plastic litter density in Q1 and Q2, then speculate the plastic litter density's affects between Q1、Q2 and the point G which in the connection of Q1 and Q2. It can be shown by a weighted average algorithm22212221111121GQ GQ GQ Z GQ Z Z Q Q G +*+*=in this formula GQ expresses the distance between the pointG and Q.We know that only use a weighted average close to the unknown point can not reflect the trend of the known points, we assume that any two given point of plastic garbage between the changes in the density of plastic impact the plastic garbage density of the unknown point and reflecting the density of plastic garbage changes in linear trend. So in the weighted average formula what is in order to presume an unknown point of plastic garbage density, we introduce the trend items. And because the greater impact at close range point, and thus the density of plastic wastes trends close points stronger. For the one-dimensional case, the calculation formula G Z in the previous example modify in the following format:2212122212212122211111112121Q Q GQ GQ GQ Q Q GQ Z GQ Z GQ Z Z Q Q Q Q G ++++*+*+*=Among them, 21Q Q known as the separation distance of the known point, 21Q Q Z is the density of plastic garbage which is the plastic waste density of 1Q and 2Q for the linear trend of point G . For the two-dimensional area, point G is not on the line 21Q Q , so we make a vertical from the point G and cross the line connect the point 1Q and 2Q , and get point P , the impact of point P to 1Q and 2Q just like one-dimensional, and the one-dimensional closer of G to P , the distant of G to P become farther, the smaller of the impact, so the weighting factor should also reflect the GP in inversely proportional to a certain way, then we adopt following format:221212222122121222211111112121Q Q GQ GP GQ GQ Q Q GQ GP Z GQ Z GQ Z Z P Q Q Q Q G ++++++*+*+*=Taken together, we speculated following roles:(1) Each known point data are influence the density of plastic garbage of each unknown point in the inversely proportional to the square of the distance;(2) the change of density of plastic garbage between any two known points data, for each unknown point are affected, and the influence to each particular point of their plastic garbage diffuse the straight line along the two known particular point; (3) the change of the density of plastic garbage between any two known data points impact a specific unknown points of the density of plastic litter depends on the three distances: a. the vertical distance to a straight line which is a specific point link to a known point;b. the distance between the latest known point to a specific unknown point;c. the separation distance between two known data points.If we mark 1Q ,2Q ,…,N Q as the location of known data points,G as an unknown node, ijG P is the intersection of the connection of i Q ,j Q and the vertical line from G to i Q ,j Q()G Q Q Z j i ,,is the density trend of i Q ,j Q in the of plasticgarbage points and prescribe ()G Q Q Z j i ,,is the testing point i Q ’ s density of plastic garbage ,so there are calculation formula:()()∑∑∑∑==-==++++*=Ni N ij ji i ijGji i ijG N i Nj j i G Q Q GQ GPQ Q GQ GP G Q Q Z Z 11222222111,,Here we plug each year’s observational data in schedule 1 into our model, and draw the three-dimensional images of the spatial distribution of the marine garbage ’s density with Matlab in Figure (2) as follows:199920002002200520062007-2008(1)It’s observed and analyzed that, from 1999 to 2008, the density of plastic garbage is increasing year by year and significantly in the region of East – West 140W-150W, south - north 30N-40N. Therefore, we can make sure that this region is probably the center of the marine litter whirlpool. Gathering process should be such that the dispersed garbage floating in the ocean move with the ocean currents and gradually close to the whirlpool region. At the beginning, the area close to the vortex will have obviously increasable about plastic litter density, because of this centripetal they keeping move to the center of the vortex ,then with the time accumulates ,the garbage density in the center of the vortex become much bigger and bigger , at last it becomes the Pacific rubbish island we have seen today.It can be seen that through our algorithm, as long as the reference to be able to detect the density in an area which has a number of discrete measuring points,Through tracking these density changes ,we Will be able to value out all the waters of the density measurement through our models to determine,This will reduce the workload of the marine expedition team monitoring marine pollution significantly, and also saving costs .Task 3:The degradation mechanism of marine plasticsWe know that light, mechanical force, heat, oxygen, water, microbes, chemicals, etc. can result in the degradation of plastics . In mechanism ,Factors result in the degradation can be summarized as optical ,biological,and chemical。
2013美国大学生数学建模竞赛论文
summaryOur solution paper mainly deals with the following problems:·How to measure the distribution of heat across the outer edge of pans in differentshapes and maximize even distribution of heat for the pan·How to design the shape of pans in order to make the best of space in an oven·How to optimize a combination of the former two conditions.When building the mathematic models, we make some assumptions to get themto be more reasonable. One of the major assumptions is that heat is evenly distributedwithin the oven. We also introduce some new variables to help describe the problem.To solve all of the problems, we design three models. Based on the equation ofheat conduction, we simulate the distribution of heat across the outer edge with thehelp of some mathematical softwares. In addition, taking the same area of all the pansinto consideration, we analyze the rate of space utilization ratio instead of thinkingabout maximal number of pans contained in the oven. What’s more, we optimize acombination of conditions (1) and (2) to find out the best shape and build a function toshow the relation between the weightiness of both conditions and the width to lengthratio, and to illustrate how the results vary with different values of W/L and p.To test our models, we compare the results obtained by stimulation and our models, tofind that our models fit the truth well. Yet, there are still small errors. For instance, inModel One, the error is within 1.2% .In our models, we introduce the rate of satisfaction to show how even thedistribution of heat across the outer edge of a pan is clearly. And with the help ofmathematical softwares such as Matlab, we add many pictures into our models,making them more intuitively clear. But our models are not perfect and there are someshortcomings such as lacking specific analysis of the distribution of heat across theouter edge of a pan of irregular shapes. In spite of these, our models can mainlypredict the actual conditions, within reasonable range of error.For office use onlyT1 ________________T2 ________________T3 ________________T4 ________________ Team Control Number18674 Problem Chosen AFor office use only F1 ________________ F2 ________________ F3 ________________ F4 ________________2013 Mathematical Contest in Modeling (MCM) Summary Sheet(Attach a copy of this page to your solution paper.)Type a summary of your results on this page. Do not includethe name of your school, advisor, or team members on this page.The Ultimate Brownie PanAbstractWe introduce three models in the paper in order to find out the best shape for the Brownie Pan, which is beneficial to both heat conduction and space utility.The major assumption is that heat is evenly distributed within the oven. On the basis of this, we introduce three models to solve the problem.The first model deals with heat distribution. After simulative experiments and data processing, we achieve the connection between the outer shape of pans and heat distribution.The second model is mainly on the maximal number of pans contained in an oven. During the course, we use utility rate of space to describe the number. Finally, we find out the functional relation.Having combined both of the conditions, we find an equation relation. Through mathematical operation, we attain the final conclusion.IntroductionHeat usage has always been one of the most challenging issues in modern world. Not only does it has physic significance, but also it can influence each bit of our daily life. Likewise,space utilization, beyond any doubt, also contains its own strategic importance. We build three mathematic models based on underlying theory of thermal conduction and tip thermal effects.The first model describes the process and consequence of heat conduction, thus representing the temperature distribution. Given the condition that regular polygons gets overcooked at the corners, we introduced the concept of tip thermal effects into our prediction scheme. Besides, simulation technique is applied to both models for error correction to predict the final heat distribution.Assumption• Heat is distributed evenly in the oven.Obviously, an oven has its normal operating temperature, which is gradually reached actually. We neglect the distinction of temperature in the oven and the heating process, only to focus on the heat distribution of pans on the basis of their construction.Furthermore, this assumption guarantees the equivalency of the two racks.• Thermal conductivity is temperature-invariant.Thermal conductivity is a physical quantity, symbolizing the capacity of materials. Always, the thermal conductivity of metal material usually varies with different temperatures, in spite of tiny change in value. Simply, we suppose the value to be a constant.• Heat flux of boundaries keeps steady.Heat flux is among the important indexes of heat dispersion. In this transference, we give it a constant value.• Heat conduction dom inates the variation of temperature, while the effects ofheat radiation and heat convection can be neglected.Actually, the course of heat conduction, heat radiation and heat convectiondecide the variation of temperature collectively. Due to the tiny influence of other twofactors, we pay closer attention to heat conduction.• The area of ovens is a constant.I ntroduction of mathematic modelsModel 1: Heat conduction• Introduction of physical quantities:q: heat fluxλ: Thermal conductivityρ: densityc: specific heat capacityt: temperature τ: timeV q : inner heat sourceW q : thermal fluxn: the number of edges of the original polygonsM t : maximum temperaturem t : minimum temperatureΔt: change quantity of temperatureL: side length of regular polygon• Analysis:Firstly, we start with The Fourier Law:2(/)q gradt W m λ=- . (1) According to The Fourier Law, along the direction of heat conduction, positionsof a larger cross-sectional area are lower in temperature. Therefore, corners of panshave higher temperatures.Secondly, let’s analyze the course of heat conduction quantitatively.To achieve this, we need to figure out exact temperatures of each point across theouter edge of a pan and the variation law.Based on the two-dimension differential equation of heat conduction:()()V t t t c q x x y yρλλτ∂∂∂∂∂=++∂∂∂∂∂. (2) Under the assumption that heat distribution is time-independent, we get0t τ∂=∂. (3)And then the heat conduction equation (with no inner heat source)comes to:20t ∇=. (4)under the Neumann boundary condition: |W s q t n λ∂-=∂. (5)Then we get the heat conduction status of regular polygons and circles as follows:Fig 1In consideration of the actual circumstances that temperature is higher at cornersthan on edges, we simulate the temperature distribution in an oven and get resultsabove. Apparently, there is always higher temperature at corners than on edges.Comparatively speaking, temperature is quite more evenly distributed around circles.This can prove the validity of our model rudimentarily.From the figure above, we can get extreme values along edges, which we callM t and m t . Here, we introduce a new physical quantity k , describing the unevennessof heat distribution. For all the figures are the same in area, we suppose the area to be1. Obviously, we have22sin 2sin L n n n ππ= (6) Then we figure out the following results.n t M t m t ∆ L ksquare 4 214.6 203.3 11.3 1.0000 11.30pentagon 5 202.1 195.7 6.4 0.7624 8.395hexagon 6 195.7 191.3 4.4 0.6204 7.092heptagon 7 193.1 190.1 3.0 0.5246 5.719octagon 8 191.1 188.9 2.2 0.4551 4.834nonagon 9 188.9 187.1 1.8 0.4022 4.475decagon 10 189.0 187.4 1.6 0.3605 4.438Table 1It ’s obvious that there is negative correlation between the value of k and thenumber of edges of the original polygons. Therefore, we can use k to describe theunevenness of temperature distribution along the outer edge of a pan. That is to say, thesmaller k is, the more homogeneous the temperature distribution is.• Usability testing:We use regular hendecagon to test the availability of the model.Based on the existing figures, we get a fitting function to analyze the trend of thevalue of k. Again, we introduce a parameter to measure the value of k.Simply, we assume203v k =, (7) so that100v ≤. (8)n k v square 4 11.30 75.33pentagon 5 8.39 55.96hexagon 6 7.09 47.28heptagon 7 5.72 38.12octagon 8 4.83 32.23nonagon9 4.47 29.84 decagon 10 4.44 29.59Table 2Then, we get the functional image with two independent variables v and n.Fig 2According to the functional image above, we get the fitting function0.4631289.024.46n v e -=+.(9) When it comes to hendecagons, n=11. Then, v=26.85.As shown in the figure below, the heat conduction is within our easy access.Fig 3So, we can figure out the following result.vnActually,2026.523tvL∆==.n ∆t L k vhendecagons 11 187.1 185.8 1.3 0.3268 3.978 26.52Table 3Easily , the relative error is 1.24%.So, our model is quite well.• ConclusionHeat distribution varies with the shape of pans. To put it succinctly, heat is more evenly distributed along more edges of a single pan. That is to say, pans with more number of peripheries or more smooth peripheries are beneficial to even distribution of heat. And the difference in temperature contributes to overcooking. Through calculation, the value of k decreases with the increase of edges. With the help of the value of k, we can have a precise prediction of heat contribution.Model 2: The maximum number• Introduction of physical quantities:n: the number of edges of the original polygonsα: utility rate of space• Analysis:Due to the fact that the area of ovens and pans are constant, we can use the area occupied by pans to describe the number of pans. Further, the utility rate of space can be used to describe the number. In the following analysis, we will make use of the utility rate of space to pick out the best shape of pans. We begin with the best permutation devise of regular polygon. Having calculated each utility rate of space, we get the variation tendency.• Model Design:W e begin with the scheme which makes the best of space. Based on this knowledge, we get the following inlay scheme.Fig 4Fig 5According to the schemes, we get each utility rate of space which is showed below.n=4 n=5 n=6 n=7 n=8 n=9 n=10 n=11 shape square pentagon hexagon heptagon octagon nonagon decagon hendecagon utility rate(%)100.00 85.41 100.00 84.22 82.84 80.11 84.25 86.21Table 4Using the ratio above, we get the variation tendency.Fig 6 nutility rate of space• I nstructions:·The interior angle degrees of triangles, squares, and regular hexagon can be divided by 360, so that they all can completely fill a plane. Here, we exclude them in the graph of function.·When n is no more than 9, there is obvious negative correlation between utility rate of space and the value of n. Otherwise, there is positive correlation.·The extremum value of utility rate of space is 90.69%,which is the value for circles.• Usability testing:We pick regular dodecagon for usability testing. Below is the inlay scheme.Fig 7The space utility for dodecagon is 89.88%, which is around the predicted value. So, we’ve got a rather ideal model.• Conclusion:n≥), the When the number of edges of the original polygons is more than 9(9 space utility is gradually increasing. Circles have the extreme value of the space utility. In other words, circles waste the least area. Besides, the rate of increase is in decrease. The situation of regular polygon with many sides tends to be that of circles. In a word, circles have the highest space utility.Model 3: Rounded rectangle• Introduction of physical quantities:A: the area of the rounded rectanglel: the length of the rounded rectangleα: space utilityβ: the width to length ratio• Analysis:Based on the combination of consideration on the highest space utility of quadrangle and the even heat distribution of circles, we invent a model using rounded rectangle device for pans. It can both optimize the cooking effect and minimize the waste of space.However, rounded rectangles are exactly not the same. Firstly, we give our rounded rectangle the same width to length ratio (W/L) as that of the oven, so that least area will be wasted. Secondly, the corner radius can not be neglected as well. It’ll give the distribution of heat across the outer edge a vital influence. In order to get the best pan in shape, we must balance how much the two of the conditions weigh in the scheme.• Model Design:To begin with, we investigate regular rounded rectangle.The area224r ar a A π++= (10) S imilarly , we suppose the value of A to be 1. Then we have a function between a and r :21(4)2a r r π=+--(11) Then, the space utility is()212a r α=+ (12) And, we obtain()2114rαπ=+- (13)N ext, we investigate the relation between k and r, referring to the method in the first model. Such are the simulative result.Fig 8Specific experimental results arer a ∆t L k 0.05 0.90 209.2 199.9 9.3 0.98 9.49 0.10 0.80 203.8 196.4 7.4 0.96 7.70 0.15 0.71 199.6 193.4 6.2 0.95 6.56 0.20 0.62 195.8 190.5 5.3 0.93 5.69 0.25 0.53 193.2 189.1 4.1 0.92 4.46Table 5According to the table above, we get the relation between k and r.Fig 9So, we get the function relation3.66511.190.1013r k e -=+. (14) After this, we continue with the connection between the width to length ratioW Lβ=and heat distribution. We get the following results.krFig 10From the condition of heat distribution, we get the relation between k and βFig 11And the function relation is4.248 2.463k β=+ (15)Now we have to combine the two patterns together:3.6654.248 2.463(11.190.1013)4.248 2.463r k e β-+=++ (16)Finally, we need to take the weightiness (p) into account,(,,)()(,)(1)f r p r p k r p βαβ=⋅+⋅- (17)To standard the assessment level, we take squares as criterion.()(,)(1)(,,)111.30r p k r p f r p αββ⋅⋅-=+ (18) Then, we get the final function3.6652(,,)(1)(0.37590.2180)(1.6670.0151)1(4)r p f r p p e rββπ-=+-⋅+⋅++- (19) So we get()()3.6652224(p 1)(2.259β 1.310)14r p f e r r ππ--∂=-+-+∂⎡⎤+-⎣⎦ (20) Let 0f r∂=∂,we can get the function (,)r p β. Easily,0r p∂<∂ and 0r β∂>∂ (21) So we can come to the conclusion that the value of r decreases with the increase of p. Similarly, the value of r increases with the increase of β.• Conclusion:Model 3 combines all of our former analysis, and gives the final result. According to the weightiness of either of the two conditions, we can confirm the final best shape for a pan.• References:[1] Xingming Qi. Matlab 7.0. Beijing: Posts & Telecom Press, 2009: 27-32[2] Jiancheng Chen, Xinsheng Pang. Statistical data analysis theory and method. Beijing: China's Forestry Press, 2006: 34-67[3] Zhengshen Fan. Mathematical modeling technology. Beijing: China Water Conservancy Press, 2003: 44-54Own It NowYahoo! Ladies and gentlemen, please just have a look at what a pan we have created-the Ultimate Brownie Pan.Can you imagine that just by means of this small invention, you can get away of annoying overcookedchocolate Brownie Cake? Pardon me, I don’t want to surprise you, but I must tell you , our potential customers, that we’ve made it! Believing that it’s nothing more than a common pan, some people may think that it’s not so difficult to create such a pan. To be honest, it’s not just a simple pan as usual, and it takes a lot of work. Now let me show you how great it is. Here we go!Believing that it’s nothing more than a common pan, some people may think that it’s not so difficult to create such a pan. To be honest, it’s not just a simple pan as usual, and it takes a lot of work. Now let me show you how great it is. Here we go!Maybe nobody will deny this: when baked in arectangular pan, cakes get easily overcooked at thecorners (and to a lesser extent at the edges).But neverwill this happen in a round pan. However, round pansare not the best in respects of saving finite space in anoven. How to solve this problem? This is the key pointthat our work focuses on.Up to now, as you know, there have been two factors determining the quality of apan -- the distribution of heat across the outer edge of and thespace occupied in an oven. Unfortunately, they cannot beachieved at the same time. Time calls for a perfect pan, andthen our Ultimate Brownie Pan comes into existence. TheUltimate Brownie Pan has an outstandingadvantage--optimizing a combination of the two conditions. As you can see, it’s so cute. And when you really begin to use it, you’ll find yourself really enjoy being with it. By using this kind of pan, you can use four pans in the meanwhile. That is to say you can bake more cakes at one time.So you can see that our Ultimate Brownie Pan will certainly be able to solve the two big problems disturbing so many people. And so it will! Feel good? So what are you waiting for? Own it now!。
数学建模美赛一等奖优秀论文
52888
For office use only F1 ________________ F2 ________________ F3 ________________ F4 ________________
Team #52888
Page 1 of 23
Fall in love with your bathtub
Abstract It’s pleasant to go home to take a bath with the evenly maintained temperature of hot water throughout the bathtub. This beautiful idea, however, can not be always realized by the constantly falling water temperature. Therefore, people should continually add hot water to keep the temperature even and as close as possible to the initial temperature without wasting too much water. This paper proposes a partial differential equation of the heat conduction of the bath water temperature, and an object programming model. Based on the Analytic Hierarchy Process (AHP) and Technique for Order Preference by Similarity to Ideal Solution (TOPSIS), this paper illustrates the best strategy the person in the bathtub can adopt to satisfy his desires. First, a spatiotemporal partial differential equation model of the heat conduction of the temperature of the bath water is built. According to the priority, an object programming model is established, which takes the deviation of temperature throughout the bathtub, the deviation of temperature with the initial condition, water consumption, and the times of switching faucet as the four ob jectives. To ensure the top priority objective— homogenization of temperature, the discretization method of the Partial Differential Equation model (PDE) and the analytical analysis are conducted. The simulation and analytical results all imply that the top priority strategy is: The proper motions of the person making the temperature well-distributed throughout the bathtub. Therefore, the Partial Differential Equation model (PDE) can be simplified to the ordinary differential equation model. Second, the weights for the remaining three objectives are determined based on the tolerance of temperature and the hobby of the person by applying Analytic Hierarchy Process (AHP) and Technique for Order Preference by Similarity to Ideal Solution (TOPSIS). Therefore, the evaluation model of the synthesis score of the strategy is proposed to determine the best one the person in the bathtub can adopt. For example, keeping the temperature as close as the initial condition results in the fewer number of switching faucet while attention to water consumption gives rise to the more number. Third, the paper conducts the analysis of the diverse parameters in the model to determine the best strategy, respectively, by controlling the other parameters constantly, and adjusting the parameters of the volume, shape of the bathtub and the shape, volume, temperature and the motions and other parameters of the person in turns. All results indicate that the differential model and the evaluation model developed in this paper depends upon the parameters therein. When considering the usage of a bubble bath additive, it is equal to be the obstruction between water and air. Our results show that this strategy can reduce the dropping rate of the temperature effectively, and require fewer number of switching. The surface area and heat transfer coefficient can be increased because of the motions of the person in the bathtub. Therefore, the deterministic model can be improved as a stochastic one. With the above evaluation model, this paper present the stochastic optimization model to determine the best strategy. Taking the disparity from the initial temperature as the suboptimum objectives, the result of the model reveals that it is very difficult to keep the temperature constant even wasting plentiful hot
2011年美国数学建模大赛一等奖获奖论文

Team #10076
Page 2 of 21
Contents
1 Introduction 2 Restatement of Problem 3 Basic Assumptions 4 Analysis of the Problem 4.1 Definitions of Zero-Potential Surface and “vertical 4.2 Turn Of Snowboarding . . . . . . . . . . . . . . . 4.3 Snowboarding on the Deck . . . . . . . . . . . . . 4.4 Snowboarding on the Quarter Arc . . . . . . . . . 5 “Vertical air” Model 6 Results and Sensitivity Analysis 6.1 Results . . . . . . . . . . . . . . . . . . . . . . . . . . . . . . . . . . . . . 6.2 Sensitivity Analysis . . . . . . . . . . . . . . . . . . . . . . . . . . . . . . 7 Model Applications And Analysis 7.1 Applications . . . . . . . . . . . . . . . . . . . . . . . . . . . . . . . . . . 7.2 Analysis . . . . . . . . . . . . . . . . . . . . . . . . . . . . . . . . . . . . 8 Maximum Twist Model 8.1 Analysis of Problem . . . . . . . . . . . . . . . . . . . . . . . . . . . . . 8.2 Modeling . . . . . . . . . . . . . . . . . . . . . . . . . . . . . . . . . . . . 8.3 Results and Sensitivity Analysis . . . . . . . . . . . . . . . . . . . . . . . 9 Tradeoffs to Develop a ”Practical” Course 9.1 Halfpipe Framework . . . . . . . . . . . . . . . . . . . . . . . . . . . . . 9.2 Snow in the Halfpipe . . . . . . . . . . . . . . . . . . . . . . . . . . . . . 3 3 4 6 6 7 10 10 14 16 16 16 17 17 17 18 18 18 19 20 20 20
美国大学生数学建模比赛的论文格式
ContentsⅠIntroduction (1)1.1Problem Background (1)1.2Previous Research (2)1.3Our Work (2)ⅡGeneral Assumptions (3)ⅢNotations and Symbol Description (3)3.1 Notations (4)3.2 Symbol Description (4)ⅣSpread of Ebola (5)4.1 Traditional Epidemic Model (5)4.1.1.The SEIR Model (5)4.1.2 (6)4.1.3 (6)4.2 Improved Model (7)4.2.1.The SEIHCR Model (8)4.2.2 (9)ⅤPharmaceutical Intervention (9)5.1 Total Quantity of the Medicine (10)5.1.1.Results from WHO Statistics (10)5.1.2.Results from SEIHCR Model (11)5.2 Delivery System (12)5.2.1.Locations of Delivery (13)5.2.2 (14)5.3 Speed of Manufacturing (15)ⅥOther Important Interventions (16)6.1 Safer Treatment of Corpses (17)6.2 Conclusion (18)ⅦControl and Eradication of Ebola (19)7.1 How Ebola Can Be Controlled (20)7.2 When Ebola Will Be Eradicated (21)ⅧSensitivity Analysis (22)8.1 Impact of Transmission Rate (23)8.2 Impact of the Incubation Priod (24)ⅨStrengths and Weaknesses (25)9.1 Strengths (26)9.2 Weaknesses (27)9.3 Future Work (28)Letter to the World Medical Association (30)References (31)ⅠIntroduction1.1.Promblem Background1.2.Previous Research1.3.Our WorkⅡGeneral Assumptions●●ⅢNotations and Symbol Description3.1. Notataions3.2. Symbol DescriptionSymbol DescriptionⅣSpread of Ebola4.1. Traditional Epidemic Model4.1.1. The SEIR Model4.1.2. Outbreak Data4.1.3. Reslts of the SEIR Model4.2. Improved Model4.2.1. The SEIHCR Model4.2.2. Choosing paametersⅤPharmaceutical Intervention 5.1. Total Quantity of the Medicine 5.1.1. Results from WHO Statistics5.2. Delivery System5.2.1. Locations of Delivery5.2.2. Amount of Delivery5.3. Speed of Manufacturong5.4. Medicine EfficacyⅥOther Important Interventions 6.1. Safer Treatment of Corpses6.2. ConclusionⅦControl and Eradication of Ebola 7.1. How Ebola Can Be Controlled7.2. When Ebola Will Be EradicatedⅧSensitivity Analysis8.1. Impact of Transmission Rate8.2. Impact of Incubation PeriodⅨStrengths and Weaknesses 9.1. Strengths●●●9.2. Weaknesses●●●9.3.Future WorkLetter to the World Medical AssociationTo whom it may concern,Best regards,Team #32150References [1][2][3][4]。
建模美赛获奖范文
建模美赛获奖范文标题:《探索与创新:建模美赛获奖作品范文解析》建模美赛(MCM/ICM)是全球大学生数学建模竞赛的盛事,每年都吸引了众多优秀的学生参与。
在这个舞台上,获奖作品往往展现了卓越的数学建模能力、创新思维和问题解决技巧。
本文将解析一份获奖范文,带您领略建模美赛获奖作品的风采。
一、背景与问题阐述(此处详细描述范文所针对的问题背景、研究目的和意义,以及问题的具体阐述。
)二、模型建立与假设1.模型分类与选择:根据问题特点,范文选择了适当的模型进行研究和分析。
2.假设条件:明确列出建模过程中所做的主要假设,并解释其合理性。
三、模型求解与结果分析1.数据收集与处理:介绍范文中所用数据来源、处理方法及有效性验证。
2.模型求解:详细阐述模型的求解过程,包括算法选择、计算步骤等。
3.结果分析:对求解结果进行详细分析,包括图表展示、敏感性分析等。
四、模型优化与拓展1.模型优化:针对原模型存在的问题,范文提出了相应的优化方案。
2.拓展研究:对模型进行拓展,探讨其在其他领域的应用和推广价值。
五、结论与建议1.结论总结:概括范文的研究成果,强调其创新点和贡献。
2.实践意义:分析建模结果在实际问题中的应用价值和意义。
3.建议:针对问题解决,提出具体的建议和措施。
六、获奖亮点与启示1.创新思维:范文在模型选择、求解方法等方面展现出创新性。
2.严谨论证:文章结构清晰,逻辑严密,数据充分,论证有力。
3.团队合作:建模美赛强调团队协作,范文体现了成员间的紧密配合和分工合作。
总结:通过分析这份建模美赛获奖范文,我们可以学到如何从问题背景出发,建立合理的模型,进行严谨的求解和分析,以及如何优化和拓展模型。
同时,也要注重创新思维和团队合作,才能在建模美赛中脱颖而出。
美国大学生数学建模大赛优秀论文一等奖摘要
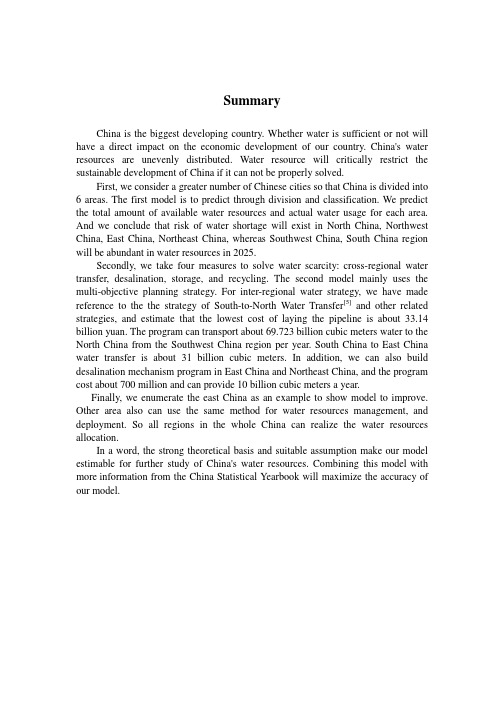
SummaryChina is the biggest developing country. Whether water is sufficient or not will have a direct impact on the economic development of our country. China's water resources are unevenly distributed. Water resource will critically restrict the sustainable development of China if it can not be properly solved.First, we consider a greater number of Chinese cities so that China is divided into 6 areas. The first model is to predict through division and classification. We predict the total amount of available water resources and actual water usage for each area. And we conclude that risk of water shortage will exist in North China, Northwest China, East China, Northeast China, whereas Southwest China, South China region will be abundant in water resources in 2025.Secondly, we take four measures to solve water scarcity: cross-regional water transfer, desalination, storage, and recycling. The second model mainly uses the multi-objective planning strategy. For inter-regional water strategy, we have made reference to the the strategy of South-to-North Water Transfer[5]and other related strategies, and estimate that the lowest cost of laying the pipeline is about 33.14 billion yuan. The program can transport about 69.723 billion cubic meters water to the North China from the Southwest China region per year. South China to East China water transfer is about 31 billion cubic meters. In addition, we can also build desalination mechanism program in East China and Northeast China, and the program cost about 700 million and can provide 10 billion cubic meters a year.Finally, we enumerate the east China as an example to show model to improve. Other area also can use the same method for water resources management, and deployment. So all regions in the whole China can realize the water resources allocation.In a word, the strong theoretical basis and suitable assumption make our model estimable for further study of China's water resources. Combining this model with more information from the China Statistical Yearbook will maximize the accuracy of our model.。
2016年美国大学生数学建模竞赛题论文

2016
MCM/ICM Summary Sheet (Your team's summary should be included as the first page of your electronic submission.) Type a summary of your results on this page. Do not include the name of your school, advisor, or team members on this page.
For office use only T1 ________________ T2 ________________ T3 ________________ T4 ________________
Team Control Number
52557
Problem Chosen
E
For office use only_ F3 ________________ F4 ________________
Team # 52557
i
Contents
1 Introduction ........................................................................................................................................... 1 1.1 Problem Statement..........................................................................................................................1 1.2 Problem Analysis............................................................................................................................1 1.2.1 Task 1 Analysis ........................................................................................................................ 1 1.2.2 Task 2 Analysis ........................................................................................................................ 1 1.2.3 Task 3 Analysis ........................................................................................................................ 2 1.2.4 Task 4 Analysis ........................................................................................................................ 2 1.2.5 Task 4 and 5 Analysis .............................................................................................................. 2