压力传感器外文翻译
Honeywell 压力传感器(Jackson Union压力传感器)产品说明书

(casing and cementing) are vital oil and gas processes that utilize pressure sensors for measurement and monitoring functions.APPLICATIONSHoneywell Wing Union pressure sensors (also known as Hammer Union pressure sensors outside of the United States) are widely used by oil and gas companies to measure pressure level changes in media circulation systems.Oil Mud LoggingFor example, oil mud loggingapplications (see Figure 1) require a series of pressure sensors to be connected to the drilling apparatus and installed in specialized equipment to monitor or “log” the drill’s activity. Logging While Drilling (LWD) and Measurement While Drilling (MWD)pump into the well), mud pumps (for pressure monitoring of incoming and outgoing media to protect the mudpump and drill bit), and return line choke manifold (for pressure monitoring of the return line carrying the mud plus cuttings).During the mud logging process, pumps send drilling media throughout the circulation system, down to the drilling bit, and then return the bit’s cuttings to the surface for analysis and disposal. Honeywell’s wing union/hammer union pressure sensors help detect pressure level changes in the media circulation system, which can indicate changing conditions being encountered downhole by the drill bit, thus allowing the operator to quickly make adjustments to the drilling mixture pressure or drilling process as needed.today’s oil and gas industry, used for many types Models 434, 435, 437 Wing Union/ Hammer Union Pressure TransducerPRESSURE SENSORS FOROIL & GASApplication NoteFracturing, Acidizing, and Cementing Honeywell’s Wing Union/Hammer Union pressure sensors are also used during fracturing, acidizing, and cementing applications for similar pressure monitoring and control purposes.SOLUTIONSHoneywell Wing Union/Hammer Union Pressure Sensors are built ruggedand oilfield tough to stand up to the rigorous demands of oil and gas drilling applications and environments. They have the sensitivity to ensure precise, reliable measurements every time, optimize drilling operation, reduce downtime, and maximize productivity. Durable ConstructionModels 434, 435, and 437 are constructed on Honeywell’s time proven all-welded, one-piece design, with the sensor diaphragm and Weco® 1502, 2202 Wing Union compatible fitting form factor machined as one part. This one-piece design provides a hermetically sealed unit, reducing the chanceof media leakage into the sensitive electronic components, and increasing overall reliability. The isolated, pressure sensing diaphragm minimizes zero-shift during hammer up and also eliminates long term, signal drift in the field, making it easier to install and providing reliable pressure readings over time.The sensor diaphragm is machined from Inconel® 718, which provides additional durability with highly abrasive and corrosive media, and is weldedto the main stainless steel body. The stainless steel electrical connection provides enhanced secondary pressure containment, with multiple electricalconnector options from which to choose.Optional 1-Wire or 2-Wire ShuntCalibrationModels 434, 435, and 437 providean optional 1-wire or 2-wire shuntcalibration. When a customer sends asignal to the wing union/hammer unionfrom their instrumentation, anothersignal will be returned to validate thefunctionality of the unit. This providesconfidence in the pressure readingsduring normal operation.Optional Protective CageModels 434, 435, and 437 are alsoavailable with an optional protectivecage which provides extra electricalconnection protection and durability.Various Accuracy Levels• Model 434: 0.2 %FSS BFSL• Model 435: High accuracy±0.1 %FSS BFSL orstandard accuracy ±0.2 %FSS BFSL• Model 437: Standard accuracy±0.2 %FSS BFSLModel 437 feature a wider aperturedesign than the other models that isuseful for customers utilizing moreviscous media in certain applications,enabling uniform flow of differentviscous media through the criticalsensing area and helping to maintainconsistent accuracy.*Best Fit Straight LineBENEFITS• Higher ±0.1 %FSS BFSL Accuracy(Model 435): Provides additionalconfidence in the actual measuredpressure value, particularly forsmaller changes in pressure, thusallowing the operator to makequicker adjustments to drillingoperations for more precise controland increased efficiency duringextraction• Wider Aperture Design (Model 437):Wider than Models 434 and 435,helping to prevent media cloggingwhen using more viscous mediablends• Reliability/Durability: All-welded,hermetically sealed, stainless steelconstruction with Inconel® 718wetted parts isolate corrosive orabrasive drilling media from sensitiveinternal electronics; materials retainstrength in higher temperatures toprovide reliable performance underdemanding conditions; shock andvibration tested, intrinsically saferating• Easy Installation/Serviceability:Designed for quick field installation,including horizontal or verticalmounting; field-repairableconnectors; zero and spanadjustments can be accessed byremoving the electrical connector,thus preventing ingress failures anddeterring tampering; 1-wire or 2-wireshunt calibration allow the user todetermine if the wing union/hammerunion is still functional in the field,or if it has to be removed for service/calibration.2 APPLICATION NOTE | Wing Union/Hammer Union Pressure Transducers | /astAPPLICATION NOTE | Wing Union/Hammer Union Pressure Transducers | /ast 3SELECTION GUIDEHoneywell offers three models from which to choose:üüü üüü üüü* Note: See Wing Union pressure sensor datasheet for more agency approval classifications.For more information about Wing Union/Hammer Union pressure sensors, including nomenclature and dimensional drawings, see our datasheet.008875-6-EN | 6 | 10/21© 2021 Honeywell International Inc. All rights reserved.HoneywellAdvanced Sensing Technologies 830 East Arapaho Road Richardson, TX 75081WARRANTY/REMEDYHoneywell warrants goods of its manufacture as being free of defective materials and faulty workmanship during the applicablewarranty period. Honeywell’s standard product warranty applies unless agreed to otherwise by Honeywell in writing; please refer to your order acknowledgement or consult your local sales office for specific warranty details. If warranted goods are returned to Honeywell during the period of coverage, Honeywell will repair or replace, at its option, without charge those items that Honeywell, in its sole discretion, finds defective. The foregoing is buyer’s sole remedy and is in lieu of all other warranties, expressed or implied, including those of merchantability and fitness for a particular purpose. In no event shall Honeywell be liable for consequential, special, or indirect damages.While Honeywell may provide application assistance personally, through our literature and the Honeywell web site, it is buyer’s sole responsibility to determine the suitability of the product in the application.Specifications may change without notice. The information we supply is believed to be accurate and reliable as of this writing.However, Honeywell assumes no responsibilityfor its use.FOR MORE INFORMATIONHoneywell Advanced Sensing Technolo-gies services its customers through a worldwide network of sales offices and distributors. For application assistance, current specifications, pricing, or the nearest Authorized Distributor, visit /ast or call:USA/Canada +302 327 8920Latin America +1 305 805 8188Europe +1 302 327 8920Japan +81 (0) 3-6730-7152Singapore +65 6355 2828Greater China+86 4006396841。
传感器技术论文中英文对照资料外文翻译文献
传感器技术论文中英文对照资料外文翻译文献Development of New Sensor TechnologiesSensors are devices that can convert physical。
chemical。
logical quantities。
etc。
into electrical signals。
The output signals can take different forms。
such as voltage。
current。
frequency。
pulse。
etc。
and can meet the requirements of n n。
processing。
recording。
display。
and control。
They are indispensable components in automatic n systems and automatic control systems。
If computers are compared to brains。
then sensors are like the five senses。
Sensors can correctly sense the measured quantity and convert it into a corresponding output。
playing a decisive role in the quality of the system。
The higher the degree of n。
the higher the requirements for sensors。
In today's n age。
the n industry includes three parts: sensing technology。
n technology。
and computer technology。
传感器的基础知识中英文对照外文翻译文献

中英文对照外翻译Basic knowledge of transducersA transducer is a device which converts the quantity being measured into an optical, mechanical, or-more commonly-electrical signal. The energy-conversion process that takes place is referred to as transduction.Transducers are classified according to the transduction principle involved and the form of the measured. Thus a resistance transducer for measuring displacement is classified as a resistance displacement transducer. Other classification examples are pressure bellows, force diaphragm, pressure flapper-nozzle, and so on.1、Transducer ElementsAlthough there are exception ,most transducers consist of a sensing element and a conversion or control element. For example, diaphragms,bellows,strain tubes and rings, bourdon tubes, and cantilevers are sensing elements which respond to changes in pressure or force and convert these physical quantities into a displacement. This displacement may then be used to change an electrical parameter such as voltage, resistance, capacitance, or inductance. Such combination of mechanical and electrical elements form electromechanical transducing devices or transducers. Similar combination can be made for other energy input such as thermal. Photo, magnetic and chemical,giving thermoelectric, photoelectric,electromaanetic, and electrochemical transducers respectively.2、Transducer SensitivityThe relationship between the measured and the transducer output signal is usually obtained by calibration tests and is referred to as the transducer sensitivity K1= output-signal increment / measured increment . In practice, the transducer sensitivity is usually known, and, by measuring the output signal, the input quantity is determined from input= output-signal increment / K1.3、Characteristics of an Ideal TransducerThe high transducer should exhibit the following characteristicsa) high fidelity-the transducer output waveform shape be a faithful reproduction of the measured; there should be minimum distortion.b) There should be minimum interference with the quantity being measured; the presence of the transducer should not alter the measured in any way.c) Size. The transducer must be capable of being placed exactly where it is needed.d) There should be a linear relationship between the measured and the transducer signal.e) The transducer should have minimum sensitivity to external effects, pressure transducers,for example,are often subjected to external effects such vibration and temperature.f) The natural frequency of the transducer should be well separated from the frequency and harmonics of the measurand.4、Electrical TransducersElectrical transducers exhibit many of the ideal characteristics. In addition they offer high sensitivity as well as promoting the possible of remote indication or mesdurement. Electrical transducers can be divided into two distinct groups:a) variable-control-parameter types,which include:i)resistanceii) capacitanceiii) inductanceiv) mutual-inductance typesThese transducers all rely on external excitation voltage for their operation.b) self-generating types,which includei) electromagneticii)thermoelectriciii)photoemissiveiv)piezo-electric typesThese all themselves produce an output voltage in response to the measurand input and their effects are reversible. For example, a piezo-electric transducer normally produces an output voltage in response to the deformation of a crystalline material; however, if an alternating voltage is applied across the material, the transducer exhibits the reversible effect by deforming or vibrating at the frequency of the alternating voltage.5、Resistance TransducersResistance transducers may be divided into two groups, as follows:i) Those which experience a large resistance change, measured by using potential-divider methods. Potentiometers are in this group.ii)Those which experience a small resistance change, measured by bridge-circuit methods. Examples of this group include strain gauges and resistance thermometers.5.1 PotentiometersA linear wire-wound potentiometer consists of a number of turns resistance wire wound around a non-conducting former, together with a wiping contact which travels over the barwires. The construction principles are shown in figure which indicate that the wiperdisplacement can be rotary, translational, or a combination of both to give a helical-type motion. The excitation voltage may be either a.c. or d.c. and the output voltage is proportional to the input motion, provided the measuring device has a resistance which is much greater than the potentiometer resistance.Such potentiometers suffer from the linked problem of resolution and electrical noise. Resolution is defined as the smallest detectable change in input and is dependent on thecross-sectional area of the windings and the area of the sliding contact. The output voltage is thus a serials of steps as the contact moves from one wire to next.Electrical noise may be generated by variation in contact resistance, by mechanical wear due to contact friction, and by contact vibration transmitted from the sensing element. In addition, the motion being measured may experience significant mechanical loading by the inertia and friction of the moving parts of the potentiometer. The wear on the contacting surface limits the life of a potentiometer to a finite number of full strokes or rotations usually referred to in the manufacture’s specification as the ‘number of cycles of life expectancy’, a typical value being 20*1000000 cycles.The output voltage V0 of the unload potentiometer circuit is determined as follows. Let resistance R1= xi/xt *Rt where xi = input displacement, xt= maximum possible displacement, Rt total resistance of the potentiometer. Then output voltage V0= V*R1/(R1+( Rt-R1))=V*R1/Rt=V*xi/xt*Rt/Rt=V*xi/xt. This shows that there is a straight-line relationship between output voltage and input displacement for the unloaded potentiometer.It would seen that high sensitivity could be achieved simply by increasing the excitation voltage V. however, the maximum value of V is determined by the maximum power dissipation P of the fine wires of the potentiometer winding and is given by V=(PRt)1/2 .5.2 Resistance Strain GaugesResistance strain gauges are transducers which exhibit a change in electrical resistance in response to mechanical strain. They may be of the bonded or unbonded variety .a) bonded strain gaugesUsing an adhesive, these gauges are bonded, or cemented, directly on to the surface of the body or structure which is being examined.Examples of bonded gauges arei) fine wire gauges cemented to paper backingii) photo-etched grids of conducting foil on an epoxy-resin backingiii)a single semiconductor filament mounted on an epoxy-resin backing with copper or nickel leads.Resistance gauges can be made up as single elements to measuring strain in one direction only,or a combination of elements such as rosettes will permit simultaneous measurements in more than one direction.b) unbonded strain gaugesA typical unbonded-strain-gauge arrangement shows fine resistance wires stretched around supports in such a way that the deflection of the cantilever spring system changes the tension in the wires and thus alters the resistance of wire. Such an arrangement may be found in commercially available force, load, or pressure transducers.5.3 Resistance Temperature TransducersThe materials for these can be divided into two main groups:a) metals such as platinum, copper, tungsten, and nickel which exhibit and increase in resistance as the temperature rises; they have a positive temperature coefficient of resistance.b) semiconductors, such as thermistors which use oxides of manganese, cobalt, chromium, or nickel. These exhibit large non-linear resistance changes with temperature variation and normally have a negative temperature coefficient of resistance.a) metal resistance temperature transducersThese depend, for many practical purpose and within a narrow temperature range, upon the relationship R1=R0*[1+a*(b1-b2)] where a coefficient of resistance in ℃-1,and R0 resistance in ohms at the reference temperature b0=0℃ at the reference temperature range ℃.The international practical temperature scale is based on the platinum resistance thermometer, which covers the temperature range -259.35℃ to 630.5℃.b) thermistor resistance temperature transducersThermistors are temperature-sensitive resistors which exhibit large non-liner resistance changes with temperature variation. In general, they have a negative temperature coefficient. For small temperature increments the variation in resistance is reasonably linear; but, if large temperature changes are experienced, special linearizing techniques are used in the measuring circuits to produce a linear relationship of resistance against temperature.Thermistors are normally made in the form of semiconductor discs enclosed in glass vitreous enamel. Since they can be made as small as 1mm,quite rapid response times are possible.5.4 Photoconductive CellsThe photoconductive cell , uses a light-sensitive semiconductor material. The resistance between the metal electrodes decrease as the intensity of the light striking the semiconductor increases. Common semiconductor materials used for photo-conductive cells are cadmium sulphide, lead sulphide, and copper-doped germanium.The useful range of frequencies is determined by material used. Cadmium sulphide is mainly suitable for visible light, whereas lead sulphide has its peak response in the infra-red regionand is, therefore , most suitable for flame-failure detection and temperature measurement. 5.5 Photoemissive CellsWhen light strikes the cathode of the photoemissive cell are given sufficient energy to arrive the cathode. The positive anode attracts these electrons, producing a current which flows through resistor R and resulting in an output voltage V.Photoelectrically generated voltage V=Ip.RlWhere Ip=photoelectric current(A),and photoelectric current Ip=Kt.BWhere Kt=sensitivity (A/im),and B=illumination input (lumen)Although the output voltage does give a good indication of the magnitude of illumination, the cells are more often used for counting or control purpose, where the light striking the cathode can be interrupted.6、Capacitive TransducersThe capacitance can thus made to vary by changing either the relative permittivity, the effective area, or the distance separating the plates. The characteristic curves indicate that variations of area and relative permittivity give a linear relationship only over a small range of spacings. Thus the sensitivity is high for small values of d. Unlike the potentionmeter, the variable-distance capacitive transducer has an infinite resolution making it most suitable for measuring small increments of displacement or quantities which may be changed to produce a displacement.7、Inductive TransducersThe inductance can thus be made to vary by changing the reluctance of the inductive circuit. Measuring techniques used with capacitive and inductive transducers:a)A.C. excited bridges using differential capacitors inductors.b)A.C. potentiometer circuits for dynamic measurements.c) D.C. circuits to give a voltage proportional to velocity for a capacitor.d) Frequency-modulation methods, where the change of C or L varies the frequency of an oscillation circuit.Important features of capacitive and inductive transducers are as follows:i)resolution infiniteii) accuracy+- 0.1% of full scale is quotediii)displacement ranges 25*10-6 m to 10-3miv) rise time less than 50us possibleTypical measurands are displacement, pressure, vibration, sound, and liquid level.8、Linear Variable-differential Ttransformer9、Piezo-electric Transducers10、Electromagnetic Transducers11、Thermoelectric Transducers12、Photoelectric Cells13、Mechanical Transducers and Sensing Elements传感器的基础知识传感器是一种把被测量转换为光的、机械的或者更平常的电信号的装置。
电容式传感器的外文文献翻译、中英文翻译、外文翻译
参考资料原文:Capacitive sensors and the main features of the basic concepts: The measured volume of the machinery, such as displacement, pressure change is converted to the sensor capacitance. It is the sensitive part of the capacitor with variable parameters. Its most common form is composed of two parallel electrodes, a very inter-air as the medium of the capacitor, if the neglect edge effects, the capacitance for the capacitor plate ε A / δ, where εis a very inter-medium dielectric constant, A two electrode effective area covered by each other, δ is the distance between two electrodes. δ, A, εone of the three parameters will lead to the change in capacitance changes can be used for measurement. Therefore capacitive sensors can be divided into polar distance change type, change type size, media type three types of changes.Most from the changes in small type generally used to measure the linear displacement, or as a result of force, pressure, vibration caused by changes in polar distance (see capacitive pressure sensors). Change type size generally used to measure the angular displacement or linear displacement larger. Changes in media type commonly used in level measurement and a variety of media, temperature, density, humidity measurement. The advantage of the sensor capacitor structure is simple, inexpensive, high sensitivity,过载能力strong, good dynamic response and high temperature, radiation, vibration and other adverse conditions of strong adaptability and strong. The disadvantage is that there are non-linear output, parasitic capacitance and the distributed capacitance on the sensitivity and accuracy the impact of larger and more complex circuits, such as connectivity. Since the late 70s, with the development of integrated circuit technology, a packaging and micro-measuring instrument with capacitive sensors.This new type of distributed capacitance sensors can greatly reduce the impact to overcome the inherent drawbacks. Capacitive sensor is a very wide use, a great potential for development of the sensor.Capacitive sensor working principle:Capacitive sensor surface of the induction of two coaxial metal electrode composition, much like "open" capacitor electrode, the two electrodes form a capacitor, in series with the RC oscillation circuit. Power when connected, RC oscillator is notoscillating, when a goal of moving around electrical capacitor, the capacitor capacity increased, the oscillator to start oscillation. Circuit after the passage of the deal, will be two kinds of vibration and vibration signals into switching signals, which played a detection purpose of the existence of any objects. The sensor can detect metal objects, but also to detect non-metallic objects, metal objects can move away from the largest, non-metallic objects on the decision to move away from the dielectric constant material, the greater the dielectric constant materials, the availability of action the greater distance.Application of capacitive sensors:Capacitive sensor can be used to measure linear displacement, angular displacement, vibration amplitude, especially suitable for measuring high-frequency vibration amplitude, precision rotary axis accuracy, acceleration and other mechanical parameters. Pole-changing type of application from a smaller displacement in the measurement range to several hundred microns in 0.01m, precision can reach 0.01m, a resolution of up to 0.001m. Change type size larger displacement can be measured, for the zero-range a few millimeters to a few hundred mm, 0.5 percent better than the linear resolution of 0.01 ~ 0.001m. Capacitive angular displacement sensor point of view and the dynamic range to a few degrees, a resolution of about 0.1 "up to the stability of the zero angle-second, widely used in precision angle measurement, such as for high-precision gyroscopes and accelerometers tilting . capacitive measurement sensor can measure the peak amplitude for the 0 ~ 50m, a frequency of 10 ~ 2kHz, sensitivity is higher than 0.01m, non-linear error of less than 0.05m.Capacitive sensor can also be used to measure pressure, differential pressure, level, surface, composition content (such as oil, the water content of food), non-metallic coating materials, such as film thickness, dielectric measurements of humidity, density, thickness, etc., in the automatic detection and control systems are also often used as a location signal generator. Capacitive differential pressure sensor measuring range up to 50MPa, an accuracy of ± 0.25% ~ ± 0.5%. Capacitive sensor for measuring range of the thickness of a few hundred microns, resolution of up to 0.01m. Capacitive Proximity Switches can not only detect metal, but also can detect plastic, wood,paper, and other dielectric liquids, but can not achieve the ultra-small, the movement distance of about 10 ~ 20mm. Electrostatic capacitive level switch is widely used in detection is stored in the tank, hopper, such as the location of containers in a variety of objects of a mature product. When the capacitive sensor measuring metal surface conditions, from the size, vibration amplitude is often used very variable from unilateral type, when the measured object is a capacitor electrode, and the other electrode in the sensor inside. This type of sensor is a non-contact measurement, dynamic range is relatively small, about a few millimeters is about the precision of more than 0.1m, a resolution of 0.01 ~ 0.001m.译文:电容式传感器的基本概念及主要特点:把被测的机械量,如位移、压力等转换为电容量变化的传感器。
韩国all sensor压力传感器
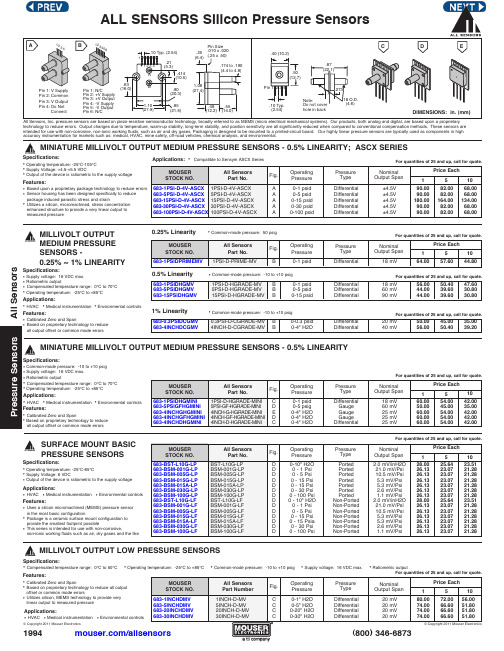
l l S e n s o r s1994ALL SENSORS Silicon Pressure Sensorstechnology to reduce errors. Output changes due to temperature, warm-up stability, long-term stability, and position sensitivity are all significantly reduced when compared to conventional compensation methods. These sensors are intended for use with non-corrosive, non-ionic working fluids, such as air and dry gases. Packaging is designed to be mounted to a printed-circuit board. Our highly linear pressure sensors are typically used as components in high accuracy instrumentation for markets such as: medical, HVAC, mine safety, off-road vehicles, chemical analysis, and environmental.MILLIVOLT OUTPUT MEDIUM PRESSURE SENSORS -0.25% ~ 1% LINEARITY• Common-mode pressure: 50 psigSpecifications:• Supply voltage: 16 VDC max. • Ratiometric output• Compensated temperature range: 0°C to 70°C • Operating temperature: -25°C to +85°C0.25% Linearity1% LinearityCommon-mode pressure: -10 to +10 psigSURFACE MOUNT BASIC PRESSURE SENSORSFeatures:• Uses a silicon micromachined (MEMS) pressure sensorin the most basic configuration• Package is a ceramic surface mount configuration to provide the smallest footprint possible• This series is intended for use with non-corrosive,non-ionic working fluids such as air, dry gases and the likeSpecifications:• Operating temperature: -25°C-85°C• Supply Voltage: 6 VDC• Output of the device is ratiometric to the supply voltageMINIATURE MILLIVOLT OUTPUT MEDIUM PRESSURE SENSORS - 0.5% LINEARITY; ASCX SERIESFeatures:• Based upon a proprietary package technology to reduce errors • Sensor housing has been designed specifically to reducepackage induced parasitic stress and strain• Utilizes a silicon, micromachined, stress concentration enhanced structure to provide a very linear output to measured pressureSpecifications:• Operating temperature: -25°C-105°C • Supply Voltage: +4.5-+5.5 VDC• Output of the device is ratiometric to the supply voltageApplications: Compatible to Sensym ASCX SeriesApplications:• HVAC • Medical instrumentation • Environmental controls MILLIVOLT OUTPUT LOW PRESSURE SENSORSSpecifications:• Compensated temperature range: 0°C to 50°C • Operating temperature: -25°C to +85°C • Common-mode pressure: -10 to +10 psig • Supply voltage: 16 VDC max. • Ratiometric outputFeatures:• Calibrated Zero and Span• Based on proprietary technology to reduce all output offset or common mode errors• Utilizes silicon, MEMS technology to provide very linear output to measured pressureApplications:• HVAC • Medical instrumentation • Environmental controlsApplications:• HVAC • Medical instrumentation • Environmental controls © Copyright 2011 Mouser Electronics。
智能压力传感器外文翻译文献

智能压力传感器外文翻译文献(文档含中英文对照即英文原文和中文翻译)译文:基于C8051F350的智能压力传感器的设计摘要为了克服传统的压力传感器的缺陷。
设计一种智能压力传感器,根据组合物的应用范围的智能传感器系统中,进行温度校正,充分考虑共同的组件之间的连接参数协调,我们选择了一个良好的可用性、高可靠性和低成本元件,80C51单片机进行控制和处理,对于整个测量系统组成而言,该系统具有自动测量、放大、A / D转换的温度和压力参数、微弱信号的锁定放大、相敏检波(PSD)、共模信号抑制、采集到的信号消噪处理、交叉敏感的脱钩的功能,并能够将结果显示,它还具有自动自检、温度补偿和上侧的通信和其它功能。
关键词:压力传感器,锁-放大器;80C51F350的单片机硬件电路手稿编号:1674-8042(2011)02-0157-04DIO:10.3969/j.issn.1674-8042.2011.02.141 引言随着时代的发展,电子计算机,自动化生产,调制解调器信息,军工,交通运输,化工,环保,能源,海洋开发,遥感,空间科学与技术,传感器的需求越来越大的发展,其应用已渗透进入该地区国民经济各个部门和人们的日常的日常文化生活。
可以说,从太空到海洋,从各种复杂的工程系统的基本日常生活的必需品不能分开从各种传感器,传感器技术,为国民经济的日益发展,起着巨大的作用。
然而。
目前市场上销售的智能传感器有许多不足之处,如单天资讯指标和质量参差不齐。
这样的设计总结了上述缺陷,以往的经验的基础上,使用锁相放大器,相敏检波,并巧妙地解决了有用信号从噪声中提取的低缺陷和问题的去耦的交叉灵敏度和使用的技术双电源供应电力,以及提高系统性能,增加新的故障诊断和使用一个共同的数字的接口技术和国际市场的通信协议等。
因此,有非常广阔的应用前景。
2 系统硬件设计智能传感器的传感器_信息的检测和处理。
智能传感器包括收集,处理,交流信息的功能。
它是集成传感器和微处理器的产品的组合。
传感器英文翻译

1、Accelerometer Principles67 ratings | 4.01 out of 5| Print DocumentOverviewThis tutorial is part of the National Instruments Measurement Fundamentals series. Each tutorial in this series will teach you a specific topic of common measurement applications by explaining theoretical concepts and providing practical examples. There are several physical processes that can be used to develop a sensor to measure acceleration. In applications that involve flight, such as aircraft and satellites, accelerometers are based on properties of rotating masses. In the industrial world, however, the most common design is based on a combination of Newton's law of mass acceleration and Hooke's law of spring action.Table of Contents1.Spring-Mass System2.Natural Frequency and Damping3.Vibration Effects4.Relevant NI Products5.Buy the BookSpring-Mass SystemNewton's law simply states that if a mass, m, is undergoing an acceleration, a, then there must be a force F acting on the mass and given by F = ma. Hooke's law states that if a spring of spring constant k is stretched (extended) from its equilibrium position for a distance D x, then there must be a force acting on the spring given by F = kDx.FIGURE 5.23 The basic spring-mass system accelerometer.In Figure 5.23a we have a mass that is free to slide on a base. The mass is connected to the base by a spring that is in its unextended state and exerts no force on the mass. In Figure 5.23b, the whole assembly is accelerated to the left, as shown. Now the spring extends in order to provide the force necessary to accelerate the mass. This condition is described by equating Newton's and Hooke's laws:ma = kDx(5.25)where k = spring constant in N/mDx = spring extension in mm = mass in kga= acceleration in m/s2Equation (5.25) allows the measurement of acceleration to be reduced to a measurement of spring extension (linear displacement) becauseIf the acceleration is reversed, the same physical argument would apply, except that the spring is compressed instead of extended. Equation (5.26) still describes the relationship between spring displacement and acceleration.The spring-mass principle applies to many common accelerometer designs. The mass that converts the acceleration to spring displacement is referred to as the test mass or seismic mass. We see, then, that acceleration measurement reduces to linear displacement measurement; most designs differ in how this displacement measurement is made.Natural Frequency and DampingOn closer examination of the simple principle just described, we findanother characteristic of spring-mass systems that complicates the analysis. In particular, a system consisting of a spring and attached mass always exhibits oscillations at some characteristic natural frequency. Experience tells us that if we pull a mass back and then release it (in the absence of acceleration), it will be pulled back by the spring, overshoot the equilibrium, and oscillate back and forth. Only friction associated with the mass and base eventually brings the mass to rest. Any displacement measuring system will respond to this oscillation as if an actual acceleration occurs. This natural frequency is given bywhere f N= natural frequency in Hzk = spring constant in N/mm = seismic mass in kgThe friction that eventually brings the mass to rest is defined by a damping coefficient , which has the units of s-1. In general, the effect of oscillation is called transient response, described by a periodic damped signal, as shown in Figure 5.24, whose equation isX T (t) = Xoe-µt sin(2p f N t) (5.28)where Xr(t) = transient mass positionXo= peak position, initiallyµ = damping coefficientfN= natural frequencyThe parameters, natural frequency, and damping coefficient in Equation (5.28) have a profound effect on the application of accelerometers.Vibration EffectsThe effect of natural frequency and damping on the behavior of spring-mass accelerometers is best described in terms of an applied vibration. If the spring-mass system is exposed to a vibration, then the resultant acceleration of the base is given by Equation (5.23)a(t) = -w2xosin wtIf this is used in Equation (5.25), we can show that the mass motion is given bywhere all terms were previously denned and w= 2p f, with/the applied frequency.FIGURE 5.24 A spring-mass system exhibits a natural oscillation with damping as response to an impulse input.FIGURE 5.25 A spring-mass accelerometer has been attached to a table which is exhibiting vibration. The table peak motion is xand the mass motionois D x.To make the predictions of Equation (5.29) clear, consider the situation presented in Figure 5.25. Our model spring-mass accelerometer has been fixed to a table that is vibrating. The x o in Equation (5.29) is the peak amplitude of the table vibration, and Dx is the vibration of the seismic mass within the accelerometer. Thus, Equation (5.29) predicts that the seismic-mass vibration peak amplitude varies as the vibration frequency squared, but linearly with the table-vibration amplitude. However, this result was obtained without consideration of the spring-mass system natural vibration. When this is taken into account, something quite different occurs.Figure 5.26a shows the actual seismic-mass vibration peak amplitude versus table-vibration frequency compared with the simple frequency squared prediction.You can see that there is a resonance effect when the table frequency equals the natural frequency of the accelerometer, that is, the value of Dx goes through a peak. The amplitude of the resonant peak is determined by the amount of damping. The seismic-mass vibration is described by Equation (5.29) only up to about f N/2.5.Figure 5.26b shows two effects. The first is that the actual seismic-mass motion is limited by the physical size of the accelerometer. It will hit"stops" built into the assembly that limit its motion during resonance. The figure also shows that for frequencies well above the natural frequency, the motion of the mass is proportional to the table peak motion, , but not to the frequency. Thus, it has become a displacement sensor. xoTo summarize:1. f < f N- For an applied frequency less than the natural frequency, the natural frequency has little effect on the basic spring-mass response given by Equations (5.25) and (5.29). A rule of thumb states that a safe maximum applied frequency is f < 1/2.5f N.-For an applied frequency much larger than the natural frequency, 2. f > fNthe accelerometer output is independent of the applied frequency. As shown in Figure 5.26b, the accelerometer becomes a measure of vibration displacement xof Equation (5.20) under these circumstances. It isointeresting to note that the seismic mass is stationary in space in this case, and the housing, which is driven by the vibration, moves about the mass. A general rule sets f > 2.5 f N for this case.Generally, accelerometers are not used near the resonance at their natural frequency because of high nonlinearities in output.FIGURE 5.26 In (a) the actual response of a spring-mass system to vibration is compared to the simple w2prediction In (b) the effect of various table peak motion is shownEXAMPLE 5.14An accelerometer has a seismic mass of 0.05 kg and a spring constant of 3.0 X 10³N/m Maximum mass displacement is ±0 02 m (before the mass hits the stops). Calculate (a) the maximum measurable acceleration in g, and (b) the natural frequency.SolutionWe find the maximum acceleration when the maximum displacement occurs, from Equation (5.26).a.or becauseb. The natural frequency is given by Equation (5.27).2、Measuring Pressure with Pressure Sensors79 ratings | 4.00 out of 5| Print DocumentOverviewThis tutorial is part of the National Instruments Measurement Fundamentals series. Each tutorial in this series will teach you a specific topic of common measurement applications by explaining theoretical concepts and providing practical examples. This tutorial introduces and explains the concepts and techniques of measuring pressure with pressure sensors.For more information, return to the NI Measurement Fundamentals Main Page. Table of Contents1.What is Pressure?2.The Pressure Sensor3.Pressure Measurement4.Signal Conditioning for Pressure Sensors5.DAQ Systems for Pressure Measurements6.ReferencesWhat is Pressure?Pressure is defined as force per unit area that a fluid exerts on its surroundings.[1] For example, pressure, P, is a function of force, F, and area, A.P = F/AA container full of gas contains innumerable atoms and molecules that are constantly bouncing of its walls. The pressure would be the average force of these atoms and molecules on its walls per unit of area of the container. Moreover, pressure does not have to be measured along the wall of a container but rather can be measured as the force per unit area along any plane. Air pressure, for example, is a function of the weight of the air pushing down on Earth. Thus, as the altitude increases, pressure decreases. Similarly, as a scuba diver or submarine dives deeper into the ocean, the pressure increases.The SI unit for pressure is the Pascal (N/m2), but other common units of pressure include pounds per square inch (PSI), atmospheres (atm), bars, inches of mercury (in Hg), and millimeters of mercury (mm Hg).A pressure measurement can be described as either static or dynamic. The pressure in cases where no motion is occurring is referred to as static pressure. Examples of static pressure include the pressure of the air inside a balloon or water inside a basin. Often times, the motion of a fluid changes the force applied to its surroundings. Such a pressure measurement is known as dynamic pressure measurement. For example, the pressure inside a balloon or at the bottom of a water basin would change as air is let out of the balloon or as water is poured out of the basin.Head pressure(or pressure head) measures the static pressure of a liquid in a tank or a pipe. Head pressure, P, is a function solely on the height, h, of the liquid and weight density, w, of the liquid being measured as shown in Figure 1 below.Figure 1. Head Pressure MeasurementThe pressure on a scuba diver swimming in the ocean would be the diver's depth multiplied by weight of the ocean (64 pounds per cubic foot). A scuba diver diving 33 feet into the ocean would have 2112 pounds of water on every square foot of his body. The translates to 14.7 PSI. Interestingly enough, the atmospheric pressure of the air at sea level is also 14.7 PSI or 1 atm. Thus, 33 feet of water create as much pressure as 5 miles of air! The total pressure on a scuba diver 33 feet deep ocean would be the combined pressure caused by the weight of the air and the water and would be 29.4 PSI or 2 atm.A pressure measurement can further be described by the type of measurement being performed. There are three types of pressure measurements: absolute, gauge, and differential. Absolute pressure measurement is measured relative to a vacuum as showing in Figure 2 below. Often times, the abbreviations PAA (Pascals Absolute) or PSIA (Pounds per Square Inch Absolute) are use to describe absolute pressure.Figure 2. Absolute Pressure Sensor[3]Gauge pressure is measured relative to ambient atmospheric pressure asshown in Figure 3. Similar to absolute pressure, the abbreviations PAG (Pascals Gauge) or PSIA (Pounds per Square Inch Gauge) are use to describe gauge pressure.Figure 3.Gauge Pressure Sensor[3]Differential pressure is similar to gauge pressure, but instead of measuring relative to ambient atmospheric pressure, differential measurements are taken with respect to a specific reference pressure as shown in Figure 4. Also, the abbreviations PAD (Pascals Differential) or PSID (Pounds per Square Inch Differential) are use to describe differential pressure.Figure 4. Differential Pressure Sensor[3]The Pressure SensorBecause of the great variety of conditions, ranges, and materials for which pressure must be measured, there are many different types of pressure sensor designs. Often pressure can be converted to some intermediate form, such as displacement. The sensor then converts thisdisplacement into an electrical output such as voltage or current. The three most universal types of pressure transducers of this form are the strain gage, variable capacitance, and piezoelectric.Of all the pressure sensors, Wheatstone bridge (strain based) sensors are the most common, offering solutions that meet varying accuracy, size, ruggedness, and cost constraints. Bridge sensors are used for high and low pressure applications, and can measure absolute, gauge, or differential pressure. All bridge sensors make use of a strain gage and a diaphragm as seen in Figure 4.Figure 4. Cross Section of a Typical Strain Gage Pressure Sensor [3]When a change in pressure causes the diaphragm to deflect, a corresponding change in resistance is induced on the strain gauge, which can be measured by a Data Acquisition (DAQ) System. These strain gauge pressure transducers come in several different varieties: the bonded strain gauge, the sputtered strain gauge, and the semiconductor strain gauge.In the bonded strain gauge pressure sensor, a metal foil strain gauge is actually glued or bonded to the surface where strain is being measured. These bonded foil strain gauges (BFSG) have been the industry standard for years and are continually used because of their quick 1000 Hz responsetimes to changes in pressure as well as their large -452°F to -525°F operating temperature.Sputtered strain gauge manufacturers sputter deposit a layer of glass onto the diaphragm and then deposit a thing metal film strain gauge on to the transd ucer’s diaphragm. Sputtered strain gauge sensors actually from a molecular bond between the strain gauge element, the insulating later, and the sensing diaphragm. These gauges are most suitable for long-term use and harsh measurement conditions.Integrated circuit manufacturers have developed composite pressure sensors that are particularly easy to use. These devices commonly employ a semiconductor diaphragm onto which a semiconductor strain gauge and temperature-compensation sensor have been grown. Appropriate signal conditioning is included in integrated circuit form, providing a dc voltage or current linearly proportional to pressure over a specified range.The capacitance between two metals plates changes if the distance between these two plates changes. A variable capacitance pressure transducer, seen in Figure 5 below, measures the change in capacitance between a metal diaphragm and a fixed metal plate. These pressure transducers are generally very stable and linear, but are sensitive to high temperatures and are more complicated to setup than most pressure sensors.Figure 5. Capacitance Pressure Transducer [4]Piezoelectric pressure transducer, as shown in Figure 6, take advantage of the electrical properties of naturally occurring crystals such as quartz. These crystals generate an electrical charge when they are strained. Piezoelectric pressure sensors do not require an externalexcitation source and are very rugged. The sensors however, do require charge amplification circuitry and very susceptible to shock and vibration.Figure 6. Piezoelectric Pressure Transducer [4]A common cause of sensor failure in pressure measurement applications is dynamic impact, which results in sensor overload. A classic example of overloading a pressure sensor is known as the water hammer phenomenon. This occurs when a fast moving fluid is suddenly stopped by the closing of a valve. The fluid has momentum that is suddenly arrested, which causes a minute stretching of the vessel in which the fluid is constrained. This stretching generates a pressure spike that can damage a pressure sensor. To reduce the effects of “water hammer”, sensors are often mounted with a snubber between the sensor and the pressure line. A snubber is usually a mesh filter or sintered material that allows pressurized fluid through but does not allow large volumes of fluid through and therefore prevents pressure spikes in the event of water hammer. A snubber is a good choice to protect your sensor in certain applications, but in many tests the peak impact pressure is the region of interest. In such a case you would want to select a pressure sensor that does not include overprotection. [3]Pressure MeasurementAs described above, the natural output of a pressure transducer is a voltage. Most strain based pressure transducers will output a small mV voltage. This small signal requires several signal conditioning considerations that are discussed in the next section. Additionally, many pressure transducers will output a conditioned 0-5V signal or 4-20 mA current. Both of these outputs are linear across the working range of thetransducer. For example both 0 V and 4 mA correspond to a 0 pressure measurement. Similarly, 5 volts and 20 mA correspond to the Full Scale Capacity or the maximum pressure the transducer can measure. The 0-5V and 4-20 mA signals can easily be measured by National InstrumentsMulti-function Data Acquisition (DAQ) hardware.See Also:Data Acquistion (DAQ) HardwareSignal Conditioning for Pressure SensorsAs with any other bridge based sensor, there are several signal conditioning considerations. To ensure accurate bridge measurements, it is important to consider the following:∙Bridge completion∙Excitation∙Remote sensing∙Amplification∙Filtering∙Offset∙Shunt CalibrationEach of these considerations are addressed thoroughly in the Measuring Strain with Strain Gauges tutorial linked below.Once you have obtained a measurable voltage signal, that signal must be converted to actual units of pressure. Pressure sensors generally produce a linear response across their range of operation, so linearization is often unnecessary, but you will need some hardware or software to convert the voltage output of the sensor into a pressure measurement. The conversion formula you will use depends on the type of sensor you are using, and will be provided by the sensor manufacturer. A typical conversion formula will be a function of the excitation voltage, full scale capacity of the sensor, and a calibration factor.[+] Enlarge ImageFor example, a pressure trandsducer with a full scale capacity of 10,000 PSI and a calibration factor of 3mv/V and given an excitation voltage of 10V DC produces a measured voltage of 15 mV, the measured pressure would be 5000 PSI.After you have properly scaled your signal, it is necessary to obtain a proper rest position. Pressure sensors (whether absolute or gauge) have a certain level that is identified as the rest position, or reference position. The strain gauge should produce 0 volts at this position. Offset nulling circuitry adds or removes resistance from one of the legs of the strain gauge to achieve this "balanced" position. Offset nulling is critical to ensure the accuracy of your measurement and for best results should be performed in hardware rather than software.See Also:Measuring Strain with Strain GaugesDAQ Systems for Pressure MeasurementsUsing SCXI with Pressure MeasurementsNational Instruments SCXI is a signal conditioning system for PC-based data acquisition systems as shown in Figure 7. An SCXI system consists of a shielded chassis that houses a combination of signal conditioning input and output modules, which perform a variety of signal conditioning functions. You can connect many different types of sensors, including absolute and gauge pressure sensors, directly to SCXI modules. The SCXI system can operate as a front-end signal conditioning system for PC plug-in data acquisition (DAQ) devices (PCI and PCMCIA) or PXI DAQ modules.[+] Enlarge ImageFigure 7. A Typical National Instruments SCXI SystemSCXI offers an excellent solution for measuring pressure. The SCXI-1520 universal strain-gauge module is ideal for taking strain based pressure measurements. It provides 8 simultaneous sampled analog input channels each with bridge completion, programmable excitation (0-10 V), remote excitation sensing, programmable gain amplification (1-1000), a programmable 4-pole Butterworth filter (10 Hz, 100 Hz, 1 kHz, 10kHz), offset nulling, and shunt calibration. The SCXI-1314 terminal block provides screw terminals for easy connections to your sensors. Additionally, the SCXI-1314T includes a built-in TEDS reader for Class II bridge-based smart TEDS sensors.Recommended starter kit for Pressure SCXI DAQ System:1.SCXI-1600 DAQ module2.SCXI chassis3.SCXI-1520 modules and SCXI-1314/SCXI-1314T terminal blocks4.Refer to /sensors for recommended sensor vendorsFor a customized solution, see the SCXI Advisor linked below.Using SC Series DAQ with Strain Based Pressure SensorsFor high performance integrated DAQ and signal conditioning, the National Instruments PXI-4220 shown in Figure 8, part of the SC Series, provides an excellent measurement solution. SC Series DAQ offers up to 333 kS/s measurements with 16-bit resolution, and combines data acquisition and signal conditioning into one plug in board. The PXI-4220 is a 200 kS/s, 16 bit DAQ board with programmable excitation, gain, and 4-pole Butterworth filter. Each input channel of the PXI-4220 also includes a 9-pin D-Sub connector for easy connection to bridge sensors, and programmable shunt and null calibration circuitry. The PXI-4220 provides the perfect solution for dynamic pressure measurements with low channel counts.Figure 8. National Instruments PXI-4220Recommended starter kit for Pressure SC Series DAQ System:1.PXI chassis2.PXI embedded controller3.PXI-4220 modules4.Refer to /sensors for recommended sensor vendorsFor a customized solution, see the PXI advisor linked below.Using SCC with Strain Based Pressure SensorsNational Instruments SCC provides portable, modular signal conditioning for DAQ system as seen in Figure 9 below. The SCC series provides a great low channel count and low cost solution that directly interfaces to National Instruments M Series DAQ boards. SCC modules can condition a variety of analog I/O and digital I/O signals, including bridge sensors. SCC DAQ systems include an SC Series shielded carrier such as the SC-2345 or the SC-2350, SCC modules, a cable, and a DAQ device. The SC-2350 shielded carrier provides additional support for TEDS sensors.[+] Enlarge ImageFigure 9. National Instruments SCC Carrier and ModulesThe SCC-SG24 Load Cell Input module accepts up to two full-bridge inputs from load cells or pressure sensors. Each channel of the module includes an instrumentation amplifier, a 1.6 kHz lowpass filter, and a potentiometer for bridge offset nulling. Each SCC-SG24 module also includes a single 10 V excitation source.Recommended Starter Kit for Pressure SCC DAQ System:1.M Series DAQ board2.SC-2345/SC-2350 module carrier3.SCC-SG24 modules (1 per 2 pressure sensors)4.Refer to /sensors for recommended sensor vendorsSee Also:Sensors - Affiliated Product AdvisorsSCXI Product AdvisorPXI Product AdvisorReferences[1] Johnson, Curtis D, “Pressure Principles” Process Control Instrumentation Technology, Prentice Hall PTB.[2] , “Strain Gauge Pressure Transducers”,/products/trans/t-presstrans.htm (current November 2003).[3] , “Honeywell Sensotec Frequently Asked Questions”, /pdf/FAQ_092003.pdf (current November 2003). [4] , "Pressure Measurement: Principles and Practice", /articles/0103/19/main.shtm l (current January 2003).3、Measuring Strain with Strain Gauges896 ratings | 4.27 out of 5| Print DocumentOverviewThis tutorial is part of the National Instruments Measurement Fundamentals series. Each tutorial in this series will teach you a specific topic of common measurement applications by explaining theoretical concepts and providing practical examples.This tutorial introduces and explains the concepts and techniques of measuring strain with strain gauges.You can also view an on demand webcast on strain gauge measurements. For more information, return to the NI Measurement Fundamentals Main Page. Table of Contents1.What Is Strain?2.The Strain Gauge3.Strain Gauge Measurement4.Signal Conditioning for Strain Gauges5.DAQ Systems for Strain Gauge Measurements6.Relevant NI ProductsWhat Is Strain?Strain is the amount of deformation of a body due to an applied force. More specifically, strain (e) is defined as the fractional change in length, as shown in Figure 1 below.Figure 1. Definition of StrainStrain can be positive (tensile) or negative (compressive). Although dimensionless, strain is sometimes expressed in units such as in./in. or mm/mm. In practice, the magnitude of measured strain is very small. Therefore, strain is often expressed as microstrain (me), which is e x 10-6.When a bar is strained with a uniaxial force, as in Figure 1, a phenomenon known as Poisson Strain causes the girth of the bar, D, to contract in the transverse, or perpendicular, direction. The magnitude of this transverse contraction is a material property indicated by its Poisson's Ratio. The Poisson's Ratio n of a material is defined as the negative ratio of the strain in the transverse direction (perpendicular to the force)/e. to the strain in the axial direction (parallel to the force), or n = eT Poisson's Ratio for steel, for example, ranges from 0.25 to 0.3.The Strain GaugeWhile there are several methods of measuring strain, the most common is with a strain gauge, a device whose electrical resistance varies in proportion to the amount of strain in the device. The most widely used gauge is the bonded metallic strain gauge.The metallic strain gauge consists of a very fine wire or, more commonly, metallic foil arranged in a grid pattern. The grid pattern maximizes the amount of metallic wire or foil subject to strain in the parallel direction (Figure 2). The cross sectional area of the grid is minimized to reduce the effect of shear strain and Poisson Strain. The grid is bonded to a thin backing, called the carrier, which is attached directly to the test specimen. Therefore, the strain experienced by the test specimen is transferred directly to the strain gauge, which responds with a linear change in electrical resistance. Strain gauges are available commercially with nominal resistance values from 30 to 3000 Ω, with 120, 350, and 1000 Ω being the most common values.Figure 2. Bonded Metallic Strain GaugeIt is very important that the strain gauge be properly mounted onto the test specimen so that the strain is accurately transferred from the test specimen, through the adhesive and strain gauge backing, to the foil itself.A fundamental parameter of the strain gauge is its sensitivity to strain, expressed quantitatively as the gauge factor (GF). Gauge factor is defined as the ratio of fractional change in electrical resistance to the fractional change in length (strain):The Gauge Factor for metallic strain gauges is typically around 2. Strain Gauge MeasurementIn practice, the strain measurements rarely involve quantities larger than a few millistrain(e x 10-3). Therefore, to measure the strain requires accurate measurement of very small changes in resistance. For example, suppose a test specimen undergoes a strain of 500 me. A strain gauge witha gauge factor of 2 will exhibit a change in electrical resistance of only2 (500 x 10-6) = 0.1%. For a 120 W gauge, this is a change of only 0.12 W.To measure such small changes in resistance, strain gauges are almost always used in a bridge configuration with a voltage excitation source. The general Wheatstone bridge, illustrated below, consists of four resistive arms with an excitation voltage, VEX, that is applied across the bridge.Figure 3. Wheatstone BridgeThe output voltage of the bridge, VO, will be equal to:From this equation, it is apparent that when R1/R2= R4/R3, the voltageoutput VOwill be zero. Under these conditions, the bridge is said to be balanced. Any change in resistance in any arm of the bridge will result in a nonzero output voltage.Therefore, if we replace R4in Figure 3 with an active strain gauge, any changes in the strain gauge resistance will unbalance the bridge and produce a nonzero output voltage. If the nominal resistance of the strain。
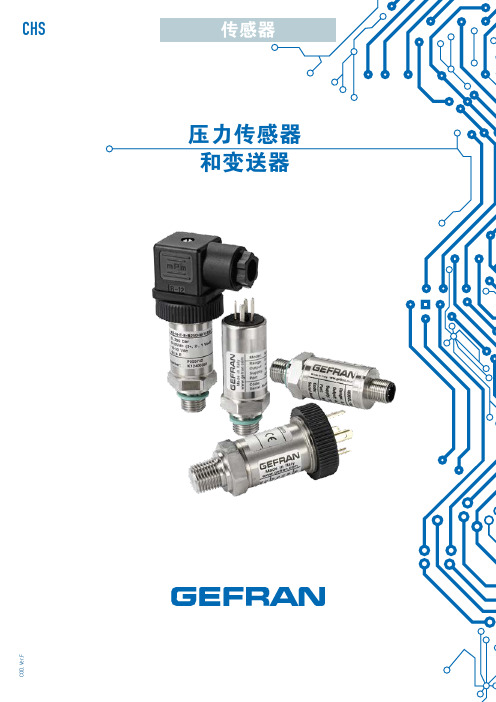
压力传感器和变送器-Gefran
适配器和密封
杰佛伦压力传感器提供广泛的内置压力连接选 择:公制、气体、NPT 和 UNF 以及含密封的 各种不锈钢适配器(外螺纹/内螺纹),被称为 PKITxxx,可满足所有可能的工艺连接要求。
接头和延伸电缆
杰佛伦压力传感器具有各种类型的电气接头 (EN175301-803,M12x1 等),对于每种接 头,杰佛伦为焊接电缆提供母接头(称为 CONxxx)或前附于母接头的延伸电缆(称为 CAVxxx),长达 30 米。
SENSORMATE AG Steigweg 8, CH-8355 Aadorf, Switzerland 电话:+41(0)52-2421818 传真:+41(0)52-3661884 http://www.sensormate.ch
GEFRAN FRANCE SA 4, rue Jean Desparmet BP 8237 69355 LYON Cedex 08 电话:+33 (0) 478770300 传真:+33 (0) 478770320 commercial@gefran.fr
凭借四十余年的丰富经验,杰佛伦在工业生产流程测量、控制及驱动解决方案的设计和制造方面稳居国际领导地位。 我们在 14 个国家设有 家分公司,拥有由 80 多个分销商组成的国际网络。
质量与技术
压力传感器是一种将物理变量(压力)转换为电信号(电流或电压)的电子设备,电信号可以通过各种控制、测 量和调整设备进行读取或获取。 杰佛伦拥有自己的技术级,是少数利用如下技术生产敏感元件的国际公司之一:不锈钢厚膜技术、粘贴应变计和 硅压阻技术。 杰佛伦传感器能够测量所有工业应用中的流体和气体压力,具备 0…50mbar 至 0…5000bar 完整量程范围,可精确 测量相对和绝对压力。
- 1、下载文档前请自行甄别文档内容的完整性,平台不提供额外的编辑、内容补充、找答案等附加服务。
- 2、"仅部分预览"的文档,不可在线预览部分如存在完整性等问题,可反馈申请退款(可完整预览的文档不适用该条件!)。
- 3、如文档侵犯您的权益,请联系客服反馈,我们会尽快为您处理(人工客服工作时间:9:00-18:30)。
压力传感器合理进行压力传感器的误差补偿是其应用的关键。
压力传感器主要有偏移量误差、灵敏度误差、线性误差和滞后误差,本文将介绍这四种误差产生的机理和对测试结果的影响,同时将介绍为提高测量精度的压力标定方法以及应用实例。
目前市场上传感器种类丰富多样,这使得设计工程师可以选择系统所需的压力传感器。
这些传感器既包括最基本的变换器,也包括更为复杂的带有片上电路的高集成度传感器。
由于存在这些差异,设计工程师必须尽可能够补偿压力传感器的测量误差,这是保证传感器满足设计和应用要求的重要步骤。
在某些情况下,补偿还能提高传感器在应用中的整体性能。
本文以摩托罗拉公司的压力传感器为例,所涉及的概念适用于各种压力传感器的设计应用。
摩托罗拉公司生产的主流压力传感器是一种单片压阻器件,该器件具有 3 类:1.基本的或未加补偿标定;2.有标定并进行温度补偿;3.有标定、补偿和放大。
偏移量、范围标定以及温度补偿均可以通过薄膜电阻网络实现,这种薄膜电阻网络在封装过程中采用激光修正。
该传感器通常与微控制器结合使用,而微控制器的嵌入软件本身建立了传感器数学模型。
微控制器读取了输出电压后,通过模数转换器的变换,该模型可以将电压量转换为压力测量值。
传感器最简单的数学模型即为传递函数。
该模型可在整个标定过程中进行优化,并且模型的成熟度将随标定点的增加而增加。
从计量学的角度看,测量误差具有相当严格的定义:它表征了测量压力与实际压力之间的差异。
而通常无法直接得到实际压力,但可以通过采用适当的压力标准加以估计,计量人员通常采用那些精度比被测设备高出至少 10 倍的仪器作为测量标准。
由于未经标定的系统只能使用典型的灵敏度和偏移值将输出电压转换为压力,测得的压力将产生如图 1 所示的误差。
这种未经标定的初始误差由以下几个部分组成:a.偏移量误差。
由于在整个压力范围内垂直偏移保持恒定,因此变换器扩散和激光调节修正的变化将产生偏移量误差。
b.灵敏度误差,产生误差大小与压力成正比。
如果设备的灵敏度高于典型值,灵敏度误差将是压力的递增函数(见图 1)。
如果灵敏度低于典型值,那么灵敏度误差将是压力的递减函数。
该误差的产生原因在于扩散过程的变化。
c.线性误差。
这是一个对初始误差影响较小的因素,该误差的产生原因在于硅片的物理非线性,但对于带放大器的传感器,还应包括放大器的非线性。
线性误差曲线可以是凹形曲线,也可以是凸形曲线。
d.滞后误差:在大多数情形中,滞后误差完全可以忽略不计,因为硅片具有很高的机械刚度。
一般只需在压力变化很大的情形中考虑滞后误差。
标定可消除或极大地减小这些误差,而补偿技术通常要求确定系统实际传递函数的参数,而不是简单的使用典型值。
电位计、可调电阻以及其他硬件均可在补偿过程中采用,而软件则能更灵活地实现这种误差补偿工作。
一点标定法可通过消除传递函数零点处的漂移来补偿偏移量误差,这类标定方法称为自动归零。
偏移量标定通常在零压力下进行,特别是在差动传感器中,因为在标称条件下差动压力通常为 0。
对于纯传感器,偏移量标定则要困难一些,因为它要么需要一个压力读取系统,用以测量其在环境大气压力条件下的标定压力值,要么需要获取期望压力的压力控制器。
差动传感器的零压力标定非常精确,因为标定压力严格为 0。
另一方面,压力不为0 时的标定精确度取决于压力控制器或测量系统的性能。
选择标定压力标定压力的选取非常重要,因其决定了获取最佳精度的压力范围。
实际上,经过标定后实际的偏移量误差在标定点处最小并一直保持较小的值。
因此,标定点必须根据目标压力范围加以选择,而压力范围可以不与工作范围相一致。
为了将输出电压转换为压力值,由于实际的灵敏度往往是未知,因此在数学模型中通常采用典型灵敏度进行单点标定。
红色曲线表示进行偏移量标定( PCAL=0 )后的误差曲线,可以发现误差曲线相对于表示标定前误差的黑色曲线产生了垂直偏移。
这种标定方法与一点标定法相比要求更为严格,实现成本也更高。
然而与一点标定法相比,该方法可显著提高系统的精度,因为该方法不仅标定了偏移量,还标定了传感器的灵敏度。
因此在误差计算中可以使用灵敏度实际值,而非典型值。
绿色曲线表示精度提高。
在这里,标定是在 0 至 500 兆巴(满标度)条件下进行。
由于在标定点上误差接近于 0,因此为了在期望的压力范围内得到最小的测量误差,正确地设定这些点就显得尤为重要。
某些应用中要求在整个压力范围内保持较高的精确度。
在这些应用中,可以采用多点标定法来得到最理想的结果。
在多点标定法中,不仅考虑了偏移量和灵敏度误差,还考虑了大部分的线性误差,紫红色曲线所示。
这儿用的数学模型与每个标定间距(在两个标定点之间)的两级标定完全一样。
点标定如前所述,线性误差具有一致的形式,且误差曲线符合二次方程的曲线,具有可预测的大小和形状。
对于未采用放大器的传感器更是如此,因为传感器的非线性从本质上是基于机械原因(这是由硅片的薄膜压力引起)。
线性误差特性的描述可以通过计算典型实例的平均线性误差,确定多项式函数(a X2+bx+c )的参数而得到。
确定了 a、b和c后得到的模型对于相同类型的传感器都是有效的。
该方法能在无需第 3 个标定点的情况下有效地补偿线性误差。
摩托罗拉 MPX2300 的补偿实例, MPX2300 是一种主要应用于血压测量的温度补偿传感器。
多项式模型可由 10 个传感器的平均线性误差得到,补偿后的误差约为最大初始线性误差的十至二十分之一,如图 3 虚线所示。
该误差补偿方法只需两点标定即可将低成本传感器改进为高性能器件(误差小于满标度的 0.05% )。
当然设计工程师要根据实际应用的精确度要求,选择最适合的标定方法,此外还需要考虑系统成本。
由于有多种集成度和补偿技术可供选择,设计工程师可根据不同的设计要求选择适当的方法。
Pressure sensorsReasonable pressure sensor error compensation is the key to its application. Pressure sensors are mainly offset error, sensitivity error, linear error and lag errors, the paper will introduce the four errors on the mechanism and the effects of the test results, will be presented at the same time to improve the measurement accuracy of pressure calibration method and application examples .Currently on the market a variety of sensor types, which allows design engineers can choose the pressure sensor system. These sensors not only include the most basic converter, but also more complex circuits with on-chip, highly integrated sensor. Because of these differences, the design engineer must be enough as far as possible compensation of pressure sensor measurement error, which is to ensure that the design and application of sensors to meet the requirements of an important step. In some cases, compensation can increase the sensor in the application of the overall performance.Based on Motorola's pressure sensor as an example, the application of the concept involved in the design of a variety of pressure sensor applications.Motorola mainstream production pressure piezoresistive sensor is a monolithic device, the device has 3 categories:1.Basic calibration or without compensation;2.There are calibration and temperature compensation;3.There are calibration, compensation and amplification.Offset, the scope of calibration and temperature compensation can be through the thin film resistor networks, the thin film resistor networks in the process of laser package amendments.The sensor is usually used in conjunction with the micro-controller, and microcontroller embedded software itself, established a mathematical model of the sensor. Microcontroller reads the output voltage through the ADC conversion, the model can be converted to the pressure of the volume of voltage measurements.The simplest sensor is the transfer function of the mathematical model. The model calibration over the entire optimization process and maturity model will be marked with the fixed-point increase.From the point of view of metrology, measurement error has a very strict definition: it is characterized by measurement of pressure and the difference between the actual pressure. Usually can not directly be the actual pressure, but through the use of appropriate criteria to estimate the pressure, the measurement accuracy are usually more than those measured using equipment at least 10 times higher than the instrument as a measurement standard.Without calibration of the system as a result can only use the typical value of sensitivity and offset the output voltage is converted to pressure, the pressure measured will have a margin of error as shown in Figure 1.This initial error without calibration by the following components:a.offset error. As the pressure in the entire range of vertical shift to maintain a constant, so the proliferation and laser conditioning converter changes the amendment would have offset error.b.The sensitivity of error, resulting in errors in direct proportion to the size and pressure. If the device is higher than the typical value of the sensitivity, the sensitivity of the error will be incremental pressure function (see Figure 1). If the sensitivity is lower than the typical value, then the sensitivity of the error will be decreasing function of pressure. The cause of the error diffusion process is to change.c.Linearity Error. This is an initial error factor less affected, the error is the cause of the physical non-linear silicon, but with the sensor amplifier, should also include non-linear amplifier. Linear error curve can be concave curve, it could be a convex curve.g Error: In most cases, the lag error can be ignored completely, because silicon has a higher degree of mechanical stiffness. Changes in general just a lot of pressure to consider the case of hysteresis error.Calibration can eliminate or greatly reduce these errors, and compensation technique is usually required to identify the parameters of the actual transfer function, rather than simply the use of typical values. Potentiometer, adjustable resistance, and other hardware can be used in the compensation process, while the software is able to achieve more flexibility in the work of this error compensation.Calibration method that can eliminate the transfer function against the Agency to compensate the offset drift error, such as the auto-zero calibration method.Offset zero calibration is usually carried out under pressure, especially in the differential sensor, because under the conditions of the nominal differential pressure is usually 0. For pure sensor offset calibration will be difficult, because it either needs to read a pressure system to measure the atmospheric pressure in the environment under the conditions of the calibration of pressure or need to obtain the pressure of expectations of the pressure controller.Zero differential pressure sensor is very accurate calibration, because the pressure of strict demarcation is 0. On the other hand, the pressure of0:00 is not the accuracy of the calibration depends on the pressure controller or the performance measurement system.Choice of calibration pressureCalibration is very important selection pressure, which determines the accuracy to obtain the best pressure range. In fact, after calibration offset actual standard fixed-point error in the Department and has been to maintain a smaller minimum value. Therefore, the reference points must be in accordance with the scope of the target selection pressure, and pressure range can not be consistent with the scope of work.In order to convert the pressure of the output voltage value, usually asa result of the actual sensitivity is unknown, and therefore the mathematical model used for a typical single-point calibration sensitivity.Said that the red curve calibration offset (PCAL = 0) after the error curve, the error can be found that calibration curve relative to the black before the error had a vertical offset curve.This calibration method and calibration method that is more stringent requirements to achieve a higher cost. However, compared with the calibration point, the method can significantly improve the accuracy of the system, because the method is not only an offset calibration, the calibration of the sensor sensitivity. Therefore, the calculation error can be used in the actual value of sensitivity, and the atypical values.That improve the accuracy of the green curve. Here, calibration istrillion 0-500 bar (full scale) conditions. As the marked point on the error close to 0, sothe pressure of expectations to be the smallest range of measurement error, the correct set of these points, it is particularly important.Some applications require the pressure in the whole range of high accuracy. In these applications, can be used multi-point calibration method to get the best results. In multi-point calibration method, not only considered the error of offset and sensitivity, but also takes into account most of the linear error curve shown in purple. The mathematical model used here, with each calibration interval (between the two reference points) exactly the same as a two-tier calibration.Three-point calibrationAs mentioned earlier, the linear form of a consistent error and the error curve in line with the quadratic equation of the curve, with a predictable size and shape. Did not use the amplifier for the sensor, especially because of the nonlinear sensor is based on the nature of mechanical reasons (this is caused by the pressure of silicon thin-film).Linear description of the error characteristics of a typical example can be calculated the average linear error to determine the polynomial function (a2 + bx + c) be the parameter. Determine the a, b and c of the model after the same type of sensor is valid. This method can be no fixed points marked thefirst three cases of linear error compensation effectively.Examples of compensation MPX2300 Motorola, MPX2300 is a blood pressure measurement is mainly used in the temperature compensation sensor. Polynomial model can be an average of 10 sensors to be linear error compensation of the error after the initial maximum linearity error of about ten to one-twentieth, as shown in dotted line in Figure 3.The error compensation method can be only two points calibration for high-performance low-cost sensors to improve the device (full scale error of less than 0.05%).Of course, design engineers practical application in accordance with the accuracy requirements, choosing the most appropriate calibration method, in addition to the need to consider system cost. As a result of a variety of integration options and compensation technology, design engineers can design requirements according to different methods of selecting appropriate.。