Baseband Detection of Bistatic Electron Spin Signals in Magnetic Resonance Force Microscopy
a r X i v :q u a n t -p h /0307042v 2 20 A u g 2003
BASEBAND DETECTION OF BISTATIC ELECTRON SPIN SIGNALS IN MAGNETIC
RESONANCE FORCE MICROSCOPY (MRFM)
Chun-yu Yip ?,Alfred O.Hero ?,Daniel Rugar ?,Jeffrey A.Fessler ?
?
University of Michigan,Ann Arbor,MI
?
IBM Research Division,Almaden Research Center,San Jose,CA
Abstract
In single spin Magnetic Resonance Force Microscopy (MRFM),the objective is to detect the presence of an elec-tron (or nuclear)spin in a sample volume by measuring spin-induced attonewton forces using a micromachined can-tilever.In the OSCAR method of single spin MRFM,the spins are manipulated by an external rf ?eld to produce small periodic deviations in the resonant frequency of the cantilever.These deviations can be detected by frequency demodulation followed by conventional amplitude or en-ergy detection.In this paper,we present an alternative to these detection methods,based on optimal detection theory and Gibbs sampling.On the basis of simulations,we show that our detector outperforms the conventional amplitude and energy detectors for realistic MRFM operating condi-tions.For example,to achieve a 10%false alarm rate and an 80%correct detection rate our detector has an 8dB SNR advantage as compared with the conventional amplitude or energy detectors.Furthermore,at these detection rates it comes within 4dB of the omniscient matched-?lter lower bound.
1.INTRODUCTION
Magnetic Resonance Force Microscopy (MRFM)is a re-cently developed technique with which physicists can po-tentially push the limits of force detection to the single elec-tron spin level,with sub-angstrom spatial resolution [1,2,3].The experiment involves detection of perturbations of a thin micrometer-scale cantilever whose tip incorporates a sub-micron ferromagnet.Any spinning electrons in the sam-ple will act as magnetic dipoles,exerting perturbing forces that can be measured from cantilever displacements.There have been several successful experimental demonstrations of MRFM for imaging micron-size ensembles of spins.For example,three-dimensional imaging with micrometer spa-tial resolution has been achieved [4].Furthermore,forces
ses of spin absence and presence,we propose a hybrid de-tection scheme which combines optimal Bayes and Gen-eral Likelihood Ratio (GLR)detection principles imple-mented with Gibbs sampling.Simulations show that our proposed detector can signi?cantly outperform the conven-tional baseband amplitude and energy detector for realistic post-demodulation signal-to-noise ratios (SNR).
The outline of the paper is as follows.After brie?y re-viewing the OSCAR experiment in Sec.2,we describe the proposed signal detection scheme in Sec.3,and present re-sults of numerical simulations in Sec.4.
2.DESCRIPTION OF EXPERIMENT
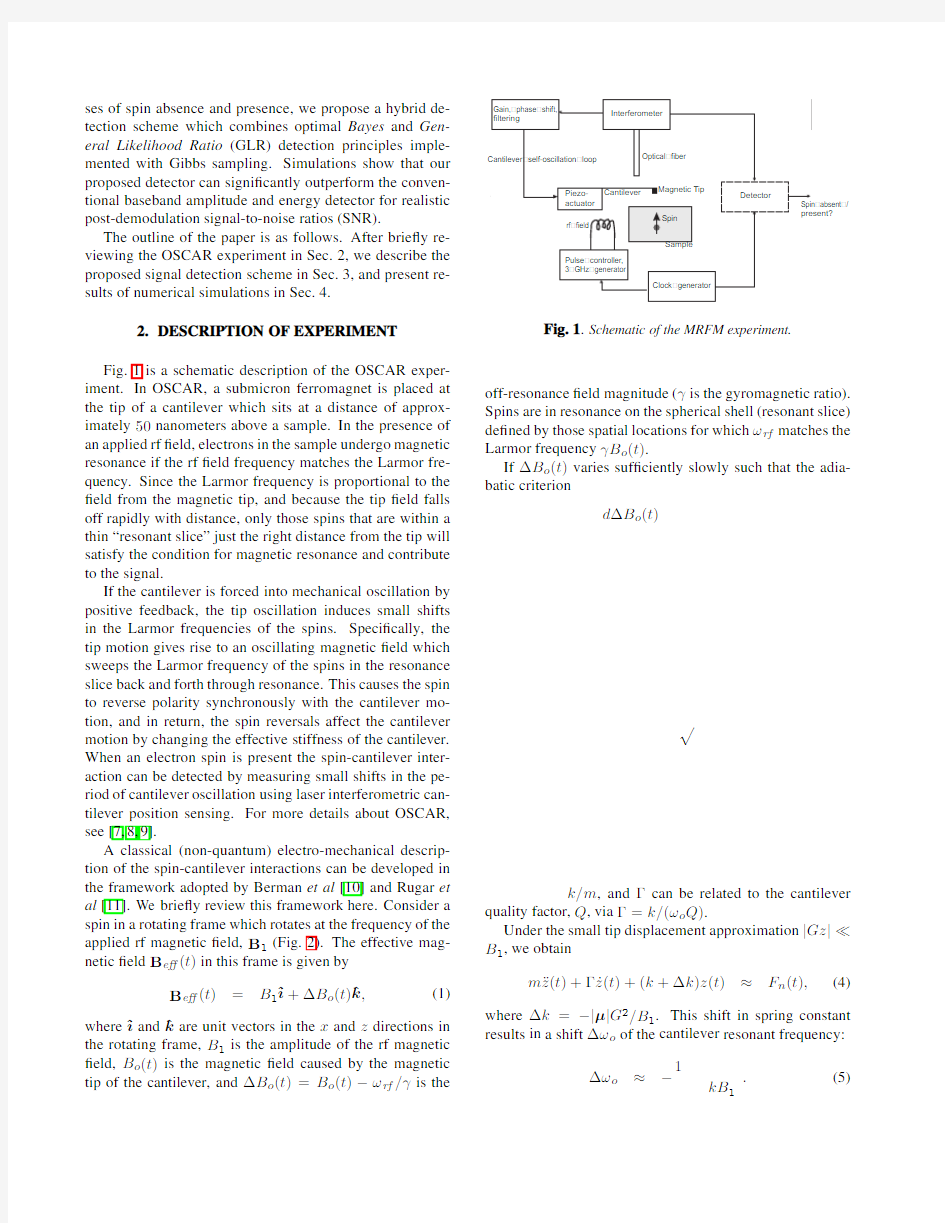
Fig.1is a schematic description of the OSCAR exper-iment.In OSCAR,a submicron ferromagnet is placed at the tip of a cantilever which sits at a distance of approx-imately 50nanometers above a sample.In the presence of an applied rf ?eld,electrons in the sample undergo magnetic resonance if the rf ?eld frequency matches the Larmor fre-quency.Since the Larmor frequency is proportional to the ?eld from the magnetic tip,and because the tip ?eld falls off rapidly with distance,only those spins that are within a thin “resonant slice”just the right distance from the tip will satisfy the condition for magnetic resonance and contribute to the signal.
If the cantilever is forced into mechanical oscillation by positive feedback,the tip oscillation induces small shifts in the Larmor frequencies of the spins.Speci?cally,the tip motion gives rise to an oscillating magnetic ?eld which sweeps the Larmor frequency of the spins in the resonance slice back and forth through resonance.This causes the spin to reverse polarity synchronously with the cantilever mo-tion,and in return,the spin reversals affect the cantilever motion by changing the effective stiffness of the cantilever.When an electron spin is present the spin-cantilever inter-action can be detected by measuring small shifts in the pe-riod of cantilever oscillation using laser interferometric can-tilever position sensing.For more details about OSCAR,see [7,8,9].
A classical (non-quantum)electro-mechanical descrip-tion of the spin-cantilever interactions can be developed in the framework adopted by Berman et al [10]and Rugar et al [11].We brie?y review this framework here.Consider a spin in a rotating frame which rotates at the frequency of the applied rf magnetic ?eld,
B 1(Fig.2).The effective mag-netic ?eld B e?(t )in this frame is given by
B e?(t )
=
B 1?
i +?B o (t )?k ,(1)
where ?i and ?k
are unit vectors in the x and z directions in the rotating frame,B 1is the amplitude of the rf magnetic ?eld,B o (t )is the magnetic ?eld caused by the magnetic tip of the cantilever,and ?B o (t )=B o (t )?ωrf /γis the
Fig.1.Schematic of the MRFM experiment.
off-resonance ?eld magnitude (γis the gyromagnetic ratio).Spins are in resonance on the spherical shell (resonant slice)de?ned by those spatial locations for which ωrf matches the Larmor frequency γB o (t ).
If ?B o (t )varies suf?ciently slowly such that the adia-batic criterion
d ?B o (t )
k/m ,and Γcan be related to the cantilever
quality factor,Q ,via Γ=k/(ωo Q ).
Under the small tip displacement approximation |Gz |?B 1,we obtain
m ¨z (t )+Γ˙z (t )+(k +?k )z (t )≈F n (t ),
(4)
where ?k =?|μ|G 2/B 1.This shift in spring constant results in a shift ?ωo of the cantilever resonant frequency:
?ωo
≈?
1
kB 1
.
(5)
In a version of the protocol called“Interrupted OSCAR,”the B1?eld is turned off every T skip seconds over a half cycle duration(π/ωo)to cause periodic transitions between the spin-lock and anti-spin-lock spin states(see middle panel of Fig.4).In the spin-lock state the spin aligns with the?eld B e?(t)and in the anti-lock state the spin aligns with?B e?(t).Therefore,the frequency shift ?ωo of the cantilever alternates between the two values ±1
s(t)is a random telegraph signal containing only the ran-dom transitions:
s(t)=φ|?ωo|
N
i=0(?1)i g(t?τi
T T0y(t′)s(t′,φ,τ,N)dt′H1
>
<
H0
η(9)
where s(t;φ,τ,N)is a synthesized random telegraph signal of the form(7)parametrized by|?ωo|(assumed known),φ,τand N.The valueηis a threshold that can ei-ther be set to satisfy a probability of false alarm(P F)con-traint P F≤α,α∈[0,1],or as a function of the prior probabilities a ln[P(H0)/P(H1)]+b where a,b are known constants.In the former case the detector is called the most powerful(MP)test of levelα,which has maximum proba-bility of detection(P D),while in the latter case the detector is called the minPe detector as it achieves minimum average probability of decision error(minPe).
As the values of the random parameters are always un-known,we call the detector(9)the omniscient matched?l-ter,which is unimplementable.However,as the omniscient matched?lter is optimal for known parameter values it es-tablishes a useful upper bound on performance.
Perhaps the simplest baseband detection scheme,and the most widespread in MRFM applications,is the amplitude detector which acts as if there were no random?ips and declares a spin present if the magnitude of the average am-plitude of the correlator output exceeds a threshold
1
3.1.The Hybrid Bayes/GLR Detector
The minPe detector for a signal with random parame-ters is a Bayes likelihood ratio test that averages an omni-
scient
likelihood ratio test statistic over all random parame-ters [14]:
log Λ(y )(12)
=log
E τ,N [E φ[f (y ;τ,N,φ|H 1)]]
f (y |H 0)
H 1> η, where,again,ηis a threshold chosen for a desired P F .Note that in (13)we have averaged over φwhile we have max-imized over {{τi },N },leading to what we call a hybrid Bayes/GLR test. As y (t )is a conditionally Gaussian random process given {τi }and N ,the log-likelihood function in (13)can be simpli?ed by invoking the Cameron-Martin formula [16]: log Λ(y )=max τ,N log cosh 1 σ2v T (s +(t ;τ,N ))2dt (14) where s +(t ;τ,N )is the synthesized telegraph wave (7)having initial polarity φ=1and parametrized by τand N .It is well known that for a suf?ciently large integration time T the minPe and GLR tests are identical (see for ex-ample [17]).Thus we can assert that the hybrid Bayes/GLR test (13)is an asymptotically optimal test.3.2.Solution via Gibbs Sampling The maximization in (14)by exhaustive search over the uncountably in?nite dimensional space of possible parame-ter values,{{τi },N },is impractical.An alternative,which is guaranteed to converge to the maximizing solution,is to more ef?ciently search over the space by Gibbs Sam-pling [18,19].As we know the Poisson intensity λ,we can generate samples {{τi },N }from the prior Poisson distri-bution so as to maximize the log-likelihood function.As these samples are more likely (on the average)to mimic the actual behavior of the parameters,we obtain a reduction in search complexity. The general description of the Gibbs sampler is as fol-lows.Supposed there is a random vector variable X =[x 1,x 2,...,x p ]T having density function f X from which we want to sample.Suppose also that we can simulate the i-th element of X given samples (already simulated)of the other elements: X i |x 1,x 2,...,x i ?1,x i +1,...,x p ~f i (x i |x 1,x 2,...,x i ?1,x i +1,...,x p ) for i =1..p (15) Then a Markov sequence,x (t )=[x (t ) 1,...,x (t ) p ]T ,can be simulated by the recursion X (t +1) 1~f 1(x 1|x (t ) 2,...,x (t ) p ), X (t +1) 2 ~ f 2(x 2|x (t +1) 1 ,x (t ) 3,...,x (t ) p ), ... X (t +1) p ~ f p (x p |x (t +1) 1 ,x (t +1) 2 ,...,x (t +1) p ?1). (16) After a certain amount of burn-in time T b ,X (t ),t >T b ,will have stationary distribution f X .In our case,since the arrival times {τi }are generated from a Poisson process,the condi-tional distributions (16)are easy to sample from,because they are conditionally uniform. 4.SIMULATION METHODS AND RESULTS The objective of our ?rst three simulations was to com-pare the detection performance of the matched ?lter,the am-plitude detector,the energy detector,and the Bayes/GLR detector on the basis of Receiver Operating Characteristic (ROC)curves,which are obtained by empirically generat-ing the pairs (P F ,P D )for each detector.In our simulations,the four decision rules (9),(10),(11),and (13)were used to generate the ROC curves in the Matlab 6.1environment.Based on the Monte Carlo methodology [18],we generated samples {y (i ) d (n )},y d (n )=y (nT s ),under both Hypothe-sis 0and 1,wher e T s was the sampling period.The samples were input to the detector being evaluated,and P D and P F were statistically calculated.500detection trials were per-formed under each hypothesis.For each ROC curve,the above process was repeated with a range o f decision thresh-old values η.This range of thresholds was chosen to ade-quately sample the domain P F ∈[0,1]. The simulation parameter values were chosen according to typical OSCAR experimental values.The signal dura-tion T was3s and the sampling period T s was0.5ms.The rest of the parameters were set to:k=1×10?3N/m,ωo/(2π)=1×104Hz,B1=0.2mT,G=2×106 T/m,andμ=9.3×10?24J/T.With these parameters the (noiseless)signal amplitude,|s(t)|,was0.928Hz ac-cording to(5).Two values ofλ,the average number of random?ips per second,were evaluated.The detector noise was assumed AWGN and the noise variance was ad-justed to investigate the effect of SNR,which is de?ned as T22 Fig.5.Simulated Receiver Operating Characteristic(ROC) curves for the matched?lter,energy detector,amplitude detector, and hybrid Bayes/GLR detector,at SNR=-25dB andλ=1event-per-second.Unlike the other detectors,the matched?lter assumes complete information on the parameter values and is not imple-mentable. We ran the Gibbs sampler for5,000iterations for the hy-brid Bayes/GLR detector.Fig.5and6show ROC curves for SNR=-25dB and-20dB,respectively,forλ=1event-per-second.In both cases,our hybrid Bayes/GLR detector signi?cantly outperformed all the other detectors except for the unimplementable matched?lter.The matched?lter had complete information about the random?ip times,and as a result it achieved almost perfect detection for both SNR val-ues.In Fig.7the value ofλwas increased to10events-per-second and the SNR was held at-20dB.As expected,the performance of the amplitude and hybrid Bayes/GLR detec-tors degrades,while the matched?lter and energy detector, whose performance does not depend onλ,are not affected. In Fig.8the power curves for all detectors are plotted as a function of SNR forλ=1.Here all detectors perform at the same false alarm rate P F=0.1,and we can make a quantitative SNR comparison by?xing the detection perfor-mance level at P D=0.8,say.To attain this detection level,Fig.6.Simulated Receiver Operating Characteristic(ROC) curves for the matched?lter,energy detector,amplitude detector, and hybrid Bayes/GLR detector,at SNR=-20dB andλ=1event-per-second. the energy detector and amplitude detector require SNR’s of at least-14dB and-17.5dB,respectively,while the hybrid Bayes/GLR detector only requires-26dB.As compared to the amplitude detector,this represents an improvement of almost9dB in SNR performance using our proposed detec-tor.Furthermore,the performance of our proposed detector is only4dB worse than the performance bound of-30dB established by the matched?lter for this level of P F and P D.Note that the amplitude detector outperforms the en-ergy detector for low SNR’s but not for high SNR’s.This is explained by the fact that even though the energy detector is not affected by random?ips,at low SNR’s its test statistic is dominated by the noise. In another simulation,we investigated the role of the number of Gibbs samples on performance of the hybrid Bayes/GLR detector,shown in Fig.9.It is evident that performance improves as we increase the number of Gibbs samples.For example,at P F=0.1,P D increases from ap-proximately0.35to0.65if we increase the number of Gibbs samples from100to500.It increases further to around0.9 and0.95if500or5,000Gibbs samples are used,respec-tively.Such improvements in performance are signi?cant but yield diminishing returns as the number of Gibbs sam-ples is increased beyond500. 5.CONCLUSION In this paper we presented a hybrid Bayes/GLR approach to detecting the presence of single spins for the OSCAR MRFM experiment.We have shown by simulation that the Bayes/GLR detector performs signi?cantly better than the classical amplitude and energy detectors.The improvement Fig.7.Simulated Receiver Operating Characteristic (ROC) curves for the matched ?lter,energy detector,amplitude detector,and hybrid Bayes/GLR detector,at SNR =-20dB and λ=10events-per-second. Fig.8.The power curves (P D vs.SNR)for the four detectors studied in this paper for P F =0.1and λ=1event-per-second.At P D =0.8the hybrid Bayes/GLR detector performs within 4dB of the bound established by the matched ?lter. in detection performance is due to the fact that,unlike the classical detectors,the new detector estimates the unknown values of the random spin reversal times and the initial po-larity.Of course this performance improvement comes at the price increased implementation complexity.This com-plexity increases in the random reversal rate λdue to the necessity to perform Gibbs sampling over an increasingly large number of probable spin reversal sequences.Nonethe-less,for the experiments in the ?rst simulation with λ=1event-per-second,the run time of our detector (5,000Gibbs samples)was only on the order of about half a minute per Fig.9.Juxtaposition of ROC curves of hybrid Bayes/GLR detec-tor,obtained with different numbers of Gibbs samples in the max-imization step,at SNR =-20dB and λ=10events-per-second.Performance improves as the number of Gibbs samples increases. 3-second measurement record (our code was implemented in Matlab 6.5,under WindowsXP on a 2.26GHz PC,with 510MB RAM). An interesting extension of our results would be to as-sume that the frequency shift |?ωo |is also unknown.This would lead to a hybrid Bayes/GLR detector which detects the peak over the spectrum of the signal in addition to max-imizing over the number and positions of the transitions.The hybrid Bayes/GLR detector was derived using a baseband signal model consisting of a random telegraph wave with Poisson transitions and AWGN.This signal model is theoretically justi?ed under the spin-lock assump-tion.The validity of the spin-lock assumption remains to be established.More sophisticated signal models of the cantilever measurements,and associated detection methods which bypass frequency demodulation and operate directly on those measurements,are currently under investigation. 6.REFERENCES [1]J.A.Sidles.Nondestructive detection of single-proton magnetic resonance.Appl.Phys.Lett.,58:2854–2856,1991.[2]J.A.Sidles,J.L.Garbini,and G.P.Drobny.The the-ory of oscillator-coupled magnetic resonance with po-tential applications to molecular imaging.Rev.Sci.Instrum.,63:3881–3899,1992.[3]D.Rugar,B.C.Stipe,H.J.Mamin,C.S.Yannoni, T.D.Stowe,K.Y .Yasumura,and T.W.Kenny.Ad-ventures in attonewton force detection.Appl.Phys.A ,72[Suppl.]:S3–S20,2001. [4]O.Z¨u ger,S.T.Heon,C.S.Yannoni,and D.Ru- gar.Three-dimensional imaging with a nuclear mag-netic resonance force microscope.J.Appl.Phys., 79(4):1881–1884,1996. [5]H.J.Mamin and D.Rugar.Sub-attonewton force de- tection at millikelvin temperatures.Appl.Phys.A, 79:3358,2001. [6]B.C.Stipe,H.J.Mamin,C.S.Yannoni,T.D.Stowe, T.W.Kenny,and D.Rugar.Electron spin relaxation near a micron-size ferromagnet.Phys.Rev.Lett., 8727(27):7602+,2001. [7]J.A.Sidles,J.L.Garbini,K.J.Bruland,D.Rugar, O.Z¨u ger,S.Hoen,and C.S.Yannoni.Magnetic resonance force microscopy.Rev.of Modern Phys., 67(1):249–265,1995. [8]D.Rugar,O.Z¨u ger,S.T.Hoen,C.S.Yannoni,H.M. Vieth,and R.Kendrick.Force detection of nuclear magnetic resonance.Science,264:1560,1994. [9]K.Wago, D.Botkin, C.S.Yannoni,and D.Ru- gar.Force-detected electron-spin resonance:Adia-batic inversion,nutation,and spin echo.Phys.Rev. B,57(2):1108–1114,1998. [10]G.P.Berman,D.I.Kamenev,and V.I.Tsifrinovich. Stationary cantilever vibrations in the oscillat-ing cantilever-driven adiabatic reversals-magnetic resonance force microscopy technique.Quant. Phys./020313,2002. [11]D.Rugar and R.Budakian.Classical dynamics of a spin interacting with a MRFM cantilever.Technical report,IBM,Almaden Research Center,July112002. [12]W.B.Davenport.Probability and Random Process. McGraw-Hill,New York,NY,1970. [13]H.V.Poor.An Introduction to Signal Detection and Estimation.Springer-Verlag,New York,NY,1988. [14]H.L.Van Trees.Detection,Estimation,and Modula- tion Theory(Part I).Wiley,New York,NY,1968. [15]A.Hero,M.Ting,C.Y.Yip,and Cyrille Hory.Opti- mal strategies for single spin detection in MRFM.in preparation,2003. [16]L.M.Garth and H.V.Poor.Detection of non-gaussian signals:A paradigm for modern statistical signal pro-cessing.Proc.IEEE,82(7):1061–1095,1994. [17]L.LeCam.Asymptotic Methods in Statistical Decision theory.Spring-Verlag,New York,NY,1986.[18]C.P.Robert and G.Casella.Monte Carlo Statistical Methods.Springer-Verlag,New York,NY,1999. [19]P.Br′e maud.Markov Chains-Gibbs?elds,Monte Carlo Simulation,and Queues.Springer-Verlag,New York,NY,1999. 一.HDMAX相对HD370功能提升 1、硬件平台 HDMAX采用全新的硬件平台,内部电路和结构设计更加合理。其1.6GHZ双核CPU,1G内存、16G固态硬盘以及17寸高清显示屏都是行业顶配。采用完整电脑系统,系统运行更加稳定。其采用的高强度聚乙烯塑料外壳,坚固耐用防水,其超强的工业化设计为水深测量提供了坚实的保障! 2、人性化设计 HDMAX测深仪在主机增加了VGA接口,可进行测量分屏显示;测深仪前面板增添数字输入键和常用快捷按键,用户直接操作快捷按键,即可完成测量大部分操作。其设计的可旋转支架,主机可以任何角度显示,极大提高操作的便利性。 3、测深性能 HD MAX在HD370测深基础之上,对测深模块进行全新优化,在底层回波控制方面进行了全新设计,使得HDMAX测深数据稳定性得到了极大提升,最浅水深可以达到0.2米,且性能稳定。同时HD‐MAX测深仪根据声纳在水中的传输特性设计出完美的 TVG 曲线,优化了测深性能,并有效地解决了浅水测深的难题。 4、内置全新测量软件HIMAX HDMAX测深仪采用全新的测深测量软件,软件支持标准格式的GNSS产品输出NMEA‐0183格式,支持三维姿态仪、表面声速仪、GNSS罗经等多种传感器输入。其全自动功率增益控制、强大的电子海图功能、多种数据滤波算法、自定义成果导出功能都极大提高了作业效率!支持模拟回波图形和数据图形相互叠加,快速改正数据信号假回波信号。在后处理可以任意加点,容易解决特征点输出问题。 说明:VGA转换线,用于HDMAX分屏显示,不是套件标配产品 二.招标参数 ★表示属于相对有优势的 ★★表示基本是独家的 ★★招标是要注意:产品要取得工业生产许可证才是合法的产品 主机技术参数: ★CPU:双核1.6G ★内存容量:2GB ★★存储空间:16GB SSD ★系统:完整Window XP操作系统,非剪切操作系统 ★★显示屏幕尺寸:17寸 USB接口: 3 个USB2.0 ★显示分辨率:1280 x 1024 ★VGA:1个VGA分屏接口 串口:2个RS232串口(一分二串口) 材质:ASA工程塑料,耐腐蚀 ★★功能快捷键:具有数据输入键和快捷键,不用键盘就可以完成测量操作。 输入电压:10~30VDC or 220VAC 平均功耗:小于30W 最大功率: 500W 重量:9.5KG 工作温度:‐20℃~70℃ 测深参数: 频率: 200KHz ★★测深范围:0.2‐600米(可加入现场测试环节,其它仪器很难达到0.2米) 测深精度:±10mm+0.1%h。分辨率1cm ★采样率:最大30HZ 吃水改正范围:0.0‐15米 声速调整范围:1370‐1700m/s HiMAX测深仪软件 集成原中海达二合一海洋测量软件、海洋后处理软件、串口调试工具、海图导航功能、多种实用工具等于一身,中海达最新推出的测深仪软件。 软件功能: ★支持NMEA‐0183数据格式输入 ★支持三维姿态数据接入,并能够进行三维姿态解算 ★能够支持多种测深数据输入输出,支持中海达测深仪格式、DESO25、SDH-13等多种数据格式 ★支持传感器类型:三维姿态仪、声速仪、GPS罗经等。 深圳中企智业投资咨询有限公司 蓝牙技术的形成背景、发展历程及现状 (最新版报告请登陆我司官方网站联系) 公司网址: https://www.360docs.net/doc/1b9198612.html, 1 目录 蓝牙技术的形成背景、发展历程及现状 (3) 第一节形成背景 (3) 第二节发展历程 (4) 第三节基本原理和特点 (6) 2、呼叫过程 (6) 3、数据传输 (7) 4、蓝牙解决的问题 (7) 5、蓝牙的解决方案 (7) (2)工作频段全球通用 (8) (3)使用方便 (8) (4)安全加密、抗干扰性强 (8) (5)多路多方向链接 (8) (6)更低碳 (8) 2 蓝牙技术的形成背景、发展历程及现状 第一节形成背景 “蓝牙”的形成背景是这样的:1998年5月,爱立信、诺基亚、东芝、IBM 和英特尔公司等五家著名厂商,在联合开展短程无线通信技术的标准化活动时提出了蓝牙技术,其宗旨是提供一种短距离、低成本的无线传输应用技术。这五家厂商还成立了蓝牙特别兴趣组,以使蓝牙技术能够成为未来的无线通信标准。芯片霸主Intel公司负责半导体芯片和传输软件的开发,爱立信负责无线射频和移动电话软件的开发,IBM和东芝负责笔记本电脑接口规格的开发。1999年下半年,著名的业界巨头微软、摩托罗拉、三星、朗讯与蓝牙特别小组的五家公司共同发起成立了蓝牙技术推广组织,从而在全球范围内掀起了一股“蓝牙”热潮。全球业界即将开发一大批蓝牙技术的应用产品,使蓝牙技术呈现出极其广阔的市场前景,并预示着21世纪初将迎来波澜壮阔的全球无线通信浪潮。 关于蓝牙这个名字的由来还有一个小故事。“蓝牙”这名称来自10世纪的丹麦国王哈拉尔德(Harald Gormsson)的外号。出身海盗家庭的哈拉尔德统一了北欧四分五裂的国家,成为维京王国的国王。由于他喜欢吃蓝莓,牙齿常常被染成蓝色,而获得“蓝牙”的绰号,当时蓝莓因为颜色怪异的缘故被认为是不适合食用的东西,因此这位爱尝新的国王也成为创新与勇于尝试的象征。1998年,爱立信公司希望无线通信技术能统一标准而取名“蓝牙”。 随着蓝牙技术由手机、游戏、耳机、便捷式电能和汽车等传统应用领域向物联网、医疗等新领域扩展,市场对低功耗的要求越来越高。蓝牙4.0协议版本是蓝牙3.0高速版本基础上增加了低能消耗协议部分。嵌入式设备在很多应用场景要求能耗非常低,传输速率要求也不高,对于这类设备,可以仅实现4.0协议中低耗能蓝牙部分,通过与支持双模的主机设备进行通信或者跟同类设备通信。 由于蓝牙4.0协议拥有极低的运行和待机功耗,使用一粒纽扣电池甚至可持续工作数年之久;同时还有低成本、跨厂商互操互作性、2毫秒低延迟、AES-128加密等诸多特色,可以广泛应用于计步器、心律监视器、智能仪表、传感器物联 3 常用音频接口介绍 常用音频接口介绍 概述 在广播电视系统节目采编及传送机房的日常技术维护中,会接触到各式各样的音频类接口。音频接口,是在传输音频信号时使用的接口,它可以是模拟的,也可以是数字的。不同的音频应用领域,往往会有不同的接口,随着技术的进步,接口的种类也在不断的发展、增多。如果缺乏对音频接口知识的基本了解,在日常的技术维护中,势必会妨碍对于音频传送,音频测试与测量的理解与应用,本文对常用的音频接口做较详细的介绍。 首先,明确两个概念的涵义及关系:接口(Interface)和连接器(通常也叫做接头,Con nector)。不同的音频标准都需要定义各自的硬件接口标准,硬件接口定义了电子设备之间连接的物理特性,包括传输的信号频率、强度,以及相应连线的类型、数量,还包括插头、插座的机械结构设计。连接器是接口在物理上的实现,是实现电路互连的装置。人们将接头分成两类:“公头”(或“阳头”)和“母头”(或“阴头”),一言以概之,即插头(Male connector、plug)和插座(Female connector、socket)。在实际应用中,人们经常习惯于将接口(Interface)和接头(Connector)二者不加区分的通用,因此,本文在文字描述上也不做严格的区分。 模拟音频接口 1.TRS 接头 2.5mm接头在手机类便携轻薄型产品上比较常见,因其接口可以做的很小; 3. 5mm接头在PC类产品以及家用设备上比较常见,也是我们最常见到的接口类型;6.3mm接头是为了提高接触面以及耐用度而设计的模拟接头,常见于监听等专业音频设备上,例如:节目传输类机房大多用此接头来监听节目质量。接下来介绍3.5mm和6.3mm两种规格的TRS 接头。 2.1.1 (1/8′ 3.5mm) TRS接头俗称:(小三芯) 3.5mm TRS接头又称小三芯或者立体声接头,是目前见到的最主要的声卡接口,除此之外,包括绝大部分MP3播放器,MP4播放器和部分音乐手机的耳机输出接口也使用这种接头。 根据实际使用需要,我们还能看到有4芯甚至5芯的这种接头。例如:松下某款磁带随身听上看到的4芯3.5mm接头,多出来的一根线是传送线控信号用的,再比如手机上常见的4芯2. 5mmTRS接头,多出来的那个芯是用来与头戴式耳机的麦克风相连,用来传送由语音信号经麦克风转换后的电信号。另外,芯数也能减少,譬如卡拉ok话筒与功放相连的插头,即为卡侬头(卡侬头将在后文介绍)转2芯6.3mm TRS接头,可 以用来传送非平衡的单声道音频信号。关于大三芯插头的定义,如下图: 图5) 2. RCA 模拟音频接头 中海达数字测深仪与天宝GNSS R8 联机操作说明 上海勘测设计研究院 二○○九年五月 中海达测深仪与天宝R8联机操作说明 在水上开始作业时,启动“中海达海洋测深测量软件28.0”时,软件出现“未检测到GPS信号”…… 因为中海达测深仪最大可选波特率为9600,而天宝GPS波特率为38400,所以只能修改天宝的传输波特率为9600,才能联机成功。 方法: 采用天宝“Configuration Toolbox”程序进行。 首先保证用天宝天线头的端口1(Serial-Port1,小圆形端口)与测深仪的串口2(COM2)相联,目的是用Serial-Port1来修改天宝天线头Serial-Port2(9针串口)的属性。 以下为处理步骤: Seriall-Port2Serial-Port1 1天宝R8底座 2 启动“Configuration Toolbox”后菜单 3选取“Comfiguration”4选取“Get File” 5“Get File”列表6选取“CURRENT” 7提示,单击“确定” 8 需选择“□Applied immediately”项复选框(表示要立即生效) 9准备检查修改“Serial-Port1” 10需选择“□Configure channels separately”复选框修改传输(Transmit)的波特率(Baud rate): 11单击Baud rate的下拉框▼,显示Baud rate下拉列表 12选中9600,与测深仪最大波特率9600同步 13单击“Transmit” 14单击“是(Y)”(测深仪上可能会显示其它文件名) 玩转投影机接口连线图解 很多初级用户在看投影机文章或将投影机与其它设备进行连接时,面对众多的接口总是感到茫然。其实只要弄明白它们的用途和连/转接方法,在使用时您会觉得其也并非有登天之难。 投影机接口虽没有高档功放上那么多 但也不少 家用投影机上的常用接口 拉近点就看清楚了 一、常规视频输入端子 做为视频播放设备,投影机上输入端子(端子=接口)的数量远多于输出端子,视频端子的数量也远多于音频端子。 ●标准视频输入(RCA) RCA是莲花插座的英文简称,RCA输入输出是最常见的音视频输入和输出接口,也被称AV接口(复合视频接口),通常都是成对的,把视频和音频信号“分开发送”,避免了因为音/视频混合干扰而导致的图像质量下降。但由于AV接口传输的仍是一种亮度/色度(Y/C)混合的视频信号,仍需显示设备对其进行亮/色分离和色度解码才能成像,这种先混合再分离的过程必然会造成色彩信号的损失,所以其目前主要被用在入门级音视频设备和应用上。 音频转RCA线 RCA转接延长头 插入示意图 白色的是音频接口和黄色的视频接口,使用时只需要将带莲花头的标准AV线缆与其它输出设备(如放像机、影碟机)上的相应接口连接起来即可。 不要小瞧了RCA,其也有做工不错的高档货 ●S端子 标准S端子 标准S端子连接线 音频复合视频S端子色差常规连接示意图 S端子(S-Video)是应用最普遍的视频接口之一,是一种视频信号专用输出接口。常见的S端子是一个5芯接口,其中两路传输视频亮度信号,两路传输色度信号,一路为公共屏蔽地线,由于省去了图像信号Y与色度信号C的综合、编码、合成以及电视机机内的输入切换、矩阵解码等步骤,可有效防止亮度、色度信号复合输出的相互串扰,提高图像的清晰度。 一般DVD或VCD、TV、PC都具备S端子输出功能,投影机可通过专用的S端子线与这些设备的相应端子连接进行视频输入。 显卡上配置的9针增强S端子,可转接色差 Android蓝牙协议栈 Android蓝牙协议栈使用的是BlueZ,支持GAP, SDP, and RFCOMM规范,是一个SIG认证的蓝牙协议栈。 Bluez 是GPL许可的,因此Android的框架内与用户空间的bluez代码通过D-BUS进程通讯进行交互,以避免专有代码。 Headset和Handsfree(v1.5)规范就在Android框架中实现的,它是跟Phone App紧密耦合的。这些规范也是SIG认证的。 下面的图表提供了一个以库为导向的蓝牙栈视图。 实线框的是Android模块,红色虚线部分为合作伙伴指定模块(译者注:芯片商提供)。 下面的图表是以进程为导向视图: 移植 BlueZ是兼容蓝牙2.1的,可以工作在任何2.1芯片以及向后兼容的旧的蓝牙版本。有要有两个方面: ?串口驱动 UART driver ?蓝牙电源开/关 Bluetooth Power On/Off 串口驱动 BlueZ核心子系统使用hciattach守护进程添加你的指定硬件串口驱动。 例如,MSM7201A,这个文件是在drivers/serial/msm_serial.c。你还需要通过修改init.rc为hciattach来编辑命令 行选项。 蓝牙电源开/关 蓝牙芯片的电源开关方法1.0和Post 1.0是不同的,具体如下: ? 1.0:Android框架写0或1到/sys/modules/board_[PLATFORM]/parameters/bluetooth_power_on ?Post 1.0:Android框架使用linux rfkill API,参考 arch/arm/mach-msm/board-trout-rfkill.c例子。 编译 编译Android打开蓝牙支持,添加下面这行内容到BoardConfig.mk。 BOARD_HAVE_BLUETOOTH :=true 解决问题 调试 调试你的蓝牙实现,可以通过读跟蓝牙相关的logs(adb logcat)和查找ERROR和警告消息。Android使用Bluez,同时 会带来一些有用的调式工具。下面的片段为了提供一个建议的例子: hciconfig -a # print BT chipset address and features. Useful to check if you can communicate with your BT chipset. hcidump -XVt # print live HCI UART traffic. hcitool scan # scan for local devices. Useful to check if RX/TX works. l2ping ADDRESS # ping another BT device. Useful to check if RX/TX works. sdptool records ADDRESS # request the SDP records of another BT device. 守护进程日志 hcid(STDOUT)和hciattach(STDERR)的守护进程日志缺省是被写到/dev/null。编辑init.rc和init.PLATFORM.rc在logwrapper下运行这些守护进程,把它们输出到logcat。 hciconfig -a 和 hcitool 第三章 HD-27/HD-28测深仪§3.1 性能指标及特点 图3-1 HD-27/28测深仪外形 图3-2 双频换能器 图3-3 单频换能器 HD-27/28测深仪性能指标: 高频发射频率:200KHz 低频发射频率:20KHz 最大发射功率:300W 测深范围:高频0.3m~600m,低频1.0m~3000m 测深精度:高频精度±2cm+0.1%,低频精度±5cm+0.1% 吃水调整范围:0.0m~9.0m 声速调整范围:1300~1700m/s CPU主频667MHz,256M RAM内存 锲入式工业控制WINDOWS Xp操作平台 亮度12寸液晶显示屏,分辨率800×600 串口数据输出,仿真多种数据格式,波特率2400-115200可调 电阻式触摸屏 外接端口:鼠标、键盘、打印口、两个RS-232串口、两个USB口、外接分显示器接口内置1000M大容量电子盘存贮器 供电电源:直流12V或交流220 V,功耗30W 环境:工作温度-20℃~70℃,防水 尺寸:34×30×14cm 重量:10.2 kg 特点: 高速A/D转换,采样速率153600次/秒,瀑布式显示 数字化图像处理技术,瀑布式图像显示及记录,并可回放及打印 自动增益控制及时间增益控制(TVG) 水底门跟踪技术和脉宽选择技术的完美结合 内锲测深和测量一体化软件,可省去购买一台电脑和一套海洋测量软件 电阻式触摸屏,用手指即可操作 §3.2 配置 名称型号数量说明主机HD-27/28 1 高频换能器(HD-27)DS-200 1 200KHz 双频换能器(HD-28)DS-300 1 200KHz,20KHz 换能器安装杆TD-27 1 两段分节 直流电源线PW-5 1 直流电源线 交流电源线PW-6 1 交流电源线 手动打标线MK-2 1 用于手动按钮打标 鼠标键盘中转线MKY-2 1 外接键盘不定 1 外接鼠标不定 1 数据电缆RS-9 2 外接串口连接线 U盘不定 1 存取数据用 铝合金箱LH-17 1 主机携带箱 §3.3 安装连接图 图3-4 换能器安装图 各种显示接口的介绍 中国投影网行业资讯2009-9-10 9:47:10编辑:晨阳[ 大中小] TV接口 TV接口又称RF射频输入,毫无疑问,这是在电视机上最早出现的接口。TV接口的成像原理是将视频信号(CVBS)和音频信号(Audio)相混合编码后输出,然后在显示设备内部进行一系列分离/ 解码的过程输出成像。由于需要较多步骤进行视频、音视频混合编码,所以会导致信号互相干扰,所以它的画质输出质量是所有接口中最差的。 AV接口 AV接口又称(RCA)可以算是TV的改进型接口,外观方面有了很大不同。它传输的是复合视频信号,也称做复合视频信号(CVBS)接口。分为了3条线,分别为:音频接口(红色与白色线,组成左右声道)和视频接口(黄色)。由于AV输出仍然是将亮度与色度混合的视频信号,所以依旧需要显示设备进行亮度和色彩分离,并且解码才能成像。这样的做法必然对画质会造成损失,所以AV接口的画质依然不能让人满意。 在连接方面非常的简单,只需将3种颜色的AV线与电视端的3种颜色的接口对应连接即可。总体来说,AV接口实现了音频和视频的分离传输,在成像方面可以避免音频与视频互相干扰而导致的画质下降。AV接口在电视与DVD连接中使用的比较广,是每台电视必备的接口之一。 S端子 S端子可以说是AV端子的改革,在信号传输方面不再将色度与亮度混合输出,而是分离进行信号传输,也就是Y、C分离传输,所以我们又称它为“二分量视频接口”。与AV 接口相比,S端子不再对色度与亮度混合传输,这样就避免了设备内信号干扰而产生的图像失真,能够有效的提高画质的清晰程度。 但S-Video仍要将色度与亮度两路信号混合为一路色度信号进行成像,所以说仍然存在着画质损失的情况。虽然S端子不是最好的,不过一般情况下AV信号为640线,S端子可达到1024线,但是这需要由片源来决定。一般来说这种接口在DVD、PS2、XBOX、NGC 等视频和游戏设备上广泛使用。 色差分量接口 对于色差来说,目前可能应用并不算很普遍,主要的原因是一些CRT电视机并没有提供色差分量的输入接口。简单的说,相比过去的AV和S端子,色差是将信号分为红、绿、 蓝牙技术的起源与发展 从音频传输、图文传输、视频传输,再到以低功耗为主打的物联网传输,蓝牙应用的场景也越来越广。 世界是蓝色的,而不知不觉这个世界将有40 亿蓝牙设备了。这篇文章,我们将带你一起回顾蓝牙 1.0 到 5.0 的技术变迁,从音频传输、图文传输、视频传输,再到以低功耗为主打的物联网传输。我们还将和你一起梳理,越来越广阔的蓝牙应用的场景。关于蓝牙技术你所不知道的前世今生,都在这里了。 也许很少有人知道,蓝牙(Bluetooth)一词取自于十世纪丹麦国王哈拉尔的名字Harald Bl 分。 蓝牙的起源 蓝牙的历史实际上要追溯到第二次世界大战。蓝牙的核心是短距离无线电通讯,它的基础来自于跳频扩频(FHSS)技术,由好莱坞女演员Hedy Lamarr 和钢琴家George Antheil 在1942 年8 月申请的专利上提出。他们从钢琴的按键数量上得到启发,通过使用88 种不同载波频率的无线电控制鱼雷,由于传输频率是不断跳变的,因此具有一定的保密能力和抗干扰能力。 起初该项技术并没有引起美国军方的重视,直到20 世纪80 年代才被军方用于战场上的通信设备通过移动电话接入到蜂窝网上,而这种连接的最后一段就是短距离的无线连接。随着项目的进展,爱立信把大量资源投入到短距离无线通讯技术的研发上。 1998 年5 月20 日,爱立信联合IBM、英特尔、诺基亚及东芝公司等5 家著名厂商成立「特别兴趣小组」(Special Interest Group,SIG),即蓝牙技术联盟的前身,目标是开发一个成本低、效益高、可以在短距离范围内随意无线连接的蓝牙技术标准。当年蓝牙推出0.7 规格,支持Baseband 与LMP(Link Manager Protocol)通讯协定两部分。 1999 年先后推出0.8 版、0.9 版、1.0 Draft 版。完成了SDP(Service Discovery Protocol)协定和TCS(Telephony Control Specification)协定。 华测测深仪产品系列 D330测深仪 操作手册 第一版 上海华测导航技术有限公司 二○一○年九月 目录 第一章测深仪的工作原理 (1) §1.1测深仪简介 (1) §1.2测深仪的技术原理 (1) §1.2.1回声测深的原理 (2) §1.2.2测深仪相关参数 (2) §1.3测深仪的相关名词 (4) §1.3.1水深数据分类 (4) §1.3.2数据格式 (4) §1.3.3测量周期设置 (5) §1.3.4声速设置 (6) §1.3.5吃水深度设置 (7) 第二章D330测深仪 (8) §2.1性能指标及特点 (8) §2.2标准配置单 (10) §2.3安装连接图 (11) §2.4测深软件主界面 (12) § 2.4.1主菜单 (12) § 2.4.2快捷工具栏 (13) § 2.4.3状态栏 (14) § 2.4.4测量参数设置 (14) § 2.4.5调用屏幕键盘 (15) §2.5操作步骤 (16) § 2.5.1水深数据采集 (16) § 2.5.2水深数据回放 (16) § 2.5.3水深数据复制和备份 (17) 第三章与GPS联机测量 (18) §3.1连接GPS (18) § 3.1.1与GPS设备的连接安装 (18) § 3.1.2连接安装的注意事项 (18) §3.2水上测量软件的设置 (19) §3.3升级和注册 (22) § 3.3.1固件升级 (22) § 3.3.2注册测深仪 (22) 第四章其他相关操作 (28) §4.1触摸屏的校准 (28) §4.2整机的维护注意事项 (30) § 4.2.1主机的维护 (30) § 4.2.2换能器的维护 (30) § 4.2.3换能器连接杆的维护 (31) § 4.2.4安全注意事项 (33) 附录联系方式 (34) 视频基础知识 目前,国内外各个视频会议生产厂家都陆续推出了自己的各种高清或超清产品,都在不遗余力的宣传图像分辨率。但是,要达到高清/超清的视频会议,单单有720p或者1080p的图像分辨率是不够的。视频会议作为多媒体的一种应用,整个系统涉及到前端视频采集、图像的编码能力、高质量的网络传输、高清晰的视频显示设备。另外,如果我们在观看高清晰视频图像的时候,不能得到一个更清晰、连续的音频效果,那么这个过程实际上就没有任何意义,所以高质量音频的重要性完全不亚于视频。所以在高清或者超清的视频会议中有几个关键的知识点需要了解:高清的视频分辨率、高清视频显示设备的接口、高质量的音频传输接口、高质量的音频。技术的发展都是循序渐进的过程,在本文档中不但列出了高清视频的相关术语,还把非高清视频系统中的相关术语也一并列出,这样会有一个很直观的比较过程。 1视频接口 我们经常在家里的电视机、各种播放器上,视频会议产品和监控产品的编解码器的视频输入/输出接口上看到很多视频接口,这些视频接口哪些是模拟接口、哪些是数字接口,哪些接口可以传输高清图像等,下面就做一个详细的介绍。 目前最基本的视频接口是复合视频接口、S-vidio接口;另外常见的还有色差接口、VGA接口、DVI接口、HDMI 接口、SDI接口。 1.1复合视频接口 1.1.1接口图 1.1.2说明 复合视频接口也叫AV接口或者Video接口,是目前最普遍的一种视频接口,几乎所有的电视机、影碟机类产品都有这个接口。 它是音频、视频分离的视频接口,一般由三个独立的RCA插头(又叫梅花接口、RCA接口)组成的,其中的V接 口连接混合视频信号,为黄色插口;L接口连接左声道声音信号,为白色插口;R接口连接右声道声音信号,为 红色插口。 1.1.3评价 它是一种混合视频信号,没有经过RF射频信号调制、放大、检波、解调等过程,信号保真度相对较好。图像品质 影响受使用的线材影响大,分辨率一般可达350-450线,不过由于它是模拟接口,用于数字显示设备时,需要一 个模拟信号转数字信号的过程,会损失不少信噪比,所以一般数字显示设备不建议使用。 1.2S-Video接口 1.2.1接口图 1.2.2说明 S接口也是非常常见的接口,其全称是Separate Video,也称为SUPER VIDEO。S-Video连接规格是由日本人开发的一种规格,S指的是“SEPARATE(分离)”,它将亮度和色度分离输出,避免了混合视讯讯号输出时亮度和色度的相互干扰。S接口实际上是一种五芯接口,由两路视亮度信号、两路视频色度信号和一路公共屏蔽地线共五条芯线组成。 1.2.3评价 同AV 接口相比,由于它不再进行Y/C混合传输,因此也就无需再进行亮色分离和解码工作,而且使用各自独立的传 目录 目录............................................................................................................................................................................................ I 摘要 ........................................................................................................................................................................................II ABSTRACT (3) 第一章绪论 (4) 1.1引言 (4) 第二章蓝牙技术现状 (5) 2.1目前蓝牙技术发展的现状 (5) 2.1.1发展迅速应用广泛 (5) 2.1.2技术应用问题凸现 (6) 第三章蓝牙技术发展趋势 (9) 3.1增加消费者的认知度 (9) 3.2产品应具有互操作性 (9) 3.3产品应使用方便 (9) 第四章局域网组建 (10) 4.1蓝牙体系结构 (10) 4.1.1体系结构 (10) 4.1.2硬件部分 (10) 4.1.3蓝牙协议(软件) (11) 4.1.4路由机制 (11) 4.2具体组网方案 (13) 总结 (14) 参考文献 (15) 摘要 蓝牙(Bluetooth)是由东芝、爱立信、IBM、Intel和诺基亚于1998年5月共同提出的近距离无线数字通信的技术标准。其目标是实现最高数据传输速度1Mb/s(有效传输速度为721kb/s)、最大传输距离为10米,用户不必经过申请便可利用2.4GHz的ISM(工业、科学、医学)频带,在其上设立79个带宽为1MHz的信道,用每秒钟切换1600次的频率、滚齿方式的频谱扩散技术来实现电波的收发。 一项新技术的出现,人们对它抱的期望值往往很高,往往短期内不能令人满意,这是因为任何新技术的发展都需要有一个过程,蓝牙技术也不例外;技术标准统一,知识产权共享的优势是非常明显的,相信通过业界的共同努力,它未来的发展是不可限量的,从长远来看可能会超出人们的想象。 关键词:蓝牙现状发展 成绩评定表 课程设计任务书 阐述一种通过手机蓝牙遥控小车行走的软、硬件设计。手机蓝牙作为客户端,小车上的蓝牙模块HC-05作为服务端。客户端采用Eclipse 开发环境,J2ME编程,服务端采用单片机控制。双方通过串口仿真协议进行通信,单片机驱动直流电机控制小车行动。实验结果表明,小车可以接收手机遥控信号并灵活地进行前行、倒退、左转、右转和停止等功能。 关键词:89c52,hc-05,遥控小车,Andriod 目录 1引言 (1) 1.1课题设计目的及意义 (1) 1.1.1设计的目的 (1) 1.1.2设计的意义 (2) 2 方案比较与论证 (2) 2.1无线单元方案与比较 (2) 3 硬件电路设计 (4) 3.1 总体设计 (4) 3.2 单片机模块 (5) 3.2.1 STC89C52简介 (5) 3.2.2 L298N驱动模块及原理介绍 (6) 3.2.3 蓝牙模块 (7) 4 软件设计 (8) 4.1 智能车运动控制程序 (8) 4.2 Android蓝牙客户端设计与实现 (9) 4.2.1 客户端界面设计 (10) 4.2.2 BluetoothCar类设计 (10) 4.2.3 单片机C语言代码 (10) 5 实验结果及分析 (16) 6 心得体会 (17) 参考文献 (17) 1引言 1.1课题设计目的及意义 1.1.1设计的目的 遥控小车起源于美国,由于政府对无线遥控小车研发的资助以及相关资助的推动作用,日本、美国、德国等工业大国在遥控小车技术上占据着明显优势。我国的无线遥控小车研究工作始于20世纪中后期,在国家的863、973等技术发展计划的重点支持下,国内已大范围地进行无线遥控小车的研究。在研发应用方面取得了重要发展,但是与国际先进还存在一定的差距。无线遥控实现方法包括蓝牙、红外、射频几种,其中蓝牙技术具有一定优势。目前在信息家电方面应用正在铺。遥控小车起源于美国,由于政府对无线遥控小车研发的资助以及相关资助的推动作用,日本、美国、德国等工业大国在遥控小车技术上占据着明显优势。我国的无线遥控小车研究工作始于20世纪中后期,在国家的863、973等技术发展计划的重点支持下,国内已大范围地进行无线遥控小车的研究。在研发应用方面取得了重要发展,但是与国际先进还存在一定的差距。无线遥控实现方法包括蓝牙、红外、射频几种,其中蓝牙技术具有一定优势。目前在信息家电方面应用正在铺开。各种家电共用遥控,并可组网与公众互联网相接,共享有用信息。目前蓝牙技术实现无线遥控的短板在于传输距离短和芯片 各种通讯接口简介 ———各种通讯接口简介 作者:realinfo 发布时间:2011-5-23 10:48:53 阅读次数: 一、什么是RS-232 接口? (1) RS-232 的历史和作用 在串行通讯时,要求通讯双方都采用一个标准接口,使不同的设备可以方便地连接起来进行通讯。RS-232-C接口(又称EIA RS-232-C)是目前最常用的一种串行通讯接口。(“RS-232-C”中的“-C”只不过表示RS-232的版本,所以与“RS-232”简称是一样的)它是在1970 年由美国电子工业协会(EIA)联合贝尔系统、调制解调器厂家及计算机终端生产厂家共同制定的用于串行通讯的标准。它的全名是"数据终端设备(DTE)和数据通讯设备(DCE)之间串行二进制数据交换接口技术标准"该标准规定采用一个25 个脚的DB-25 连接器,对连接器的每个引脚的信号内容加以规定,还对各种信号的电平加以规定。后来IBM 的PC 机将RS-232 简化成了DB-9 连接器,从而成为事实标准。而工业控制的RS-232 口一般只使用RXD、TXD、GND 三条线。 (2)RS-232 接口的电气特性 在RS-232-C 中任何一条信号线的电压均为负逻辑关系。即:逻辑"1"为-3 到-15V;逻辑"0"为+3 到+15V 。RS-232-C 最常用的9 条引线的信号内容如下所示 DB-9 1 2 3 4 5 6 7 8 9 DB-25 8 3 2 20 7 6 4 5 22 定义DCD RXD TXD DTR GND DSR RTS CTS RI (3) RS-232 接口的物理结构 RS-232-C 接口连接器一般使用型号为DB-9 插头座,通常插头在DCE端,插座在DTE端. PC 机的RS-232 口为9 芯针插座。而波士RS-232/RS-485转换器的RS-232 为DB-9 孔插头。一些设备与PC 机连接的RS-232 接口,因为不使用对方的传送控制信号,只需三条接口线,即"发送数据TXD"、"接收数据RXD"和"信号地GND"。RS-232 传输线采用屏蔽双绞线。(4)RS-232 传输电缆长度 由RS-232C 标准规定在码元畸变小于4%的情况下,传输电缆长度应为50 英尺,其实这个4%的码元畸变是很保守的,在实际应用中,约有99%的用户是按码元畸变10-20%的范围工作的,所以实际使用中最大距离会远超过50英尺,美国DEC公司曾规定允许码元畸变为10%而得出下面实验结果。其中1 号电缆为屏蔽电缆,型号为DECP.NO.9107723 内有三对双绞线,每对由22# AWG 组成,其外覆以屏蔽网。2 号电缆为不带屏蔽的电缆。型号为DECP.NO.9105856-04是22#AWG 的四芯电缆。 DEC 公司的实验结果 波特率bps 1号电缆传输距离(米) 2号电缆传输距离(米) ANDROID 蓝牙编程 用BluetoothAdapter类,你能够在Android设备上查找周边的蓝牙设备然后配对(绑定),蓝牙通讯是基于唯一地址MAC来相互传输的,考虑到安全问题Bluetooth通讯时需要先配对。然后开始相互连接,连接后设备将会共享同一个RFCOMM通道以便相互传输数据,目前这些实现在Android 2.0或更高版本SDK 上实现。 一、查找发现 findding/discovering devices 对于Android查找发现蓝牙设备使用BluetoothAdapter类的startDiscovery()方法就可以执行一个异步方式获取周边的蓝牙设备,因为是一个异步的方法所以我们不需要考虑线程被阻塞问题,整个过程大约需要12秒时间,这时我们紧接着注册一个 BroadcastReceiver 对象来接收查找到的蓝牙设备信息,我们过滤ACTION_FOUND这个 Intent动作来获取每个远程设备的详细信息,通过附加参数在Intent字段EXTRA_DEVICE 和 EXTRA_CLASS, 中包含了每个BluetoothDevice 对象和对象的该设备类型BluetoothClass ,示例代码 private final BroadcastReceiver cwjReceiver = new BroadcastReceiver() { public void onReceive(Context context, Intent intent) { String action = intent.getAction(); if (BluetoothDevice.ACTION_FOUND.equals(action)) { BluetoothDevice device = intent.getParcelableExtra(BluetoothDevice.EXTRA_DEVICE); myArrayAdapter.add(device.getName() + " android123 " + device.getAddress()); //获取设备名称和mac地址 } } }; // 注册这个 BroadcastReceiver IntentFilter filter = new IntentFilter(BluetoothDevice.ACTION_FOUND); registerReceiver(cwjReceiver, filter); 最后android123提醒大家需要注意的是,记住在Service或Activity中重写onDestory()方法,使用unregisterReceiver方法反注册这个BroadcastReceiver对象保证资源被正确回收。 一些其他的状态变化有 ACTION_SCAN_MODE_CHANGED 额外参数 EXTRA_SCAN_MODE 和 EXTRA_PREVIOUS_SCAN_MODE以及SCAN_MODE_CONNECTABLE_DISCOVERABLE、 SCAN_MODE_CONNECTABLE和SCAN_MODE_NONE, 蓝牙模块 二、配对绑定 bnded/paired device 在Android中配对一个蓝牙设备可以调用BluetoothAdapter类的getBondedDevices()方法可以获取已经配对的设备,该方法将会返回一个BluetoothDevice数组来区分每个已经配对的设备,示例代码如下: Set 音频接口的输入输出口的形式分类 音频接口的输入输出口的形式分为两类:模拟口和数字口。 模拟口:主要有小三芯、莲花口、大二芯和大三芯,卡侬口(XLR)等几种。 小三芯的插口主要用于家用级的多媒体等声卡,在专业领域现在己很少使用。 莲花口用于普通的专业设备,它提供的信号电平为-10dB,目前M-AUDIO公司的audio phifle2496音频卡使用的就是这种莲花口的插头。 大二芯和大三芯用于高级的专业设备,它提供的信号电平通常为+4dB。其申大三芯的插口和卡侬口一样都平衡式的,是在信号电缆的外层又包一个屏蔽层,可以提高音频信号在传送过程中的抗干扰能力。 如果你工作室中的设备很多,各种音频线电源线经常纠缠在一起,那么使用平衡式的插口和线缆就可以减少噪声出现的可能性。目前像M-AUDIO公司的Delta系列音频接口和MOTU公司的1224使用的都是这种插口。 数字口:则有两声道的S/PDIF、AES/EBU规格和八声道的ADAT、TDIF和R-BUS等规格。 其中,S/PDIP是SONY和PHILIPS公司制定的一种音频数据格式,主要用于民用和普通专业领域,插口硬件使用的是光缆口或同轴口,现在的多轨机、DAT、CD机和MD机上都在普遍使用S/PDIF格式。 目前大多数计算机音频接口的数字输入输出口使用的都是S/PDIF的格式。 AES/EBU是美国和欧洲录音师协会制定的一种高级的专业数字音频数据格式,插口硬件主要为卡侬口,目前用于一些高级专业器材,如专业DAT,顶级采样器,大型数字调音台等。在计算机音频接口上,目前MOTU公司的1224上采用的就是AES/EBU的数字口。 ADAT是美国ALESIS公司开发的一种数字音频信号格式,因为最早用于该公司的ADAT八轨机,所以就称为ADAT格式,该格式使用一条光缆传送八个声道的数字音频信号,由于连接方便、稳定可靠,现在已经成为了一种事实上的多声道数字音频信号格式,越来越广泛地使用在各种数字音频设备上,如计算机音频接口、多轨机、数字调音台,甚至是MIDI乐器上(像KORG公司的TRINITY合成器和ALESIS 公司的QS系列合成器和音源)。目前许多公司的多声道数字音频接口,像pulsar公司的一系列产品,使用的都是ADAT口。 TDIF是日本TASCAM公司开发的一种多声道数字音频格式,使用25针类似于计算机串行线的线缆来传送八个声道的数字信号。TDIF的命运与ADAT正好相反,在推出以后TDIF没有获得其它厂家的支持,目前已经越来越少地被各种数字设备所采用,在计算机音频接口上,目前只有MOTU公司的2408上提供了TDIF的端口。 HDMI、DVI、VGA、RGB、分量、S端子)高清接口图片说明 各种视频输出端口(HDMI、DVI、VGA、RGB、分量、S端子)图片说明1.S端子 标准S端子 标准S端子连接线 音频复合视频S端子色差常规连接示意图 S端子(S-Video)是应用最普遍的视频接口之一,是一种视频信号专用输出接口。常见的S端子是一个5芯接口,其中两路传输视频亮度信号,两路传输色度信号,一路为公共屏蔽地线,由于省去了图像信号Y与色度信号C的综合、编码、合成以及电视机机内的输入切换、矩阵解码等步骤,可有效防止亮度、色度信号复合输出的相互串扰,提高图像的清晰度。 一般DVD或VCD、TV、PC都具备S端子输出功能,投影机可通过专用的S端子线与这些设备的相应端子连接进行视频输入。 显卡上配置的9针增强S端子,可转接色差 S端子转接线 欧洲插转色差、S端子和AV 与电脑S端子连接需使用专用线,如VIVO线2.VGA接口 DVI接口正在取代VGA,图为DVI转VGA的转接头 VGA是Video Graphics Adapter的缩写,信号类型为模拟类型,视频输出端的接口为15针母插座,视频输入连线端的接口为15针公插头。VGA端子含红(R)、黄(G)、篮(B)三基色信号和行(HS)、场(VS)扫描信号。VGA端子也叫D-Sub接口。VGA接口外形象“D”,其具备防呆性以防插反,上面共有15个针孔,分成三排,每排五个。VGA接口是显卡上输出信号的主流接口,其可与CRT显示器或具备VGA接口的电视机相连,VGA接口本身可以传输VGA、SVGA、XGA等现在所有格式任何分辨率的模拟RGB+HV信号,其输出的信号已可和任何高清接口相貔美。 VGA转DVI线,可用在没有VGA接口的设备上 目前VGA接口不仅被广泛应用在了电脑上,投影机、影碟机、TV等视频设备也有很多都标配此接口。很多投影机上还有BGA输出接口,用于视频的转接输出。 3.分量视频接口中海达测深仪说明书
蓝牙技术的形成背景、发展历程及现状报告
[常用,音频接口,介绍]常用音频接口介绍
中海达测深仪与天宝R8联机操作说明
(完整版)各种接口连线图解
Android蓝牙协议指南
中海达测深仪hd-27说明书
各种显示接口的介绍
蓝牙技术的起源与发展
测深仪说明书
各种接口说明资料
蓝牙技术现状和发展趋势
基于Android的蓝牙遥控小车设计
各种通讯接口简介
Android蓝牙编程
音频接口的输入输出口的形式分类
各类高清接口图片说明及会议室布线说明