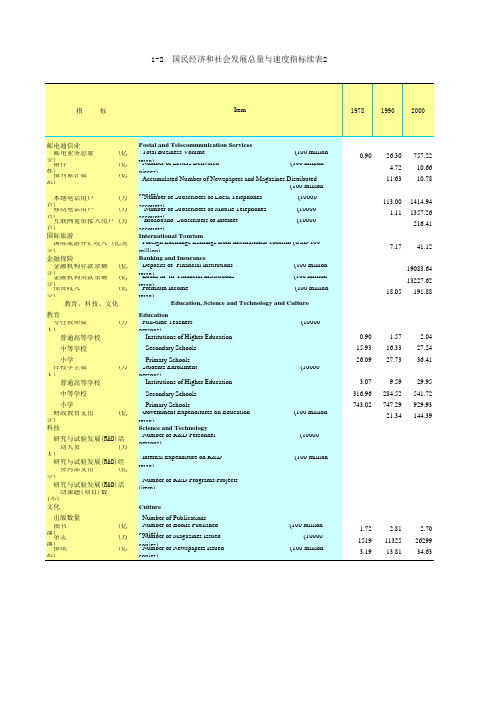
广东统计年鉴2018社会经济发展指标:国民经济社会发展总量与速度指标
广东统计年鉴2018社会经济发展指标:城镇常住居民家庭基本情况
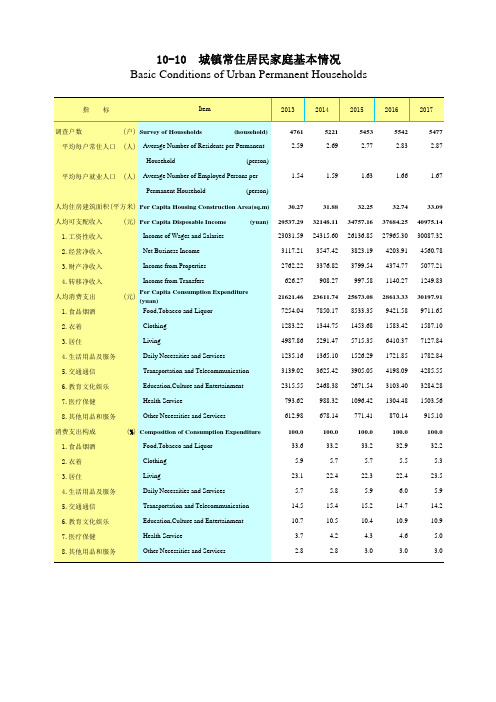
7.医疗保健
Health Service
793.62 988.32 1096.42 1304.48 1503.56
8.其他用品和服务
Other Necessities and Services
612.98 678.14 771.41 870.14 915.10
消费支出构成
(%) Composition of Consumption Expenditure
3117.21 3547.42 3823.19 4203.91 4560.78
3.财产净收入
Income from Properties
2762.22 3376.82 3799.54 4374.77 5077.21
4.转移净收入 人均消费支出
1.食品烟酒
Income from Transfers (元) Per Capita Consumption Expenditure
1.63
1.66
1.67
Permanent Household
(person)
人均住房建筑面积(平方米) Per Capita Housing Construction Area(sq.m)
30.27
31.88
32.25
32.74
33.09
人均可支配收入
(元) Per Capita Disposable Income
3.7
4.2
4.3
4.6
5.0
8.其他用品和服务
Other Necessities and Services
2.8
2.8
3.0
3.0
3.0
(yuan) Food,Tobacco and Liquor
广东统计年鉴2018社会经济发展指标:国民经济社会发展总量与速度指标续表2
1.57 16.33 27.73
2.04 27.24 36.41
3.07 316.96 743.02
9.59 284.52 747.29
21.34
29.95 541.72 929.93 144.39
1.72 1519 3.19
2.81 11325 13.81
2.70 26299 34.63
1-2 2 continued
Primary Schools Government Expenditures on Education
yuan) Science and Technology
Number of R&D Personnel
persons)
(100 million (10000
Internal Expenditure on R&D yuan)
coNpiuems)ber of Subscribers of Local Telephones
(10000
acNcouumnbtse)r of Subscribers of Mobile Telephones
(10000
acBcorouandtsb)and Subscribers of Internet
2000
2010
2016
19792017
19912017
20012017
20112017
4832.94 6892.41 6107.19 2671391.4 135961.8 4722.3
587.8
158.0
29.9
30.6
25.5
28.8
7.62
7.04
6.66
141.1
62.5
2018年广东国民经济和社会发展总体情况

2018年广东国民经济和社会发展总体情况一、综合年末全省常住人口11346.00万人,比上年末增加177万人,其中城镇常住人口8021.62万人,占常住人口的比重(常住人口城镇化率)为70.70%,比上年末提高0.85个百分点。
全年出生人口143.98万人,出生率12.79‰;死亡人口51.22万人,死亡率4.55‰;自然增长人口92.76万人,自然增长率8.24‰。
表1 2018年年末常住人口及其构成指标年末常住人口(万人)比重(%)常住人口11346.00 100.00其中:城镇8021.62 70.70乡村3324.38 29.30其中:男性5920.34 52.18女性5425.66 47.82其中:0-14 岁1949.24 17.1815-64 岁8418.73 74.2065 岁及以上978.03 8.62初步核算并经国家统计局核定,2018年全省实现地区生产总值97277.77亿元,比上年增长6.8%。
其中,第一产业增加值3831.44亿元,增长4.2%,对地区生产总值增长的贡献率为2.5%;第二产业增加值40695.15亿元,增长5.9%,对地区生产总值增长的贡献率为38.6%;第三产业增加值52751.18亿元,增长7.8%,对地区生产总值增长的贡献率为58.9%。
三次产业结构比重为4.0:41.8:54.2,第三产业所占比重比上年提高0.6 个百分点。
在第三产业中,批发和零售业增加值增长4.5%,住宿和餐饮业增加值增长2.7%,金融业增加值增长6.3%,房地产业增加值增长3.3%。
现代服务业增加值33198.45亿元,增长8.6%。
生产性服务业增加值27026.39亿元,增长7.9%。
民营经济增加值52611.59亿元,增长7.3%,占地区生产总值的54.1%。
2018年,广东人均地区生产总值达到86412元,按年平均汇率折算为13058美元。
分区域看,珠三角地区生产总值占全省比重为80.2%,东翼、西翼、山区分别占6.6%、7.4%、5.8%。
广州市社会经济发展指标统计年鉴数据:1-19各区国民经济主要指标(2018年)
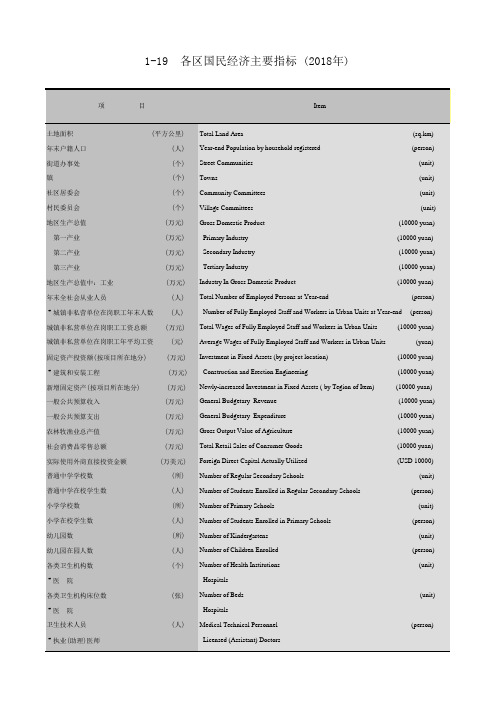
项
目
Item
土地面积
(平方公里)
年末户籍人口
(人)
街道办事处
(个)
ቤተ መጻሕፍቲ ባይዱ
镇
(个)
社区居委会
(个)
村民委员会
(个)
地区生产总值
(万元)
第一产业
(万元)
第二产业
(万元)
第三产业
(万元)
地区生产总值中:工业 年末全社会从业人员 # 城镇非私营单位在岗职工年末人数
(万元) (人) (人)
56734 259722 368614 508235
2678809 595925 2834783 3245498 3367592 20587086 7249340 7114146 8583102
9508564 32220200 15965630 42840473 15953022 14007980 13280549 6100900 5492753
(10000 yuan)
Gross Output Value of Agriculture
(10000 yuan)
Total Retail Sales of Consumer Goods
(10000 yuan)
Foreign Direct Capital Actually Utilized
(USD 10000)
Tianhe
Baiyun Huangpu Panyu
Huadu
Nansha Conghua Zengcheng
59.10
33.80
90.40
96.33
795.79
484.17
529.94
- 1、下载文档前请自行甄别文档内容的完整性,平台不提供额外的编辑、内容补充、找答案等附加服务。
- 2、"仅部分预览"的文档,不可在线预览部分如存在完整性等问题,可反馈申请退款(可完整预览的文档不适用该条件!)。
- 3、如文档侵犯您的权益,请联系客服反馈,我们会尽快为您处理(人工客服工作时间:9:00-18:30)。
能源生产总量
Total Energy Production
能源消费总量
Total Energy Consumption
5064.15 5064.15 2586.68 2477.47
6246.32 6347.19 3249.76 3097.43 2335.77 4011.42
7498.54 8650.03 4402.87 4247.16 4757.52 3892.51
10810.21 986.32
5055.71 4768.18
12817 10810.21
5717.11 4474.11 1243.00 3917.11 3160.12
756.99 1175.99
3233.70 858.61
23520.91 13492.94
79.86 667.36 4379.81
Consumer Price Index
工业生产者出厂价格指数
Producer Price Index for Manufactured Goods
固定资产投资价格指数
Investment in Fixed Assets Price Indices
能源生产与消费 (万吨标准 Production and Consumption of Energy (10000 tons of SCE)
2275.95 3118.10 3989.32
185.85 55.31 86.62 43.92 370
194.14 130.02 111.46
18.56 54.79 37.93 16.86
9.33
1559.03 384.59 615.86 558.58 2484
1541.99 938.48 807.84 130.64 502.90 336.61 166.29 100.61
最终消费支出
Final Consumption Expenditures
居民消费
Household Consumption Expenditures
政府消费
Government Consumption Expenditures
资本形成总额
Gross Capital Formation
固定资本形成总额
Imports
出口额
Exports
利用外资
(亿美元) Foreign Capital Utilized
(USD 100 million)
实际利用外商直接投资
Foreign Direct Investment Actually Utilized
财政
(亿元) Government Finance
(100 million
Principal Aggregate Indicators on National Economic and Social Development and Growth Rates
1-2 国民经济和社会发展总量与速度指标
指
标
Item
1978
1990
2000
人口与就业
Population and Employment
人口
(万人) Population
(10000
年末户籍总人口
Population with Residence Registration at the Year-end
Gross Fixed Capital Formation
存货增加
Changes in Inventories
货物和服务净流出
Net Exports of Goods and Services
固定资产投资
(亿元) Investment in Fixed Assets
(100 million yuan)
固定资产投资总额
Investment in Fixed Assets
#房地产开发
Real Estate Development
施工房屋建筑面积(万平方 Floor Space of Buildings under Construction
(10 000
竣工房屋建筑面积(万平方 Floor Space of Buildings Completed
(10 000
消费
(亿元) Domestic Trade
(100 million
社会消费品零售总额
Total Retail Sales of Consumer Goods
对外贸易
(亿美元) Foreign Trade
(USD 100
货物进出口总额
Total Exports and Imports
进口额
年末常住人口
Permanent Population at the Year-end
男性人口
Male
女性人口
Female
城镇人口
Urban Population
乡村人口
Rural Population
就业
(万人) Employment
(10000
年末就业人员人数
Employed Persons at the Year-end
第一产业
Primary Industry
第二产业
Secondary Industry
第三产业
Tertiary Industry
人均地区生产总值 (元) Per Capita Gross Domestic Product
支出法地区生产总值 (亿元) Gross Domestic Product by Expenditure Approach(100 million
418.98 196.77 222.21
1701.06 781.87 919.19
14.60 122.37
41.82 28.70
131.02 910.56 150.69 1069.86
100.4
95.6
99.9
97.5
101.4
103.4
1006.24 3711.69 4044.28 9447.70
城镇登记失业人数
Number of Registered Unemployed Persons in Urban Areas
宏观经济
Macro Economy
国民经济核算
(亿元) National Accounting
(100 million yuan)
地区生产总值
Gross Domestic Product
地方一般公共预算收入
Local Public Budgetary Revenue
地方一般公共预算支出
Local Public Budgetary Expenditure
价格指数
(上年=100) Price Indices
(preceding
商品零售价格指数
Retail Price Index
居民消费价格指数