Channel model[1]
Shannon capacity[香浓定律]
![Shannon capacity[香浓定律]](https://img.taocdn.com/s3/m/7dc5e919581b6bd97f19ea3a.png)
1 1 I log 2 log 2 log 2 M P(x) 1/ M
(bit)
Channel Capacity and Entropy
For the discrete information source of unequal probability: If the information source consists of M symbols, and the symbol values x1 , x2, ..., xM appear with probabilities P(x1 ), P(x 2 ),..., P(x M ) ,then each symbol contains the amount of information :
Communication System
In the receiver the corresponding inverse operations are implemented:
●
Modulation
Channel Decoding Source Decoding
●
●
To the end , the channel encoder introduces redundancy into the information sequence u. This redundancy can be exploited by the channel decoder for error detection or error correction by estimating the transmitted symbol sequence û .
Communication System
The basic structure of a Digital Communication System is show which represents the architecture of the communication systems in use today.
PA,PB,VA,VB等信道模型

信道模型一、主要用到的几种信道模型1.程序中采用的信道模型:PA, PB, VA, VB, TU, RA, HT, EV A, ETU, AWGN, flat Rayleigh , Winner U。
2.con tributi ons仿真中采用的信道模型:ETU, EPA, TU, PB, PA, TU-6, VB。
二、具体信道模型参数1. PA,PB---摘自:ITU-R M.1225TABLE 4挝琴戏卩2. VA, VB---摘自:ITU-R M.12251AHLE 53.EPA, EVA, ETU----摘自3GPP TS 36.104Table B.2-1 Exte nded Pedestrian A model (EPA)Table B.2-3 Extended Typical Urban model (ETU)4. 3GPP TU,RA,HT 信道----3GPP TR 25.943Typical Urban channel model (Tux)5.2 Rural Area channel model (Rax)5.15.3 Hilly Terrain channel model (HTx)5. COST207 的信道模型-TU, RA, HT这部分与程序中的略有不同。
还需要再研究。
注:摘自Molisch编著的《宽带无线数字通信》(许希斌等译,电子工业出版社),P29—P313.6.2 COST 207 ft型卅*延时线摸册的一亍特洌是估胡?伪槟型丫迄希卅了网种典俎坏境下的PDF或捕头取且绷弟普勒凱谓创二它跆出的PDP已被在袪国、英国、荷兰、瑞禮和朗上迸行的尢宣实验船U 所?H古,这四种哋型环埋是(枷E13再所示):•乡村地区(RA)心韵10•典型城市地(K11UI•恋劣诚市地区(BU}•山蔭地釈HT)呛八仏“少七)<10 < r <0,7怦其他估,&2)0 < r < 7 ;cs C3 6.3) it他0 < T < S5 < T < 10(3.6.4)其他0 < r < 2(3,6.5) IS < r < 20 f(s其他在抽头廷I1J 线模型中,毎个fSiS 郝行••个鬧利分布的竭度和一个多静勒癞乳其中i 表示 第i 个抽头。
Mobile radio channels modeling in Matlab
RADIOENGINEERING, VOL. 12, NO. 4, DECEMBER 2003
13
2 . K = β 2 / 2σ 0
(2)
The best- and worst-case Rician fading channels associated with K-factors of K = ∞ and K = 0 are the Gaussian and Rayleigh channels with strong LOS and no LOS path, respectively. So, the Rayleigh fading channel can be considered as a special case of a Rician fading channel with K = 0. The Rician PDF is given by [3]
2. The Mobile Radio Channel
The mobile radio channel is characterized by two types of fading effects: large-scale fading and small scale fading [1], [2]. Large-scale fading is the slow variation of the mean (distant-dependent) signal power over time. This depends on the presence of obstacles in the signal path and on the position of the mobile unit. The large-scale fading is assumed to be a slow process and is commonly modeled as having lognormal statistics. Small-scale fading is also called Rayleigh or Rician fading because if a large number of reflective paths is encountered the received signal envelope is described by a Rayleigh or a Rician probability density function (PDF) [3]. The small-scale fading under consideration is assumed to be a flat fading (i.e., there is no intersymbol interference). It is also assumed that the fading level remains approximately constant for (at least) one signaling interval. With this model of fading channel the main difference with respect to an AWGN channel resides in the fact that fading amplitudes are now Rayleigh- or Riciandistributed random variables, whose values affect the signal amplitude (and, hence, the power) of the received signal. The fading amplitudes can be modeled by a Rician or a Rayleigh distribution, depending on the presence or absence of specular signal component. Fading is Rayleigh if the multiple reflective paths are large in number and there is no dominant line-of-sight (LOS) propagation path. If there is also a dominant LOS path, then the fading is Rician-distributed. The fading amplitude ri at the ith time instant can be represented as
朗达科 RD6110 和 RD6111 紧凑型平板记录仪说明书
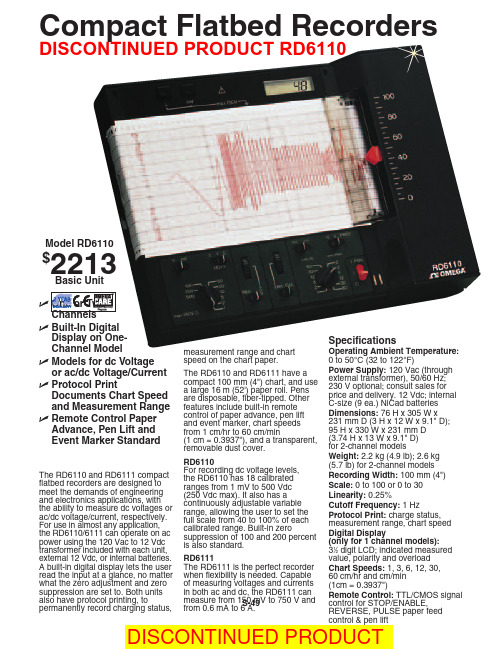
The RD6110 and RD6111 compact flatbed recorders are designed to meet the demands of engineering and electronics applications, with the ability to measure dc voltages or ac/dc voltage/current, respectively.For use in almost any application,the RD6110/6111 can operate on ac power using the 120 Vac to 12 Vdc transformer included with each unit,external 12 Vdc, or internal batteries.A built-in digital display lets the user read the input at a glance, no matter what the zero adjustment and zero suppression are set to. Both units also have protocol printing, topermanently record charging status,measurement range and chart speed on the chart paper.The RD6110 and RD6111 have a compact 100 mm (4") chart, and use a large 16 m (52') paper roll. Pens are disposable, fiber-tipped. Other features include built-in remote control of paper advance, pen lift and event marker, chart speeds from 1 cm/hr to 60 cm/min(1 cm = 0.3937"), and a transparent,removable dust cover.RD6110For recording dc voltage levels, the RD6110 has 18 calibrated ranges from 1 mV to 500 Vdc (250 Vdc max). It also has a continuously adjustable variable range, allowing the user to set the full scale from 40 to 100% of each calibrated range. Built-in zerosuppression of 100 and 200 percent is also standard.RD6111The RD6111 is the perfect recorder when flexibility is needed. Capable of measuring voltages and currents in both ac and dc, the RD6111 can measure from 150 mV to 750 V and from 0.6 mA to 6 A.SpecificationsOperating Ambient Temperature: 0 to 50°C (32 to 122°F)Power Supply: 120 Vac (through external transformer), 50/60 Hz; 230 V optional; consult sales for price and delivery. 12 Vdc; internal C-size (9 ea.) NiCad batteries Dimensions: 76 H x 305 W x 231 mm D (3 H x 12 W x 9.1" D); 95 H x 330 W x 231 mm D (3.74 H x 13 W x 9.1" D)for 2-channel modelsWeight: 2.2 kg (4.9 lb); 2.6 kg (5.7 lb) for 2-channel models Recording Width: 100 mm (4")Scale: 0 to 100 or 0 to 30Linearity:0.25%Cutoff Frequency: 1 HzProtocol Print: charge status,measurement range, chart speed Digital Display(only for 1 channel models): 31⁄2digit LCD; indicated measured value, polarity and overload Chart Speeds: 1, 3, 6, 12, 30,60 cm/hr and cm/min (1cm = 0.3937")Remote Control: TTL/CMOS signal control for STOP/ENABLE,REVERSE, PULSE paper feedcontrol & pen liftModel RD6110$2213Basic UnitCompact Flatbed RecordersDISCONTINUED PRODUCT RD6110ߜBuilt-In Digital Display on One- Channel ModelߜModels for dc Voltage or ac/dc Voltage/Current ߜProtocol PrintDocuments Chart Speed and Measurement Range ߜRemote Control Paper Advance, Pen Lift and Event Marker StandardS-49DISCONTINUED PRODUCTZero offset: -100 to 105%, adjustableEvent Marker: 3 mm (0.12")positive needle pulse;activated by TTL or CMOS signal, or contact closureInput Type:floating, asymmetrical Max. Overload: RD6110: 250 V;RD6111: 300V for rangesto 300 V, 750 V for 750 V range, 1.5 x I (rated) for current input Input Impedance: RD6110: 1 M Ω; RD6111:1 M Ωfor V rangesVoltage Drop, RD6111: 150 mV for A ranges Source Resistance:100 ohm rated; 1 k Ωmax. for V rangesAC SMR: Greater than orequal to 40 dBAC CMR: Greater than orequal to 70 dBDC CMR:Greater than or equal to 90 dBPower Consumption:1 W typ on 1-channel, 1.5 W typon 2-channel module (4 W max.)RD6110Input Ranges: 1, 2, 5, 10, 20, 50, 100, 200, 500 mV and Vdc (250 Vdc max.)Variable Sensitivity: up to 2.5x(on 1-channel model only)Zero Suppression: 0, 100%, 200%Accuracy: 0.5% full scale RD6111Input Ranges: 0.15, 0.3, 0.6, 1.5, 3, 6, 30, 60, 150, 300 Vac/dc (750 on 1-channel model);0.6 ,1.5, 3, 6, 15, 30, 60, 150, 300,600, 1500, 6000 mA ac/dc Ranges for channel 2; 0.6, 1.5, 3, 6, 15, 30, 60,150, 300, 450, 750Vdc/ac with voltage magnifier ofzoom 60 to 100%, 9 to15, 18 to 30,36 to 60, 90 to 150, 180 to 300, 270 to 450, 450 to 750 V Accuracy, Vdc Input: 1% FS Accuracy, Vac Sinusoidal Input:1.5% FS at 50 to 60 Hz; 3% FS at 60to 10 kHz; for ranges 0.15 to 300 V;6% FS at 10 kHz to 20 kHz for ranges 0.15 to 300 VAccuracy, Adc Input: 1% FSAccuracy, Aac Sinusoidal Input:2% FS at 50 to 60 Hz; 4% FS at 60 Hzto 10 kHz; 8% FS at 10 kHz to 20 kHzModel RD6111 Vac/dc and Aac/dc Recorder. Sensor PX4202-100G5V, $295, soldseparately. See Section B of the OMEGA Complete Pressure, Strain and Force®disposable felt-tip pen and operator’s manual. OMEGACARE SM extended warranty program is available for models shown on this page.OMEGACARE SM covers parts, labor, and equivalent loaners. Ask your sales representative for fulldetails when placing an order.Ordering Example: RD6110, Vdc recorder, RD6110-CASE , carrying case,and RDX6110-RP paper, $2213 + 262 + 104 = $2579. OCW-3 OMEGACARE SM extends standard 2-year warranty to a total of 5 years ($350), $2213+ 350 = $2563.Technical Books AvailableOnline!®CANADA www.omega.ca Laval(Quebec) 1-800-TC-OMEGA UNITED KINGDOM www. Manchester, England0800-488-488GERMANY www.omega.deDeckenpfronn, Germany************FRANCE www.omega.frGuyancourt, France088-466-342BENELUX www.omega.nl Amstelveen, NL 0800-099-33-44UNITED STATES 1-800-TC-OMEGA Stamford, CT.CZECH REPUBLIC www.omegaeng.cz Karviná, Czech Republic596-311-899TemperatureCalibrators, Connectors, General Test and MeasurementInstruments, Glass Bulb Thermometers, Handheld Instruments for Temperature Measurement, Ice Point References,Indicating Labels, Crayons, Cements and Lacquers, Infrared Temperature Measurement Instruments, Recorders Relative Humidity Measurement Instruments, RTD Probes, Elements and Assemblies, Temperature & Process Meters, Timers and Counters, Temperature and Process Controllers and Power Switching Devices, Thermistor Elements, Probes andAssemblies,Thermocouples Thermowells and Head and Well Assemblies, Transmitters, WirePressure, Strain and ForceDisplacement Transducers, Dynamic Measurement Force Sensors, Instrumentation for Pressure and Strain Measurements, Load Cells, Pressure Gauges, PressureReference Section, Pressure Switches, Pressure Transducers, Proximity Transducers, Regulators,Strain Gages, Torque Transducers, ValvespH and ConductivityConductivity Instrumentation, Dissolved OxygenInstrumentation, Environmental Instrumentation, pH Electrodes and Instruments, Water and Soil Analysis InstrumentationHeatersBand Heaters, Cartridge Heaters, Circulation Heaters, Comfort Heaters, Controllers, Meters and SwitchingDevices, Flexible Heaters, General Test and Measurement Instruments, Heater Hook-up Wire, Heating Cable Systems, Immersion Heaters, Process Air and Duct, Heaters, Radiant Heaters, Strip Heaters, Tubular HeatersFlow and LevelAir Velocity Indicators, Doppler Flowmeters, LevelMeasurement, Magnetic Flowmeters, Mass Flowmeters,Pitot Tubes, Pumps, Rotameters, Turbine and Paddle Wheel Flowmeters, Ultrasonic Flowmeters, Valves, Variable Area Flowmeters, Vortex Shedding FlowmetersData AcquisitionAuto-Dialers and Alarm Monitoring Systems, Communication Products and Converters, Data Acquisition and Analysis Software, Data LoggersPlug-in Cards, Signal Conditioners, USB, RS232, RS485 and Parallel Port Data Acquisition Systems, Wireless Transmitters and Receivers。
基于径方法的SCM信道建模与仿真
天线阵元的距离; du : 移动台端第一根天线阵元相对于其它天
线阵元的距离; :第 n 条主径的第 m 条子径的随机相位; θv :
SCM 信道建模过程可以分为三个部分: 选择仿真场景、确 定用户参数和生成信道系数。基于径方法的信道建模是一种链 路级信道仿真,反映的是信道的瞬时变化特性,本文假设只考虑 单基站和单移动台之间的链路仿真, 而不考虑阴影衰落和路径 损耗。根据协议,链路级信道模型将不同的路径简化为抽头延时 张祥虎: 硕士研究生
2 SCM 信道建模
SCM 模型是一种基于子径的几何模型,是在对散射体随机 建模方法的研究基础上发展起来的空间 MIMO 信道模型。该模 型主要用于 2GHz 载频、5MHz 带宽的室外环境, 其基本原理是 利用统计子径得到信道的统计特性,如角度扩展、时延扩展等。 文献表明,基于径方法的 SCM 信道模型更能反映 MIMO 信道的 实时变化特性,而且可以用于链路级和系统级仿真。
网络与通信
文 章 编 号 :1008-0570(2012)10-0340-02
《微计算机信息》2012 年第 28 卷第 10 期
基于径方法的 SCM 信道建模与仿真
Construct-model and Simulation of the Spatial Channel Model Base on Paths
技 application value. This paper firstly analysed the basic theory of SCM channel model, secondly researched the ways of building channel models based on paths in three cases and then realized simulations. Numerical simulations show that the envelope of SCM chan-
ChannelSounding 信道传送
UCA: Uniform Circular Array, N=16 elements.
SPUCPA: Stack Polarimetric Uniform Circular Patch Array, N=96 elements.
– – – – Direction-of-Departure (DoD) Direction-of-Arrival (DoA) Time Delay Doppler Shift
MIMO Channels
– Complex Polarimetric Path Weight Matrix
February 7, 2006 S-72.4210 PG Course in Radio Communications 5
February 7, 2006
S-72.4210 PG Course in Radio Communications
11
Measurements Principle: Test Signal
• The sequential frequency testing is too slow the channel may change rapidly. • A RUSK channel sounder excites all frequencies simultaneously test signal. • For avoiding linear power amplifier problem, the phases of the spectral lines have to be optimized crest factor can be minimized. • With this test signal, the frequency response for all frequencies can be measured simultaneously frequency domain correlation process.
COFDM系统仿真及其信道噪声模块分析
COFDM 系统仿真及其同步技术分析课程名称: 信息系统软件设计与仿真 姓 名: 李日胜 学 号: 05班 级: 电子071班 指导老师: 陈俊江一、COFDM 基本原理COFDM 是将高速串行数据分成成百上千路并行数据,并分别对不同的载频进行调制,这种并行传输体制大大扩展了符号的脉冲宽度,提高了抗多径衰落的性能。
同时,在传统的频分复用方法中,各子载波之间的频谱互不重叠,频谱利用率较低。
采用 COFDM 技术,一个 COFDM 符号之内包括多个经过调制的子载波的合成信号,每个子载波在频谱上相互重叠,这些频谱在整个符号周期内满足正交性,因而在接收端可以保证无失真恢复,从而大大提高频谱利用率。
用N 表示子信道的个数,T 表示 OFDM 符号的宽度,i d (0,1,i N =…,-1)是分配给每个子信道的数据符号,c f 是第0个子载波的载波频率,则从s t t =开始的 COFDM 符号可以表示为式中,()rect 1t =,/2t T ≤。
然而在实际仿真时,通常采用复等效基带信号来描述 COFDM 的输出信号一个完整的OFDM 系统原理如图1所示。
OFDM 的基本思想是将串行数据,并行地调制在多个正交的子载波上,这样可以降低每个子载波的码元速率,增大码元的符号周期,提高系统的抗衰落和干扰能力,同时由于每个子载波的正交性,大大提高了频谱的利用率,所以非常适合移动场合中的高速传输。
在发送端,输入的高比特流通过调制映射产生调制信号,经过串并转换变成N 条并行的低速子数据流,每N 个并行数据构成一个OFDM 符号。
插入导频信号后经快速傅里叶反变换(IFFT)对每个OFDM 符号的N 个数据进行调制,变成时域信号为:接收端将接收的信号进行处理,完成定时同步和载波同步。
经A /D 转换,串并转换后的信号可表示为:yGI(n)=xGI(n)*h(n)+z(n)+w(n)(3)然后,在除去CP 后进行FFT 解调,同时进行信道估计(依据插入的导频信号),接着将信道估计值和FFT 解调值一同送入检测器进行相干检测,检测出每个子载波上的信息符号,最后通过反映射及信道译码恢复出原始比特流。
无线传感器网络传输层协议
Tradeoff: 端到端 vs. 链路层重传
• 相同旳场景, 条数是变化旳
• BER=0.001 of BSC channel fixed
• 同步使用
• 经过某些或全部旳途径同步发送完整旳数据包 • 经过几条途径发送包旳片段
• 但是发送带冗余旳片段 • 只有某些片段能够重构原来旳数据包
Example: Reliable Information Forwarding using Multiple Paths in Sensor Networks(ReInForM)
• 机制: 冗余
• Redundancy in nodes, transmission • Forward and backward error recovery • Combinations are necessary!
可靠旳数据传播 – 背景
• 传播旳对象
• Single packet • Block of packets • Stream of packets
in an end-to-end scheme? How to detect
need for retransmissions? How
to retransmit?
Tradeoff: 端到端 vs. 链路层重传
• 场景: 单个包,从源到目旳节 点经过n 跳,二进制对称信 道( BSC channel)
• 链路层,端到端重传
• 链路层重传: 最大重传旳次 数是不同旳
• 在其范围内依然不成功就丢 弃包
适用于LTE-A的SCME信道模型设计与定点仿真
适用于LTE-A的SCME信道模型设计与定点仿真陈发堂;陈雷成;郭鹏程;董丽;徐雯雯【摘要】针对LTE-A对高载频、高带宽的要求,以及SCM不再适用于未来通信系统研究的现状,实现了支持100MHz带宽、2~5GHz载频的SCME信道模型.通过对SCME特性的研究,基于Matlab平台对SCME进行了浮点链路搭建,之后采用Matlab提供的Fixed-Point Toolbox将链路定点化仿真,最后通过与浮点型数据做误差对比验证了模型的有效性和可靠性,可应用于后期FPGA实现的数据对比.【期刊名称】《广东通信技术》【年(卷),期】2014(034)009【总页数】4页(P49-52)【关键词】LTE-A;SCME;信道模型;定点仿真【作者】陈发堂;陈雷成;郭鹏程;董丽;徐雯雯【作者单位】重庆邮电大学重庆市移动通信技术重点实验室;重庆邮电大学;重庆邮电大学;重庆邮电大学重庆市移动通信技术重点实验室;重庆邮电大学重庆市移动通信技术重点实验室【正文语种】中文1 前言鉴于瑞利(Rayleigh)和莱斯(Rice)等粗略型信道模型的不精确性,为建立更贴合实际的MIMO系统信道模型,国际上各通信组织与公司对MIMO通信系统做了相应的实地测试和分析[1],在此基础上确定了许多贴近实际的MIMO无线信道模型。
比如3GPP/3GPP2组织发布的空间信道模型(SCM, Spatial Channel Model)[2]、空间信道扩展模型(SCME, Channel Model Extended)[3]以及WINNER项目中Work Package 5提出的WINNER模型[4]等。
针对LTE-A高载频、高带宽的要求,支持载频2GHz,带宽5MHz系统的室外场景模型SCM已不再适用。
因此,为了适应更大带宽,支持更多场景和不同载频的要求,需要在SCM建模方法不变的情况下进行改进和扩展。
2005年WINNERII 提出了SCME模型,随后,它被改进并应用于3GPP LTE计划,可支持2GHz和5GHz载频以及100M带宽,完全适用于LTE-A的需求。
Capacity
1.
Introduction
The purpose of this paper is to investigate the capacity of a forward link DS-CDMA cellular system with fast transmit power control (TPC) based on signal-tointerference ratio (SIR). Even for a forward link, TPC is the essential technique for a DS-CDMA cellular system. For a single cell system without background noise, TPC is not required on the forward link since all signals from a base station (BS) are transmitted together and hence vary together. So, the interference caused by the other users’ signals remain at the same level relative to the desired signal. However, in a cellular system, a mobile station (MS) receives interference from the neighboring BSs also, and the inter-cell-interference to signal power ratio depends on a location of MS. In order to satisfy the required performance of each MS, it is essential to control the transmit power of each MS according to its location. TPC scheme can be classified into slow TPC and fast TPC according to its updating speed of transmit power. Slow TPC is designed to follow propagation
- 1、下载文档前请自行甄别文档内容的完整性,平台不提供额外的编辑、内容补充、找答案等附加服务。
- 2、"仅部分预览"的文档,不可在线预览部分如存在完整性等问题,可反馈申请退款(可完整预览的文档不适用该条件!)。
- 3、如文档侵犯您的权益,请联系客服反馈,我们会尽快为您处理(人工客服工作时间:9:00-18:30)。
1第六章 無線通道模型概論 6.1 概論: 各類訊號從發射端送出之後,在到達接收端之前所經過的所有路徑,我們統稱為通道。通道對傳送訊號所產生的影響,是各類通訊系統接收機設計的一個關鍵考量。其中,如果傳送的是無線電訊號,電磁波傳播所經過的路徑,我們特別稱為無線通道。無線通道可能是很簡單的直線(目視)傳播(Line of Sight, LOS),也可能會被許多不同的因素所干擾,例如訊號經過建築物、山丘、或者樹葉反射所產生的多重路徑效應(Multipath Effect),多重路徑效應會造成訊號放大或衰減,最大和最小可以相差30到40 dB;此外,傳送端和接收端的相對運動,會使訊號產生都普勒效應(Doppler Effect),都普勒效應會使通道的特性隨著時間而改變,增加了訊號品質的不確定性。對無線通訊系統而言,因為傳播路徑的多樣性與時變性,無線通道的特性便在接收機的設計中,扮演著關鍵的角色。在無線通訊系統中,無線通道通常是利用通道的統計特性來分析與模擬,各類文獻已經提出相當多的通道模型,一般而言,整個無線通道對訊號所產生的影響,共可分為以下三大部分,它們在一個無線通道中是同時存在的:
1. 傳播路徑損耗模型(Propagation Path Loss Model):一般而言,接收訊號的功率或是傳播路徑的損耗,可以視為一個隨機變數,而傳播路徑損耗模型是用來描述接收訊號的平均功率或是傳播路徑的平均損耗,平均功率會隨著傳播距離的增加而減少,而傳播路徑的損耗會隨著距離的增加而增加,因此,這個隨機變數是一個距離的函數,而隨著距離的不同,會有不同的平均值或中間值; 2. 大尺度傳播模型(Large Scale Propagation Model):這個模型是用巨觀的角度,來描述訊號在經過較長的距離(或時間)所產生的變化,而此變化是用統計的方式來描述;此模型之中,通常是給定一特定的傳收(Transmitter-Receiver,T-R)距離,然後把接收訊號的強度,當成是一個隨機變數,這個模型通常可以用來估測無線電波的覆蓋區域; 3. 小尺度傳播模型(Small Scale Propagation Model):這個模型是用微觀的角度,來描述在很短的距離(或時間)之內,接收訊號功率所呈現快速的變動。
這三種現象在真實的通道中是同時存在的,但是在電腦模擬或是理論分析之中,很少被同時使用,主要是同時使用時的複雜度太高。一般來說,如果研究的目標是系統容量的分析、無線電波的覆蓋區域、或是換手(Handoff)的演算法,大多數時候只會用到傳播路徑損耗模型及大尺度傳播模型,因為系統容量及換手演算法只會和系統長時間、大範圍的平均訊號狀況有關;如果研究的目標是接收機基頻訊號的處理,則大多數時候只會用到小尺度傳播模型,因為基頻訊號處理的都是一個個的符元或子碼,它們的週期相對而言都較短,這時候訊號瞬間的變化就變成是一個重要的考量,也是基頻訊號處理所 2
必須克服的主要問題,此時系統仍然會受到傳播路徑損耗模型及大尺度傳播模型的影響,只不過我們通常假設這些影響已經被其他的技術所解決(如功率控制);此外,當研究的目標是功率控制時,這三種模型都有可能被採用,主要是看功率控制所設定解決的問題。
在WCDMA FDD模式之中,功率控制共分為開迴路(Open Loop)和閉迴路(Close Loop)兩大類。開迴路功率控制主要是在手機一開始和基地台(Node B)建立聯繫之時,用來粗率估測手機和基地台之間路徑所造成的功率損耗,此時手機會量測基地台的訊號強度,然後決定該使用多少功率來傳送訊號給基地台,然而上鏈和下鏈所使用的載波頻率不同,通道的衰減狀況也是各自獨立的,所以此種估測路徑所造成功率損耗的方法是非常不準確的;閉迴路功率控制又分為外迴路(Outer Loop)與內迴路(Inner Loop)兩種,外迴路功率控制的主要目的,是讓無線網路控制器(Radio Network Controller, RNC)針對每一個連線通訊品質的要求,設定一個目標訊號與干擾比(Target Signal to Interference Ratio, Target SIR),這個比值主要和服務品質(QoS)、通道衰減狀況、與車速有關;內迴路功率控制主要是使用於基地台和用戶之間的迴路,在RNC給定的Target SIR之下,用每秒鐘一千五百次的速率改變傳送功率,目的是用來對抗小尺度傳播模型所造成接收訊號的快速變化。
以上只是概略的介紹此三種通道模型,在往後章節內將會有更詳細的論述。本章將會介紹各種無線通道的特性,並藉由電腦程式的模擬,以了解傳送訊號在經過無線通道到達接收機之前,會產生什麼樣子的變化。
6.2 傳播路徑損耗模型(Propagation Path Loss Model) 無線電自發射端送出後,在空間中呈現發散的特質向四面八方傳播出去,情況就像一個不斷膨脹的球體,基於能量守恆的原理,無論半徑為多少,整個球體表面積所散佈的能量必須守恆,而球體的表面積是與距離的平方成正比,這也就是為何在真空之中,接收功率會和傳播距離平方成反比的緣故。事實上,還有很多因素會影響到能量的散逸,因此在我們所處的環境中,接收訊號的功率是和距離的三次方或四次方成反比,當然也有某些狀況會令能量的散逸較為平緩,以下將逐一介紹用來描述傳播路徑損耗的通道模型。在這裡我們主要探討三個在文獻之中較常使用的模型:自由空間傳播模型(Free Space Propagation Model)、對數距離路徑損耗模型(Log-Distance Path Loss Model)、及哈他模型(Hata Model)。
6.2.1 自由空間傳播模型(Free Space Propagation Model) 此模型是用來估測當傳送端和接收端之間沒有任何障礙物,亦指目視所及(Line of Sight,LOS)時所測得的訊號強度,此時傳送端與接收端之間的距離也是最短的,例如 3
衛星通訊就是一個最好的例子。基本上,在這種通道傳播模式底下,接收機所接收到的訊號強度是和距離的平方成反比,這也是依球面積和能量守恆定律所得來的結果。在自由空間傳播模型中,最常用的是福利斯自由空間模型(Friis Free Space Model),在一給定傳送端和接收端的距離時,此模型提供了接收端的平均接收功率。由福利斯自由空間方程式(Friis Free Space Equation),我們可以得到當傳收距離為d時,接收訊號的平均功率()dP
r為:
()()Ld
GGPdPrttr22
24πλ
= (6-1)
其中tP為傳輸功率,tG為傳送端天線的增益,rG為接收端天線的增益,L為系統散逸
係數(和傳播通道無關),λ為電磁波波長(單位為公尺)。
天線增益(tG和rG)與其有效孔徑(Effective Aperture)Ae有關: 24λπeAG= (6-2)
一般而言,天線是沒有放大訊號的功能,也就是增益為1(0 dB)。但是有些天線可以朝特定方向傳送或接收訊號,這種天線我們稱為方向性天線(Directional Antenna),對此種天線而言,無論是傳送或接收都可以獲得較高的訊號強度。此外,不同的天線設計和天線實體形狀的大小,也都會影響到有效孔徑的大小,也就都會影響到傳送或接收的訊號強度。因此,即使傳送端使用相同的傳輸功率,只要使用的傳送天線或接收天線不同,接收機所接收到的功率也就不同,對用戶而言,就似乎是天線本身有增益一般。所以tG
和rG的定義,就是使用相同的傳輸功率,透過不同的傳送或接收天線,在接收端所獲
得不同功率的比值。如果比較的對象是全向性天線(Isotropic Antenna),那麼tG和rG的
單位就是dBi (dB gain with respect to an isotropic antenna),如果比較的對象是半波長雙極天線(Half-wave Dipole Antenna),tG和rG的單位就是dBd (dB gain with respect to a
half-wave dipole antenna)。
另外在(6-1)中,還有一個修正用的參數L,這代表系統中其他所有散逸的總和,此參數通常是由整個通訊系統中的傳輸線衰減、濾波器散逸、和天線散逸所造成,若L=1則代表在系統硬體上並無任何功率散逸。
另外,由福利斯自由空間模型中,我們可以看出在0=d時,接收功率是無法定義的,有鑒於此,通常會在此模型中定義一個陷入距離(Close-in Distance)0d,在0d所接
收到的功率被當作是參考功率。因此,對於任何距離0dd>,我們都可以將福利斯自由
空間模型表示成:
()()()()20020202222244⎟⎠⎞⎜⎝⎛⋅=⎟⎠⎞⎜⎝⎛⋅==dddPddLdGGPLdGGPdPrrttrttrπλπ
λ (6-3) 4
6.2.2 對數距離路徑損耗模型(Log-Distance Path Loss Model) 不論是經由理論推導或是實驗量測,我們都可以發現接收訊號的平均功率會隨著距離的增加而呈現指數的衰減,這種現象在室內或戶外皆通用,所以已經被文獻所廣泛使用。也由於接收訊號的平均功率是成指數衰減,在一般狀況下,路徑所造成接收功率的
平均損耗()dPL通常會和距離的n次方成正比,也就是說,對任意的傳收距離而言,接收功率的平均損耗可以表示成距離的函數:
()ndd
dPL⎟⎟⎠⎞⎜⎜
⎝
⎛∝
0 (6-4)
或是將(6-4)取dB值: ()()()dBlog10dB
00⎟⎟
⎠
⎞
⎜⎜
⎝
⎛×+=d
dndPLPL (6-5)
在(6-5)中n為路徑散逸指數,這指數代表路徑散逸的速率;0d為陷入距離
(Close-in
Distance),陷入距離通常為一非常接近傳送端的距離;d為傳送端和接收端的距離。n值
會隨著環境的不同而改變,表6.1列出在不同環境中,所使用不同的n值。
有一點值得注意的,基於表6.1,我們發現n值在大部分的環境中是大於或等於2,那麼有沒有可能n值小於2呢?答案是肯定的。考慮在一個走廊的環境中發射電磁波,此時走廊的環境就像一個導波管,訊號將會沿著特定的方向傳播,而非之前所提及的球狀散逸,因此在傳播的過程之中,訊號的能量會較為集中,此時的n值便有可能小於2。
最後要提醒讀者的是,在一固定的傳收距離下,傳播路徑所造成的功率損耗是一個隨機變數,主要的原因是在傳播通道之中,訊號所遭遇地形與地物的干擾是隨著環境而改變的,一般只能用統計的方法來描述這個現象。在上一小節及本小節中所討論的兩個傳播路徑損耗模型,主要是提供這個隨機變數的平均值。我們將在6.3節中看到,傳播路徑所造成的接收功率損耗(以dB為單位),一般是當成一個高斯分佈的隨機變數。