数学实验答案-1


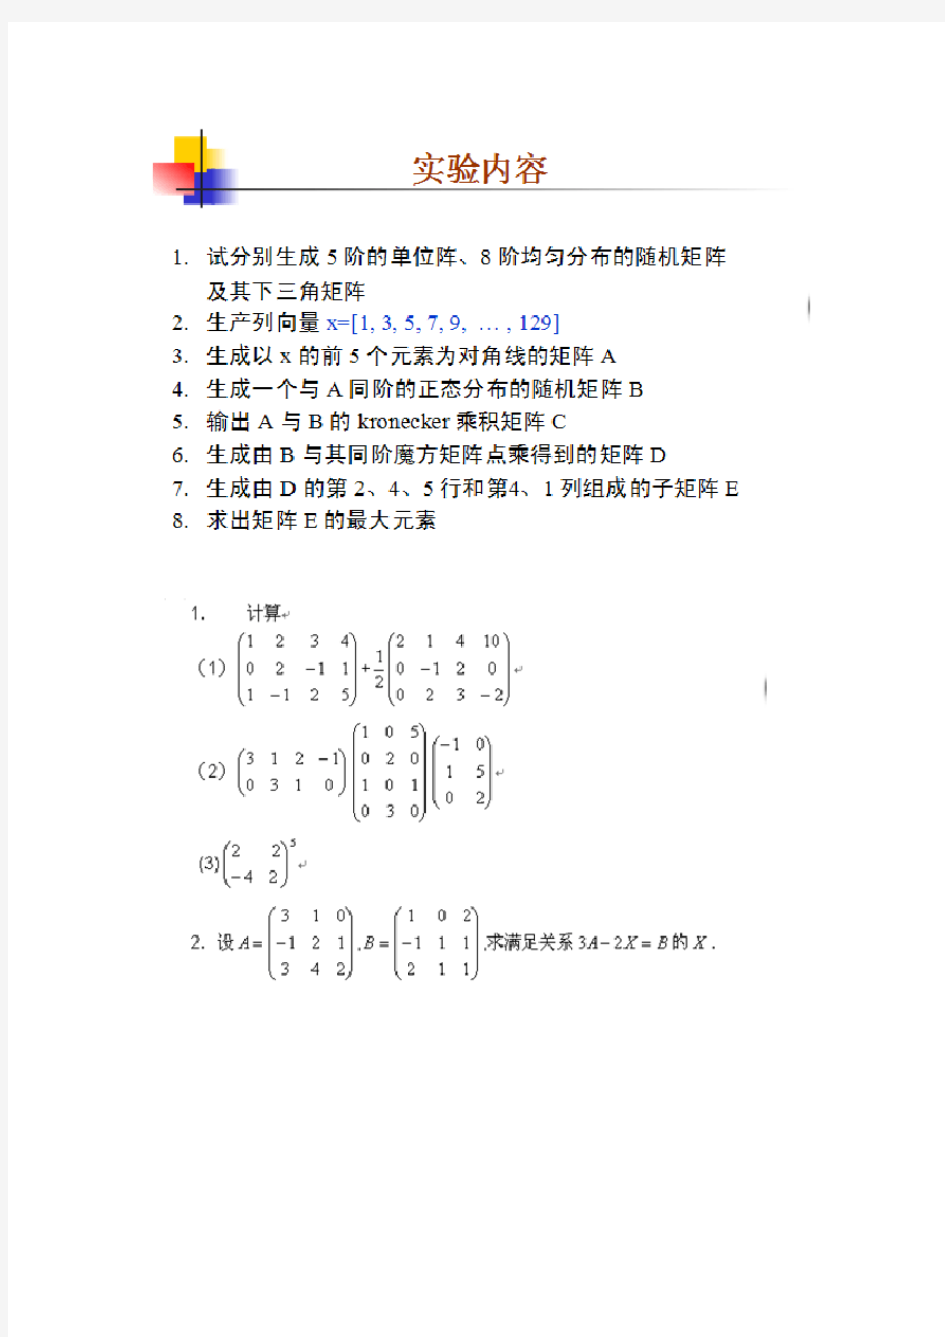
1.(1)
[1 2 3 4;0 2 -1 1;1 -1 2 5;]+(1/2).*([2 1 4 10;0 -1 2 0;0 2 3 -2]) 2.
A=[3 0 1;-1 2 1;3 4 2],B=[1 0 2;-1 1 1;2 1 1]
X=(B+2*A)/2
3.
A=[-4 -2 0 2 4;-3 -1 1 3 5]
abs(A)>3
%
4.
A=[-2 3 2 4;1 -2 3 2;3 2 3 4;0 4 -2 5]
det(A),eig(A),rank(A),inv(A)
求计算机高手用matlab解决。
>> A=[-2,3,2,4;1,-2,3,2;3,2,3,4;0,4,-2,5]
求|A|
>> abs(A)
ans =
(
2 3 2 4
1 2 3 2
3 2 3 4
0 4 2 5
求r(A)
>> rank(A)
ans =
4
求A-1
《
>> A-1
ans =
-3 2 1 3
0 -3 2 1
2 1 2 3
-1 3 -3 4
求特征值、特征向量
>> [V,D]=eig(A) %返回矩阵A的特征值矩阵D 与特征向量矩阵V
,
V =
- +
+ - - +
- +
- + - +
D =
{
+ 0 0 0
0 - 0 0
0 0 + 0
0 0 0 -
将A的第2行与第3列联成一行赋给b
>> b=[A(2,:),A(:,3)']
b =
《
1 -
2
3 2 2 3 3 -2
1.
a=round(unifrnd(1,100))
i=7;
while i>=0
i=i-1;
b=input('请输入一个介于0到100的数字:');
if b==a
¥
disp('You won!');
break;
else if b>a
disp('High');
else if b disp('Low'); end end end end 结果 a = 82 请输入一个介于0到100的数字:50 Low ; 请输入一个介于0到100的数字:75 Low 请输入一个介于0到100的数字:85 High 请输入一个介于0到100的数字:82 You won! 2. clear all;clc; n=input('请输入数字n='); · n1=floor(n/100); %取出百位数字n1 n2=mod(floor(n/10),10); %取出十位数字n2 n3=mod(n,10) ; %取出个位数字n3 if n1^3+n2^3+n3^3==n fprintf('%d是“水仙花数”', n) % 注意输出格式前须有%符号else fprintf('%d不是“水仙花”', n) % 注意输出格式前须有%符号end 结果 请输入数字n=234 ~ 234不是“水仙花数”>> 3. price=input('请输入商品价格'); switch fix(price/100) case {0,1} %价格小于200 rate=0; case {2,3,4} %价格大于等于200但小于500 rate=3/100; case num2cell(5:9) %价格大于等于500但小于1000 ] rate=5/100; case num2cell(10:24) %价格大于等于1000但小于2500 rate=8/100; case num2cell(25:49) %价格大于等于2500但小于5000 rate=10/100; otherwise %价格大于等于5000 rate=14/100; end price=price*(1-rate) %输出商品实际销售价格 结果 ! 请输入商品价格250 price = 4、 Function f=myfun(x) x=input; ) s=pi*x*x l=pi*x^2 4、 Function y=circle(r) s=pi*x*x l=pi*x^2 4. syms r s=pi*r*r > l=2*pi*r 5. function fibonacci(n,m) f(1)=1;f(2)=1; for i=3:max(n,m) f(i)=f(i-1)+f(i-2); end fprintf('第%d项',m) x=f(m) fprintf('前%d项',n) ~ s=f(1:n) COMMAND WINDOW输入:fibonacci(20,50) 1.绘制])4,0[)(3sin(3 π∈=x x e y x 的图像,要求用蓝色的星号画图;并且画出器官包络线3x e y ±=的图像,用红色的点划线画图。 2.用fplot 和ezplot 命令绘出函数)21sin(32t e y t +=-在区间]10,0[上的图像。 3.在同一图像窗口画三个子图要求使用指令gtext,axis,legend,title,xlabel,和ylabel : (3)' (4)]8,1[,sin 1∈=x x e y x 1. x=0:pi/25:4*pi; y1=exp(x/3).*sin(3*x);y2=exp(x/3);y3=-exp(x/3); plot(x,y1,'b*',x,y2,'r-.',x,y3,'r-.') 2. t=1::10 ; y=exp(-2*t/3).*sin(1+2*t); plot(t,y); figure fplot('exp(-2*t/3).*sin(1+2*t)',[1,10]) ezplot('exp(-2*t/3).*sin(1+2*t)',[1,10]) 3. x=1:1/50:8; y=exp(1./x).*sin(x); subplot(1,3,3),plot(x,y,'b-'); > legend('y=exp(1/x)sinx'),grid on, title('y=exp(1/x)sinx'), xlabel('x轴'),ylabel('y轴') gtext('真棒'),axis([x1 x8 y1 y10]) 4. x=0:pi/50:2*pi; y1=sin(x);y2=cos(x);y3=sin(2*x); plot(x,y1,'k*--',x,y2,'rs-',x,y3,'bo--'),grid on title('曲线y1=sin(x),y2=cos(x)与y3=sin(2*x)') ; xlabel('x轴'),ylabel('y轴') gtext('y1=sin(x)'),gtext('y2=cos(x)'),gtext('y3=sin(2*x)') legend('y1=sin(x)','y2=cos(x)','y3=sin(2*x)') 5.绘制圆锥螺线的图像并加各种标注,圆锥螺线的参数方程为: ???? ?????=≤≤==t z t t t t y t t t x 2)200(,6cos 6cos π 6.在同一图形窗口画半径为1的球面,柱面122=+y x 以及极坐标]2,0[,4sin 21πρ∈= t t 7.) 8.用mesh 与surf 命令绘制三维曲面2 23y x z +=的图像,并使用不同的着色效果及光照效果。 9.绘制由函数14 1692 22=++z y x 形成的立体图,并通过改变观测点获得该图形在各个坐标平面上的投影。 10.画三维曲面)2,2(522≤≤---=y x y x z 与平面3=z 的交线。 5. t=1:pi/50:20*pi; x=t.*cos(pi/6.*t); y=t.*sin(pi/6.*t); z=2*t; plot3(x,y,z); grid on ; > title('圆锥螺线') xlabel('x 轴');ylabel('y 轴');zlabel('z 轴'); axis square 6. v=[-2 2 -2 2 -2 2]; subplot(1,3,1),sphere title('以半径为1的球面'),xlabel('x 轴'),ylabel('y 轴'),zlabel('z 轴'),axis(v) subplot(1,3,2),cylinder title('柱面'),xlabel('x 轴'),ylabel('y 轴'),zlabel('z 轴') subplot(1,3,3),t=0:pi/100:2*pi; polar(t,(1/2)*sin(4*t)) title('p=(1/2)*sin(4t)') 7. [X,Y]=meshgrid(-8::8); Z=X.^2+3*Y.^2; subplot(1,2,1);mesh(X,Y,Z);shading interp subplot(1,2,2);surf(X,Y,Z);shading flat ? 8. [xx,yy,zz]=sphere(40); x=xx*3; y=yy*4; z=zz*2; surf(x,y,z) axis equal 9. [X,Y]=meshgrid(-2::2); Z1=5-X.^2+Y.^2; subplot(1,3,1),mesh(X,Y,Z1),title('曲面'); Z2=3*ones(size(X));% 创建一个和y矩阵相同大小的纯1矩阵subplot(1,3,2),mesh(X,Y,Z2),title('平面'); r0=abs(Z1-Z2)<=1; ZZ=r0.*Z2;YY=r0.*Y;XX=r0.*X; subplot(1,3,3) plot3(XX(r0~=0),YY(r0~=0),ZZ(r0~=0),'*') title('交线') 10. v=[-22 -22 -22]; [x,y,z]=sphere(30); surf(4*x,4*y,4*z) title('半径为4的球面'),axis(v)
