R语言房价分析
data=read.table("data.txt",header=T)
head(data)
case Taxes Beds Baths New Price Size
1 1 3104 4
2 0 279900 2048
2 2 117
3 2 1 0 146500 912
3 3 3076
4 2 0 237700 1654
4 4 1608 3 2 0 200000 2068
5 5 1454 3 3 0 159900 1477
6 6 299
7 3 2 1 499900 3153
A. Please open the dataset, omit any missing values, and name it mydat a.
mydata=na.omit(data)
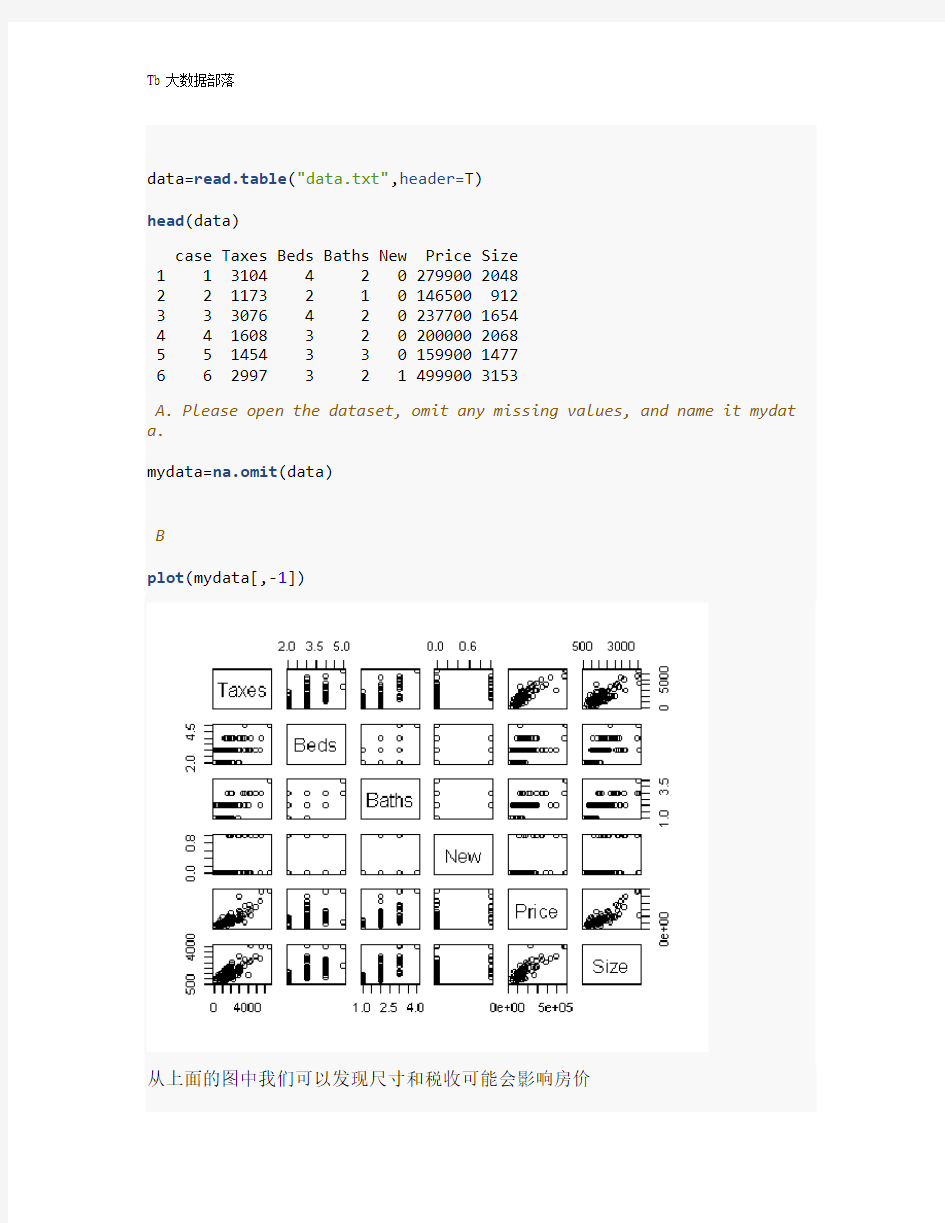
B
plot(mydata[,-1])
从上面的图中我们可以发现尺寸和税收可能会影响房价
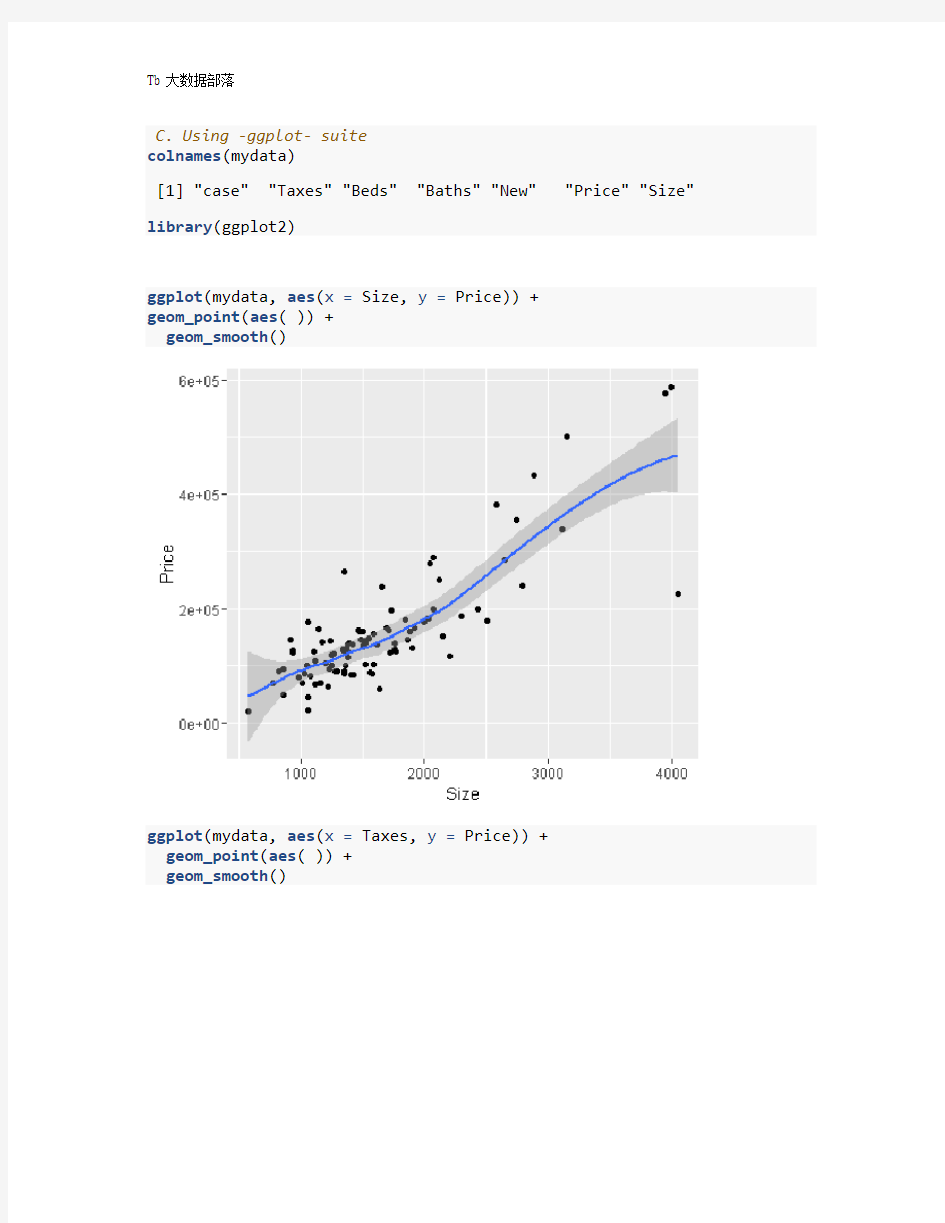
C. Using -ggplot- suite
colnames(mydata)
[1] "case""Taxes""Beds""Baths""New""Price""Size" library(ggplot2)
ggplot(mydata, aes(x = Size, y = Price)) +
geom_point(aes( )) +
geom_smooth()
ggplot(mydata, aes(x = Taxes, y = Price)) +
geom_point(aes( )) +
geom_smooth()
D. Do your visualizations show a positive, negative,
or no relationship?
从图形中我们可以发现税收和面积对房价有正向的关系
E. Is there evidence that you may need to transform any of your variab les? Why? Motivate
your answer by showing any relevant statistics or graphs
ggplot(mydata, aes(x =(Size) , y =log(Price))) +
geom_point(aes( )) +
geom_smooth()