(管理流程图)雅思A类图表作文各个击破(流程图、柱图、曲线、表格)免费

A类图表作文各个击破(流程图、柱图、曲线图、表格)
.5.2表格
4.5.2.1解题关键
F 1表格与饼图一样,都是静态图。切入点在描述分配;
F 2表格题考查列举数字的能力和方法。通过举一些有代表性的数据来说明问题;
F 3横向比较。介绍横向各个数据的区别、变化和趋势;
F 4纵向比较。介绍纵向各个数据的区别、变化和趋势;
F 5不需要将每一个数据分别说明,突出强调数据最大值和最小值;
F 6对比时要总结出数据对比最悬殊的和最小的。
4.5.2.2表格举例
Topic 4-4:The table below shows carbon dioxide emissions from transport in three European countries in 1994 and 2004.Summarise the information by selecting and reporting the main features and make comparisons where relevant.(表格贴不上,大家看附件吧~ ^_^)范文
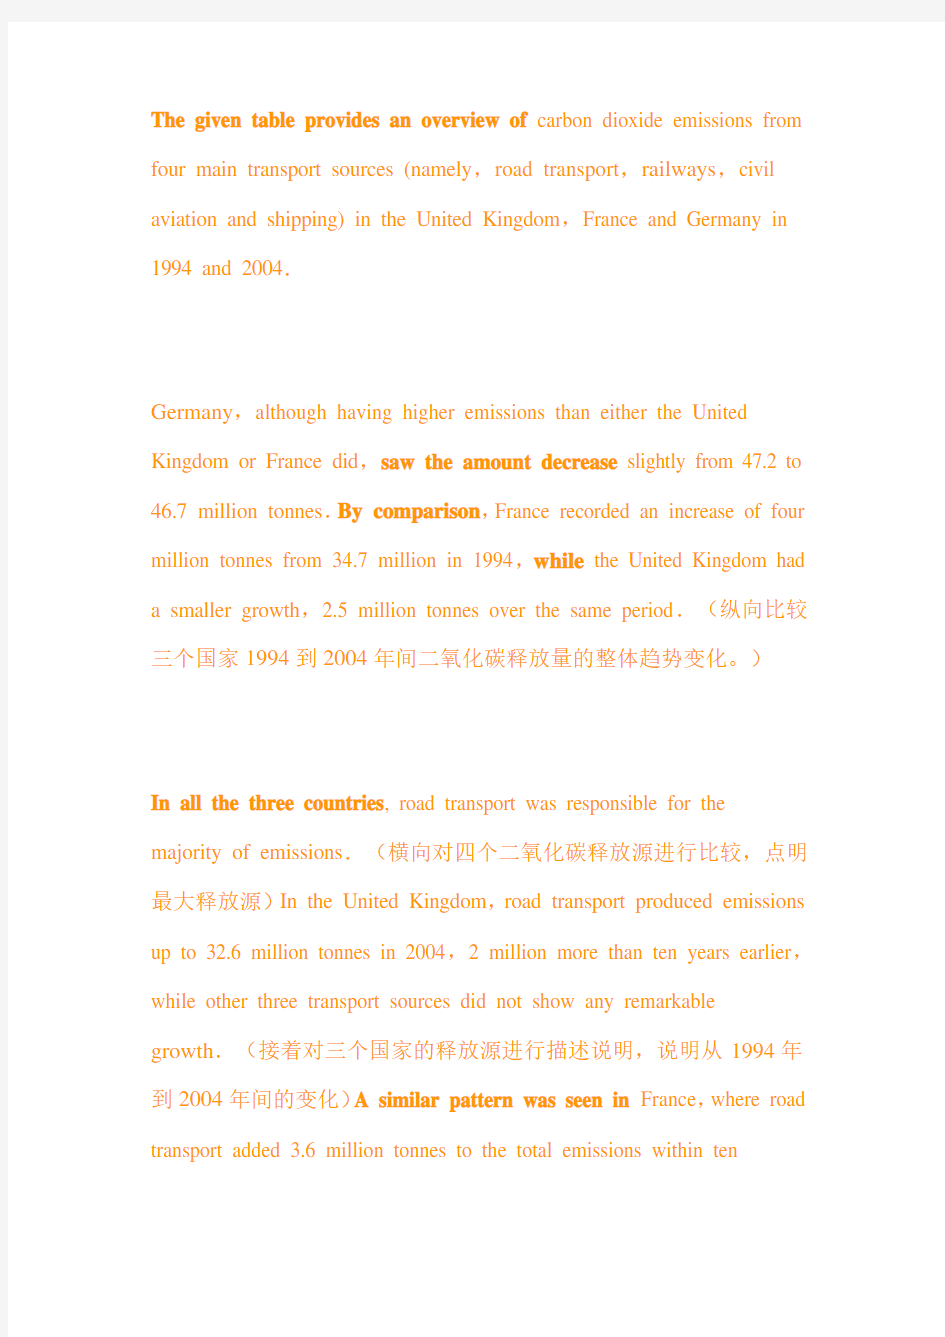
The given table provides an overview of carbon dioxide emissions from four main transport sources (namely,road transport,railways,civil aviation and shipping) in the United Kingdom,France and Germany in 1994 and 2004.
Germany,although having higher emissions than either the United Kingdom or France did,saw the amount decrease slightly from 47.2 to 46.7 million tonnes.By comparison,France recorded an increase of four million tonnes from 34.7 million in 1994,while the United Kingdom had a smaller growth,2.5 million tonnes over the same period.(纵向比较三个国家1994到2004年间二氧化碳释放量的整体趋势变化。)
In all the three countries, road transport was responsible for the majority of emissions.(横向对四个二氧化碳释放源进行比较,点明最大释放源)In the United Kingdom,road transport produced emissions up to 32.6 million tonnes in 2004,2 million more than ten years earlier,while other three transport sources did not show any remarkable growth.(接着对三个国家的释放源进行描述说明,说明从1994年到2004年间的变化)A similar pattern was seen in France,where road transport added 3.6 million tonnes to the total emissions within ten
years.Germany,by contrast,was the only country of the three to experience a drop in road transport emissions.(比较德国和英国法国的区别)Other three transport sources had a lower emission volume as well,except civil aviation,with the amount rising to 1.2 million.(对其它二氧化碳释放源进行描述,比较10年间的变化)
As shown in the table,both UK and France failed to reduce carbon dioxide emissions from transport sources during the period 1994 to 2004,in contrast to the decrease in Germany.Road transport continued to account for the biggest source of emissions.(237 words)
Topic 4-5:Write a report for a university lecturer,describing the information shown below.You should write at least 150 words.(表格贴不上,大家看附件吧~ ^_^)
范文:
The table provides information about the favored tourist destinations in the city of Llorente of different age groups.Each figure for destinations shows the percentage of tourists who visited the destinations on their last
holiday.There are four age groups—twenties,thirties,forties,and over 50-year-old group.
(点明表格提供不同年龄段所喜欢的旅游地点的信息。)
The most favored destination for all age groups was shopping centres.The percentage of tourists who visited there was more than 80%, and 95%of tourists of the forties group visited there. The percentages of tourists who vislted art galleries,zoos,and museums increased as the the age of tourists increased. For example,only 21%of people in the twenties visited art galleries,however,81%of the oldest age group visited there.On the other hand,the percentages of tourists who visited nightclubs,discotheques,and cinemas/theatres decreased as the age increased.For example,87%of tourists in twenties visited discotheques,however,only 5%of the oldest age group did so.
(按大家都喜欢的地点—老年人喜欢的地点—年轻人喜欢的地点这
个逻辑顺序进行描述;用on the other hand, for example 等连接词来串联句子。)
To sum up,favored destinations were different for each age group,however,almost all tourists visited shopping centers.(176 words) (总结得出结论。)
4.5.2.3表格常用词汇
noticeable trend 明显趋势
pronounced adj. 明显的
significant changes一些较大变化
rank n. vt. vi. 列为,排列,等级
distribute vt. 分布,区别
unequally adv. 不相等地
average n. vt. vi. adj. 平均
corresponding adj. 相应的,通讯的
represent vt. 阐述,表现
overall adj. 总体上讲
in the case of adv. 在...的情况下
in terms of / in respect of / regarding 在...方面
4.5.2.4表格常用表达
开头概述
1) The table shows (reveals,illustrates,demonstrates,depicts,describes,indicates) _____.
2) According to the table, _____.
3) As (is) shown in the table, _____.
4) As can be seen from the table, _____.
5) Figures/statistics show (that) _____.
6) It can be seen from the figures/statistics that _____.
7) It is clear from the figures/statistics that _____.
8) It is apparent from the figures/statistics that _____.
描述比例
1) _____ accounts for (takes up) 20%of all.
_____占总数的20%。
2) On the top of the list is _____, which accounts for 70%.
比例最高的是_____,占70%。
3) At the bottom of the list is _____,which takes up 20%only.
比例最低的是_____,仅占20%。
4) A ranks first,followed by B at 20%and C at 15%.
A占比例最大,其次是B占20%及C占15%。
5) The figure reached the highest/lowest point in _____.
数据在_____时候达到最高点(最低点)。
描述对比
1) A has almost (nearly/about) over a quarter (half/twice/one third) as many students as (as much money as) B.
A的学生数/钱(差不多)是B的四分之一/一半/两倍/三分之一/一样。
2) A has about (approximately/exactly/precisely) the same number (proportion/amount) of students (money) as B.
A和B的学生/钱/数量/比例差不多/正好一样。
3) A has something in common with B.
A与B有一些共同点。
4) The difference between A and B lies in _____.
A与B的不同之处在于_____。
描述趋势
1) The number increased(/rose)suddenly(dramatically/rapidly /substantially/considerably/sharply)from _____ to _____.
数量从_____激增到_____。
2) During 1990 to 2000,there was a sudden(rapid/dramatic/substantial/sharp/considerable)rise(boom)in the number of private cars from _____ to _____.
1990年到2000年间,私人汽车的数量从_____急剧增长到_____。
3) The ten years from 1990 to 2000 witnessed(/saw)a steady growth of private cars from _____ to _____.
1990年到2000年10年间,私人汽车的数量从_____稳步增长到
_____。
4) The number of private cars increased (rose / fell/dropped/declined /decreased) by 20%.
私人汽车数量增长了(或:降低了)20%。
5) The number of private cars in 2000 was 5 times more than that in 1990.
2000年私人汽车数量是1990年的5倍。
6) The number of private cars roughly (/approximately) doubled (tripled) between 1990 and 2000.
1990年到2000年间,私人汽车数量大约是原来的2倍(3倍)。
结尾
1) We can conclude from the table that _____.
2) In short (In brief), _____.
3) In conclusion, _____.
4) To conclude, it seems clear that _____.
5) From the table/diagram, we can see _____.
6) As can be seen from the chart/table/diagram, _____.
7) It is clear (/apparent) from the chart (/graph/table) that _____.
4.5.2.5表格模板
The table shows _____.
(简要介绍表中呈现的信息。)
According to the figures,as people age in Someland, their social lives reduce.Teenagers and people in their twenties _____. People in their
30s,40s,50s and 60s _____.
(general statement,点明从数据中概括得出的一种趋势。)
Group and individual exercise follow a similar pattern.People of all ages spend a good part of their leisure time on entertainment. Teenagers and retired people _____. For everybody else, _____.
(general statement,点明从数据中概括得出的另一种趋势。)
Consequently,it can be concluded that there is a significant trend towards _____.
4.5.3曲线图
4.5.3.1解题关键
F 1曲线图和柱状图都是动态图,解题的切入点在于描述趋势。
F 2在第二段的开头部分对整个曲线进行一个阶段式的总分类,使写作层次清晰,同时也方便考官阅卷。接下来再分类描述每个阶段的specific trend,同时导入数据作为分类的依据。
F 3趋势说明。即,对曲线的连续变化进行说明,如上升、下降、波动、持平。以时间为比较基础的应抓住“变化”:上升、下降、或是波动。题中对两个或两个以上的变量进行描述时应在此基础上进行比较,如变量多于两个应进行分类或有侧重的比较。
F 4极点说明。即对图表中最高的、最低的点单独进行说明。不以时间为比较基础的应注意对极点的描述。
F 5交点说明。即对图表当中多根曲线的交点进行对比说明。
F 6不要不做任何说明就机械地导入数据,这不符合雅思的考试目的。
4.5.3.2曲线图举例
Topic 4-6:The graph shows the rate of smoking of man and women in Scotland from 1960 to 2000.Summarise the information by selecting and reporting the main features and make comparisons where relevant. You should write at least 150 words.(图贴不上,大家下载附件吧~ )
范文
The line chart compares the rate of smoking of men and women in Scotland from 1960 to 2000. It can be clearly seen that the rate of smoking for both men and women was declining and that fewer women smoked during the period.
(点明图表主要趋势,用compare这个词揭示下面的文章结构。)
In 1960, 600 men in every l,000 smoked. This number decreased gradually to 500 by 1974 and continued to decrease steeply to 250 by 2000.In contrast, the smoking rate for women was very low, only 80 in every 1,000 in 1960.By 1968 this increased to 170 and rose again more steeply to 320 in 1977.The rate of female smokers then remained stable at 320 until in 1984,at which point the figures began to decline and dropped to 200 by 2000.
(按时间先后顺序描述男性吸烟者的发展趋势,用in contrast连接女性吸烟者,承上启下,并形成对比。)
In conclusion,we can see that the rate of smoking of men dropped throughout the whole period but was always higher than that of women.The rate of female smokers increased until 1977,but then decreased for the rest of the period. (176 words)
(结尾段中换一种方式描述结论,与开头段相互呼应。)
Topic 4-7:The line chart bellow shows serious violent crime levels from 1978 to 2000 in the US.Serious violent crimes include rape,robbery,aggravated assault and homicide. Summarise the information by selecting and reporting the main features and make comparisons where relevant..(图贴不上,大家下载附件吧~ )
范文
The multiple-line graph demonstrates trends in violent crime levels in the US during the period 1978 to 2000.
In the first ten years,there were fluctuations in the total crime level,but the overall trend was upbeat.By about 1989,it rose to a record high,around 4.5 offences per thousand Americans,half the figure in 1980 (slightly over 3 offences),the lowest ever recorded during the given period.Victimisations rose and fell at a lower level between 2 and 2.5 offences over the same period,while crimes recorded by police showed a steady increase,reaching its highest in the year 1994,over 1.5 offences in a thousand.The arrest rate was the lowest,levelling off below 0.5 offences per 1,000.
From 1988 onwards,the total violent crime level declined gradually,so did victimisations reported to police.In 2000,3 out of a thousand Americans committed violent crime,while half as many victims were reported to the police.As to crimes recorded by police and arrests for violent crime,both dropped slightly in the last five years and the figures were 1.5 and 0.5 offences respectively in 2000.
Overal l,the violent crime rate,as well as victimisations reported to police,crimes recorded and arrests for violent crime,was not subject to strong fluctuations in the final two decades of the last century,although
by the end of the century,there was a trend toward lower violent crime levels. (240 words)
4.5.3.3曲线图常用词汇
动词—九大运动趋势
一:表示向上:increase,rise,improve,grow,ascend,mount,aggrandize,go up,climb,take off,jump,shoot up暴涨,soar,rocket,skyrocket 举例:人口上升:the number of population increased/ascended/mounted 等等。
二:表示上升后保持平稳:flatten out(下降或升高后变平),level off 举例:人口上升后保持平稳:the number of population mounted and leveled off.
三:表示复苏(下降后再上升):recover,bounce back
举例:人口下降后复苏:the number of population decreased and recovered.
四:表示下降:decrease,decline,descend,drop,fall,go down,come down,collapse,crash,fall off,slump,plummet,plunge,slide,shrink, dwindle, diminish
举例:人口减少:the number of population decreased/ declined.
五:表示下降后保持平稳:bottom out,flatten out(下降或升高后变平) 举例:人口下降后保持平稳:the number of population decreased and bottomed out.
六:表示稳定或水平:remain steady/constant,stay stable, stabilize,stagnate,flatten out(下降或升高后变平),level off,stay at the same level,be similar to,there is little/hardly any/no change
举例:表示人口数量保持平稳的时候可以写: the number of population stayed stable. /the number of population remained steady.
七:表示波动:fluctuate
举例:人口波动:the number of population fluctuated.
八:表示在底部:reach a low point,bottom out,reach the bottom,reach the rock,hit a trough
九:表示在顶部:reach a peak,peak,top out,reach the highest point/ the top/ the summit/ the most,peak in/at,reach the zenith
举例:人口到达了顶峰:the number of population peaked/ reached its summit/ reached its zenith.
形容词和副词—变化程度
abrupt(ly)(突然),sudden(ly)(突然),dramatic(ally)(急剧),drastic(ally)(急剧),sharp(ly)(急剧),quick(ly)(迅速),rapid(ly)(迅速),marked(ly)(显著),significant(ly)(显著),considerable(considerably)(相当),substantial(ly)(相当) moderate(ly)(适当),gradual(ly)(逐渐),slight(ly)(轻微),slow(ly)(缓慢),steady(steadily)(平缓)
名词
line chart线图,curve diagram曲线图,horizontal axis横轴,vertical axis 纵轴,plateau(上升后的稳定期),record high历史高度,record low历史低点,trough (曲线上的)最小值,zenith(最高值), general trend,upward/downward tend
增加:an increase,a rise,a growth,an improvement,an upturn,a surge,an upsurge,an upward trend
下降:a fall,a decrease,a decline,a drop,a downturn,a downturn trend,low point,reduction
波动:fluctuation
介词
一. remain steady/ stay stable/ level off/ bottom out/ peak/reach its peak/ reach its zenith后面需要使用的是at.
举例: 1.人口在500万上保持平稳: The number of population remained steady at 5 million.
2. 人口在800万时到达了顶峰: The number of population peaked at 8 million.
3. 下降后,人口在400万保持平稳:After decreasing, the number of population bottomed out at 4 million.
4. 上升后,人口在700万保持平稳: After mounting, the number of population leveled off at 7 million.
二. 上升/下降后面使用to(到)和by(了)
举例:
1. 人口下降到200万: number of population decreased to 2 million.
2. 人口下降了200万: number of population decreased by 2 million.
3. 人口上升到1000万: number of population increased to 10 million.
4. 人口上升了500万: number of population increased by 5 million.
三. recover的后面大家需要使用的是from
举例: 人口在200万时开始复苏: The number of population recovered from 2 million.
四. fluctuate的后面大家需要连接between …and…
举例: 人口在20和100亿之间波动: The number of population fluctuated between 2 and 10 billion.
4.5.3.4曲线图常用表达
开头概述常用表达
1) The line chart depicts the changes in the number of _____ over the period from 2000 to 2004.
该曲线图描述了从2000年到2004年_____数量的变化。
2)The chart provides some data regarding the fluctuations of _____ from 2000 to 2004.
该曲线图描述了从2000年到2004年_____的变动。
3) The graph,presented in the curve diagram,shows the general trend in _____.
该图以曲线图的形式描述了_____总的趋势。
4) This is a line chart showing _____.
这是一个曲线图,描述了_____。
5) As can be seen from the graph,the two curves show the fluctuations of _____.
如图所示,两条曲线描述了_____波动的情况。
描述曲线常用表达
1)The _____ in the graph is measured in units,each of which is equivalent to _____.
图表中的_____以_____为单位,每单位等于_____。
2) The horizontal axis stands for _____.
横轴代表了_____。
3) The vertical axis stands for _____.
2019年雅思写作小作文流程图解析及范文:废纸回收
2019年雅思写作小作文流程图解析及范文:废纸回收 The chart below shows the process of waste paper recycling. 范文: The flow chart shows how waste paper is recycled. It is clear that there are six distinct stages in this process, from the initial collection of waste paper to the eventual production of usable paper. At the first stage in the paper recycling process, waste paper is collected either from paper banks, where members of the public leave their used paper, or directly from businesses. This paper is then sorted by hand and separated according to its grade, with any paper that is not suitable for recycling being removed. Next, the graded paper is transported to a paper mill. Stages four and five of the process both involve cleaning. The paper is cleaned and pulped, and foreign objects such as staples are taken out. Following this, all remnants of ink and glue are removed from the paper at the de-inking stage. Finally, the pulp can be processed in a paper making machine, which makes the end product: usable paper. (160 words, band 9)
雅思小作文地图题
雅思小作文题型多样,其中就包括地图题,本文将详细讲解雅思小作文地图题写作技巧。评分标准 ?TA – Task Achievement 任务完成情况 ?CC – Coherence and Cohesion 意合与形合 ?LR – Lexical Resource 词汇资源 ?GRA – Grammatical Range and Accuracy 语法广度与精确度 审题 The map below shows the development of the village of Ryemouth between 1995 and present. 文章结构 第一段 交待写作目的 第二段 描述1995年的地图 第三段
拿现在的地图和95年的做对比 第四段 总结全文 第一段 This report compares how the village of Ryemouth has developed and changed since the year of 1995. 题目:The map below shows the development of the village of Ryemouth between 1995 and present. 第二段 As is clearly described in the first picture, Ryemouth was a coastal city which was divided into three parts by two roads. In the southern part, there was a fishing port on the sea, with a fish market located in the north and a coffee shop in the north-east. A block of shops was situated on the opposite side of the market… 第三段 In the second picture, the village changed a lot. The fishing port has been removed and the fish market is replaced by apartments. Several restaurants also occupy the place of the shops on the roadside. Moreover, a parking lot is newly built on the east of the hotel. In addition, … 第四段 Overall, based on the brief description above, it is clear that the general layout of the village does not change a lot, while some newly-built facilities and housing has ornamented the small village.
雅思写作流程图
流程图1.首段常用句子 The following diagram shows the structure of……The picture illustrates…… The whole procedure can be divided into…stages. It mainly consists of…… It works as follows. It always involves following steps. 2.描述流程/过程的常用过渡性词语 最后再总结一下流程图的特点: 特点一:现在时 特点二:定语从句 特点三:被动语态 特点四:顺序词 特点五:适当添加 特点六:无总结
题目1:玻璃的回收流程【单图】
范文1: This diagram illustrates the recycling process of glass bottles. The whole process is a cycle which can be divided into three main stages. In the first stage, used bottles are collected at a recycling point ready to be transported by a truck. The second stage starts in a cleaning plant, where these recycled bottles are sorted by color into green, brown and clear ones and washed by high-pressurized water. When the cleaning is done, the bottles are conveyed to a glass factory where they are cut into glass pieces which are then poured into a furnace. After being heated in the furnace, the broken glasses are melted into liquid, which flows into a glass mold. Here glass liquid from other sources is added and the molding process takes place. In the final stage, new, empty bottles are filled with liquid, then packed and dispatched to the supermarket ready to be picked by consumers. At this point, a cycle has been completed and a new cycle will begin.
雅思流程图写作指引
流程图 流程图6点参考要领: 1. 找到流程图的过程,起点,终点。 2. 找到图上标出的已知动作,如果出现生词,尽量猜测。无词,用自己的语言。 3. 按照步骤,分段描述,千万不能省略任何一步。 4. 切记!加入流畅合理的表示顺序的关联词。 5. 句型以主动为主,搭配被动,以及主语从句(例如:It can be seen from the graph that…)。 6. 时态要使用一般现在时。 例文分析1: The diagram shows the stages in the process of making chocolate.(所有的小作文第一句话都要用一般现在时。流程图必备三个词:process整个过程;stage阶段;step步骤)
Chocolate comes from the cacao tree, which is grown in parts of South America, Africa and Indonesia.(开头不能一上来就直接介绍cacao tree,而是通过主题词chocolate 引出,否则显得太唐突)【流程图特点之一:介绍过程要使用一般现在时】【流程图特点之二:大量使用定语从句,将有关联的两句话连接。】【流程图特点之三:大量使用被动语态】The tree produces large red pods which contain white cocoa beans.【流程图特点之四:使用一些表示顺序的连接词】when the pods are ripe, they are harvested, the beans are removed and they are fermented for several days in large wooden boxes.(三个句子的并列:“句子A,句子B and 句子C”。)During the fermenting process, the beans turn brown.【流程图特点之五:要适当地添加个别图中没有交代但能从图片中直接读出来的一些内容,否则可能达不到字数要求。但是一定要把握尺度,千万不要加上自己的主观观点,否则会扣分】 Next, the brown beans are spread in the sun to dry. They are then put in large sacks and transported by train or lorry. After this, the beans are taken to a chocolate factory where they are roasted in an oven at temperatures of between 250 and 350 degree Celsius. After being roasted, the beans are crushed and the outer shell is removed. This part is not needed for making chocolate. Finally, the inner part of the bean is pressed and liquid chocolate is produced.【流程图特点之六:一般不需要写总结】 例文分析2:
2020雅思小作文流程图的写作方法
2020雅思小作文流程图的写作方法 雅思写作考试中的Task1小有三种题型:图表,流程图和地图。考生们备考时多把注意力放在图表题,对后两类题目准备不足甚至无准备,一旦真遇到了流程图和地图,往往束手无策,凭自己的直觉应付写一下,凑够字数交差。流程图和地图题的写作是有一定的方法的,按照方法来写,其实并不难,在本文中,先来探讨流程图作文的写作。 题目给出的是流程图,就是以图示的方法把一个过程或流程清楚地显示了出来,现在要求考生做的是把该流程图还原成说明文。由此可见,我们实际上要做的就是看图作文。而大家都知道,看图作文是我们在小学最初学写作文时的入门做法。照着图来写,省却了要自己想象和构思的过程,这自然比起写议论文的挑战度要低一些。所以,大家应该更有信心去对付流程图作文,毕竟实际上所做的是“看图作文”。 流程图作文是以对流程的描述为主的。全文的安排通常分为两个主要部分:引言段和主体部分。引言段是用来作简介的,介绍该流程图表示了一个什么什么的过程,常用的句型为主语+谓语+宾语模式。然后视情况可以多加一句说整个过程可以分为若干个阶段。引言段只需一段,通常就是这么一二句话。
主体部分是文章的核心部分,主要是说明该流程,所以是说明文式的行文。主体部分可依照整个流程分成几个阶段而大体相应地分为几个自然段。主体部分的写作原则如下: 这是首要前提,理解了流程图表示的是什么以及是怎样的一个过程,才谈得上用文字表达出来。能否看得懂图取决于几方面的因素:词汇量,知识面,生活经验和常识等。考生平时要有心地做一下这些方面的积累和准备。一般来说,流程图是不难看懂的。万一有些什么地方卡住了,也要大胆地合乎逻辑地去猜测,推想,判断,要灵活机敏。 流程图会表示一个过程的流向顺序。因此,不难按照图示的顺序来写。若是分成几个阶段的,就按顺序逐个阶段来描述,通常就相应地分成几个自然段落。 流程图中会提供一些关键的说明性的词,比如步骤或环节的名称,怎样做,添加什么原料,去掉什么,输送到哪儿等等。我们就可以直接利用这些关键词写成句子,方法有两类,依照图的情况而分别采用之。如果流程图比较简短,用扩展的办法,就是以一个关键词为核心词,扩展成一个甚至两个句子,以达到字数的要求。反之,若图比较长而复杂,就采用串的办法,一句话把两个甚至三个步骤串起来,这样可以把较长的过程压缩得短一些来描述。无论用
雅思小作文之流程图范文
You should spend about 20 minutes on this task. The diagram below shows the method of obtaining water outdoors. You should write at least 150 words. 1. The chart describes how water is obtained outdoors. 2. According to the figure, the first step of obtaining water outdoors is to find a hole with green plants on its bottom. Next, remove the green plants in the middle and put a container there. Then, cover the hole with a plastic sheet and place two stones on
both ends of it to secure its position. A third stone is laid on the middle of the plastic sheet so that the middle part is also the lowest part. 3. When the sun shines on the green plants in the hole, water evaporates from these plants. The vapor rises up and then cools down to form water drops on the plastic sheet. When there is more and more water, it flows along the sheet to accumulate on the lowest part. Finally, water falls down into the container directly under the middle stone. Thus, water is collected successfully through evaporation from green plants. 流程图的重点: 1.平时的格式 As is displayed in the flow chart, the process/principle, etc of _____ can be explained/ analyzed/ specified as follows. There are ____stages in ______. First, Second, Next Last/Finally/In the end (Thus, the new circle begins.) As to/for, As far as …is concerned In respect/aspect of, in approach to, in regard to
雅思小作文范文--流程图写作详解!
流程图写作雅思小作文范文 今天我们就利用一篇经典的考官的雅思小作文范文,来向同学们展示一下关于令大家非常头疼的流程图的写作带给我们的启示:流程图其实一点都不难,掌握好了其中的语法知识点,我们甚至可以拿高分。 雅思写作中,和它联系最为紧密的就是语法。雅思写作四项评分中,语法作为重中之重被提及。语法基础不好,难有好作文的形成。如果一篇英语作文中反复出现低级的语法错误,那么无论你的观点多么吸引人,原本的写作立意多么新颖精彩,生产的都只是一篇有缺陷的英语作文,多会让阅读者对你文章的整体印象打折扣:-一个连基础语法都错误连连的作者,会有能力写出一篇思维严谨的作文吗? 读题分析:由于蚕的生命旅程并不是哪一个特定时刻发生的事情,而是一个公认的自然常识。它是作为一个流程而时时刻刻都在发生的事情,因此采用时态中的一般现在时来表达整篇文字就是最适合不过了 考官范文: The first diagram shows that there are four main stages in the life of the silkworm. First of all, eggs are produced by the moth and it takes ten days for each egg to become a silkworm larva that feeds on mulberry leaves. This stage lasts for
up to 6 weeks until the larva produces a cocoon of silk thread around itself. After a period of about 3 weeks, the adult moths eventually emerge from these cocoons and the life cycle begins again. 详细分析: 一、首先准备流程图的写作时,先考虑一下文章结构的完整。好的文章一般都是“总-分-总”结构,所以看看此文章的开头:The first diagram shows that there are four main stages in the life of the silkworm。这样的开头很符合文章“总起”的结构,所以宾语从句在小作文的开头一般不可少,the first diagram是主语,shows是谓语,that是连接词,而后面的内容都是shows的宾语,因此宾语从句是大家可以利用的开头句型,既简洁又有力。 另外,一定要尽量使用到三大从句来给你的作文增添光彩,刚刚已经讲完宾语从句,另二种复杂句则分别出现在:”…a silkworm larva that feeds on mulberry leaves”句子由that引导的定语从句和由until引导的”This stage lasts for up to 6 weeks until the larva produces a cocoon of silk thread around itself”时间状语从句这两个部分。定语从句能够使得你想表述的对象“silkworm larva”更加具体形象,而状语从句则是可以展现出流程图中时间结构的法宝。 二、There are four main stages…典型的there be 结构,可以说是雅思小作文写作中的一个法宝。只要带有了there be句型,文章就显得非常客观。比如下面这个句型就是
雅思小作文流程图的写作方法
雅思小作文流程图的写作方法 导读:题目给出的是流程图,就是以图示的方法把一个过程或流程清楚地显示了出来,现在要求考生做的是把该流程图还原成说明文。由此可见,我们实际上要做的就是看图作文。而大家都知道,看图作文是我们在小学最初学写作文时的入门做法。照着图来写,省却了要自己想象和构思的过程,这自然比起写议论文的挑战度要低一些。所以,大家应该更有信心去对付流程图作文,毕竟实际上所做的是“看图作文”。 流程图写作基本原则 流程图作文是以对流程的描述为主的。全文的安排通常分为两个主要部分:引言段和主体部分。引言段是用来作简介的,介绍该流程图表示了一个什么什么的过程,常用的句型为主语+谓语+宾语模式。然后视情况可以多加一句说整个过程可以分为若干个阶段。引言段只需一段,通常就是这么一二句话。 主体部分是文章的核心部分,主要是说明该流程,所以是说明文式的行文。主体部分可依照整个流程分成几个阶段而大体相应地分为几个自然段。主体部分的写作原则如下: 1. 把图看懂 这是首要前提,理解了流程图表示的是什么以及是怎样的一个过程,才谈得上用文字表达出来。能否看得懂图取决于几方面的因素:词汇量,知识面,生活经验和常识等。考生平时要有心地做一下这些
方面的积累和准备。一般来说,流程图是不难看懂的。万一有些什么地方卡住了,也要大胆地合乎逻辑地去猜测,推想,判断,要灵活机敏。 2. 按图示的顺序写 流程图会表示一个过程的流向顺序。因此,不难按照图示的顺序来写。若是分成几个阶段的,就按顺序逐个阶段来描述,通常就相应地分成几个自然段落。 3. 将图所提供的词扩展(或串)成句子 流程图中会提供一些关键的说明性的词,比如步骤或环节的名称,怎样做,添加什么原料,去掉什么,输送到哪儿等等。我们就可以直接利用这些关键词写成句子,方法有两类,依照图的情况而分别采用之。如果流程图比较简短,用扩展的办法,就是以一个关键词为核心词,扩展成一个甚至两个句子,以达到字数的要求。反之,若图比较长而复杂,就采用串的办法,一句话把两个甚至三个步骤串起来,这样可以把较长的过程压缩得短一些来描述。无论用哪一种方法,都要利用流程图上所给出的'词,这是图提供给我们的方便,要充分利用。在读懂图的基础上,再有这些关键词的帮助,这篇作文就不难写出来了。整篇文章字数要求是150字,图中给出的词往往就占了将近三分之一,考生要写的就只是余下的三分之二左右了。 4. 主体部分的句子多用被动语态 流程图说明文的特点是多用被动语态,主要是指主体部分对过程
雅思流程图写作技巧心得
The illustrations below show how chocolate is produced. Summarise the informaiton by selecting and reporting the main features. 【高分范文点评】 The diagram shows the stages in the process of making chocolate.【所有的小作文第一句话都要用一般现在时。流程图必备三个词:process:整个过程, stage:阶段,step:步骤】 Chocolate comes from the cacao tree, which is grown in parts of South America, Africa and Indonesia.【开头不能冲上来就直接介绍cacao tree,而是通过主题词chocolate引出,否则显得太唐突】【流程图特点之一:介绍过程要使用一般现在时】【流程图特点之二:大量使用定语从句,将有关联的两句话连接。】【流程图特点之三:大量使用被动语态】The tree produces large red pods which contain white cocoa beans. Firstly,【流程图特点之四:使用一些表示顺序的连接词】when the pods are ripe, they are harvested, the beans are removed and they are fermented for several days in large wooden boxes.【三个句子的并列:“句子A,句子B and句子C”。】During the fermenting process, the beans turn brown.【流程图特点之五:要适当地添加个别图中没有交代但能从图片中直接读出来的的
雅思小作文详解6:地图题
【9分作文盛宴】考官华丽雅思小作文详解6:地图题 Simon是英国曼彻斯特的前雅思考官,由于创办雅思考试学习网站而在全世界的考生中越来越有名气。其网站上提供大量关于复习雅思的技巧以及颠覆性的建议,甚至还有不少Simon本人亲笔写的满分作文。这些满分作文由于出自英国考官之手,非常地道,言简意赅,和中国考生惯用的千篇一律的模板作文相比,着实让人眼前一亮。点课台的Phoebe老师深感有义务要让孩子们接触到真正可以提分的好作文,所以以后会频繁地帮大家整理并总结这些满分作文的精华,相信大家都可以扔掉模板,写出高分作文! 今天要分析的题目是地图——Maps。 有的学生说,地图题型相对不常见,所以备考可以忽略。针对这种想法,Simon是这样说的:While it’s true that graphs and charts are the most common types of question, I think it would be very unwise not to prepare for diagrams and maps too. What happens if you get one of these questions in your test and you haven’t prepared for it? 虽然不常见,但是如果平时不做任何准备,万一考到后果不堪设想。其实地图题并没有大家想象地那么难,只要花时间仔细研究一下Simon的范文,大家都能写出一篇好作文。 请看今天的题目,就是下面这个地图: 写作文之前,要先Plan your structure,Simon建议地图题依然沿用4段式: 1. Introduction: what does the chart show? 2. Overview / summary: what are the most noticeable features? 3. Specific details: try to write 2 paragraphs. 接下来说地图题最难的地方——如何准确读出图中所给信息,我们就先来分析一下,从这个地图上我们可写的信息有哪些,首先地图上为数不多的单词或数字不可遗漏,上方那句是说这张图展现了一个叫做Chorleywood的村庄在1868年到1994年之间的发展情况。然后很清楚地能看出,在四个不同的时期,它的交通设施有明显的改善。居民都住在各种路的旁边。这些只是大概的Overview,足够写出前两段了,那还有哪些具体的细节,能够写进第三、四段中呢?大家自己再仔细看地图,从中找中可写的Details。 接下来贴出完整满分范文,大家读的时候看一下Simon按照什么order、挑出哪些细节来描述的:
雅思小作文流程图 水循环
Task1: The diagram below shows the water cycle, which is the continuous movement of water on, above and below the surface of the Earth. The flow chart illustrates how water cycle works. The flow chart illustrates the continuous movement of water on, above and below the surface of the Earth. The source of energy for evaporation is primarily solar radiation The flow chart illustrates the natural process known as water cycle. In general, there are three stages of the process, beginning with the evaporation of water. The water then falls as rain and eventually flows/runs back into oceans again. Looking at the first stage of the process, it happens in the ocean where water evaporates because of heat from the sun. It is noteworthy that 80% of water vapor in the air comes from the oceans. At the following stage labeled ‘precipitation, condensing water vapor forms cloud, after which water falls as rain or snow. At the final stage, rainwater may take various paths. Some of it may fall into lakes or return to the oceans via ‘surface runoff’. Otherwise, rainwater may filter through the ground,
(完整版)常用的雅思小作文流程图和地图题词汇
雅思小作文流程图和地图题词汇 在雅思写作部分,A类小作文的流程图和地图题一直是雅思烤鸭们比较头痛的部分。此部分题型在构文方式并没有特别的技巧和特殊性。事实上,除了把握图形的分析方法和每种图形不同的解题方式外,考生最关注的应该是补充什么类的词汇做备考准备了。 大部分考生在市面上找不到专门的流程和地图备考书籍,而词汇书上也并不把流程地图的词汇专门划分复习,网络信息则把流程图和地图题的材料区分明确,使得考生找不到一个综合备考办法。 在本文中,成都/朗阁/培训中心的雅思专家们总结了综合完整的流程地图题词汇,提供给雅思烤鸭们完善的备考指引。以下的词条按照不同表达方式进行分类。 Part 1:表时间 流程图和地图题中都可能涉及时间表达。流程题中,使用较多的是过程时长的表述,而地图题的时间使用则体现为地理变迁的时间变化。一般在方位选址图题中较少出现。确切的时间指引,既增加文章的自然和连贯度,也能体现行文的精确性。 常见表示时间的词: in few hours几小时 during the period of …在…期间after 10 days 10天后 from…to 从…到… between …and 在…之间 over the…year period在一个…年期间5 years before 5年前a decade earlier几十年前from that moment on从那时起after a while一会 since自从 since then自从 finally最后 over the subsequent …years近连续几年 例句:The process lasts for up to 7 day s and the products are finally distributed to customers. Part 2:表空间
最新雅思写作流程图Flow-chart讲义
Flow chart = process diagram 一、流程图的特点 1. 描绘某一事物的发展或运作过程 2. 遵循某种顺序 3. 图中会标出原材料的名称和步骤的细节 4. 一般会出现一些专业生词 5. 流程最终要达成某种目的或结果 二、流程图的写作步骤 1. 读题目,确定描述什么?目的或结果? 2. 找信息,定步骤 所有的信息点,包括图中所有有文字的地方,或所有表示动作或变化的图示(所有的时间、大小、距离等
数字信息) 1.定框架,写文章 第一段:介绍流程图是做什么的。第二段:详细介绍原料与准备、每一步的变化、过程及结果。 第三段:简单总结 2.读文章,做检查 单词拼写、语法、替换重复的词汇等。三.流程图常用的表达 1. The flow chart illustrates the recycling process of _____. 2. The process of ____ involves the following steps. 3. The whole procedure of ___ can be categorised into ____ stages. 4. The row materials for ____ include ___, ___ and ____.
5. The first step is to ______. 6. ____ with ____ is prepared to _____. 7. ____ is used as ____ of ____. 8. _____ is mixed with ____ to produce _____. 9. _____ can change into ____, when ____. 10. The process of ____ is really a simple(complicated) process. The pictures below show the recycling process of wasted glass bottles.
易考雅思小作文流程图.doc
易考雅思小作文流程图/解释说明性图(1)
(2) You should spend about 20 minutes on this task. The diagram below shows the method of obtaining water outdoors. You should write at least 150 words.
(3) You should spend about 20 minutes on this task. The flow chart is about the National Yellow Stone Park in use after the fire disaster. You should write at least 150 words.
(4) You should spend about 20 minutes on this task. The diagrams below show some principles of house design for cool and for warm climates. You should write at least 150 words.
(5) You should spend about 20 minutes on this task. The government planned to build a supermarket in G Town. In the following map there are two alternative places for you to choose: place S1 and place S2. According to the information shown in the diagram, describe the benefits and drawbacks of the two locations. You should write at least 150 words.
雅思小作文地图题讲解
一个地图题的开头:The map about the development of the village sufficiently illustrates the way of progress of this area. In this map, we can find four main sectors and two main roads intersected with one railway and one motor way. It seems the overall development of this village has strong connection with t h e c o n s t r u c t i o n o f r o a d s. 雅思小作文地图题词汇 Part 1:表时间 流程图和地图题中都可能涉及时间表达。流程题中,使用较多的是过程时长的表述,而地图题的时间使用则体现为地理变迁的时间变化。一般在方位选址图题中较少出现。确切的时间指引,既增加文章的自然和连贯度,也能体现行文的精确性。 常见表示时间的词: in few hours几小时 during the period of …在…期间after 10 days 10天后 from…to从…到… between …and在…之间 over the…year period在一个…年期间5 years before 5年前a decade earlier几十年前from that moment on从那时起after a while一会 since自从 since then自从 finally最后 over the subsequent …years近连续几年 例句:The process lasts for up to 7 day s and the products are finally distributed to customers. Part 2:表空间 空间表达地图题出现概率较高,但流程图也偶尔出现。空间应该是地图题解题关键和主要特点。许多考生容易误把地图题的空间位置写成上下左右位置,这是失分点非常大的地方。朗
雅思写作小作文范文 雅思写作流程图flow chart 咖啡制作过程.doc
雅思写作小作文范文雅思写作流程图flow chart 咖啡制作过程 今天我们雅思写作小作文范文的文章来研究下流程图flow chart。该图表展示了从咖啡豆到罐装咖啡的制作过程,共分为11个阶段,包括咖啡豆的收获,晒干,烘烤,冷却,碾磨,加水,过滤,冷冻,再次碾磨,烘干,以及装罐等。小编搜集了一篇相应的考官范文,以供大家参考。 雅思写作小作文题目 The diagram below shows how coffee is produced and prepared for sale in supermarkets and shops. Summarise the information by selecting and reporting the main features, and make comparisons where relevant. 雅思写作小作文范文 The picture illustrates the process of coffee manufacture and preparation for sale on the market. 图片说明了咖啡制作以及为在市场上销售做准备的过程。 It is clear that there are 11 stages in the production of coffee. The process begins with the picking of coffee beans and ends at the packing stage. 显然,咖啡的生产过程一共有11个阶段。它们以采集咖啡豆为起点,以包装为终点。 Looking at the coffee production process in detail, coffee beans must first be picked in the fields. These beans are then dried, roasted, and cooled before being put in a grinding machine, which turns the beans into coffee granules. 详细看一下咖啡的生产过程。首先,咖啡豆必须在田野中采集。然后,它们必须经过干燥,烘烤以及冷却才能放入粉碎机。粉碎机将咖啡豆变为咖啡颗粒。 At the sixth stage in the process, the ground coffee is mixed with hot water, and the resulting mixture is strained. Next, the mixture is frozen and then passed once again through the grinder. After that, the ground frozen liquid is dried in a vacuum so that the water evaporates, leaving the coffee granules. Finally, these granules are packed into coffee jars for delivery to shops. 在整个过程的第六阶段,碾磨过的咖啡与热水混合,然后再经过过滤。随后,这一混合物被冷冻起来,再次经过粉碎机的处理。在这之后,粉碎过的冷冻液体在真空容器中干燥,从而使水分得以蒸发,只留下咖啡颗粒。最后,这些颗粒被装入咖啡罐中,运送到各个商店。