75634d1339239606-mimo-antenna
Abstract—A printed two-MIMO-antenna system incorporating a neutralization line for antenna port decoupling for wireless USB-dongle applications is proposed. The two monopoles are located on the two opposite corners of the system PCB and spaced apart by a small ground portion, which serves as a layout area for antenna feeding network and connectors for the use of standalone antennas as an optional scheme. It was found that by removing only 1.5 mm long inwards from the top edge in the small ground portion and connecting the two antennas therein with a thin printed line, the antenna port isolation can be effectively improved. The neutralization line in this study occupies very little board space, and the design requires no conventional modification to the ground plane for mitigating mutual coupling. The behavior of the neutralization line was rigorously analyzed, and the MIMO characteristics of the proposed antennas was also studied and tested in the reverberation chamber. Details of the constructed prototype are described and discussed in the paper.
Index Terms—printed monopole antennas, MIMO antennas, 2.4 GHz WLAN antennas, wireless USB-dongle antennas, neutralization line
I.I NTRODUCTION
IMO technology using multiple transmit/receive antennas
is considered one of the most promising approaches to achieve higher data rate with no additional spectrum required and at the same time, to make use of the indoor multi-path propagation for improving signal quality and reliability. Until quite recently, the IEEE Standard Association has ratified the IEEE 802.11n standard in September 2009 [1]. It can be expected that multiple antennas are demanded accordingly and may be closely packed inside the devices due to limited space left for antennas. Multi-antenna designs that require high decoupling between the antenna ports are essential for the multi-radio, antenna system development. Several methods for improving antenna port isolation have been reported, including incorporating a protruded ground plane between the antennas [2], inserting slits into the ground [3-5], arranging antenna
Manuscript received December 23, 2010; revised on Jun. 15, 2011.
S.-W. Su and C.-T. Lee are with the Network Access Strategic Business Unit, Lite-On Technology Corp., Taipei County 23585, Taiwan (e-mail: stephen.su@liteon. com).
F.-S. Chang is with the Department of Electronics, Cheng Shiu University, Kaohsiung County 83347, Taiwan shorting portions facing each other [6, 7], manipulating radiation polarization of the antennas [8-10] and so on. For the cost- effective concern for USB-dongle applications that the printed antennas are the most favorable designs, none of the above- mentioned techniques for decoupling antenna ports are suited to the requirements of printed antennas and little board space for accommodating decoupling-structure layout. This motivates us to implement another promising technique by incorporating a neutralization line [11, 12] into the printed two-antenna system for USB-dongle applications. A neutralization-line technique allows the signals picked up from one antenna to the other and produces an opposite coupling to the existing one without the presence of neutralization line such that low mutual coupling at certain frequencies is achieved [11].
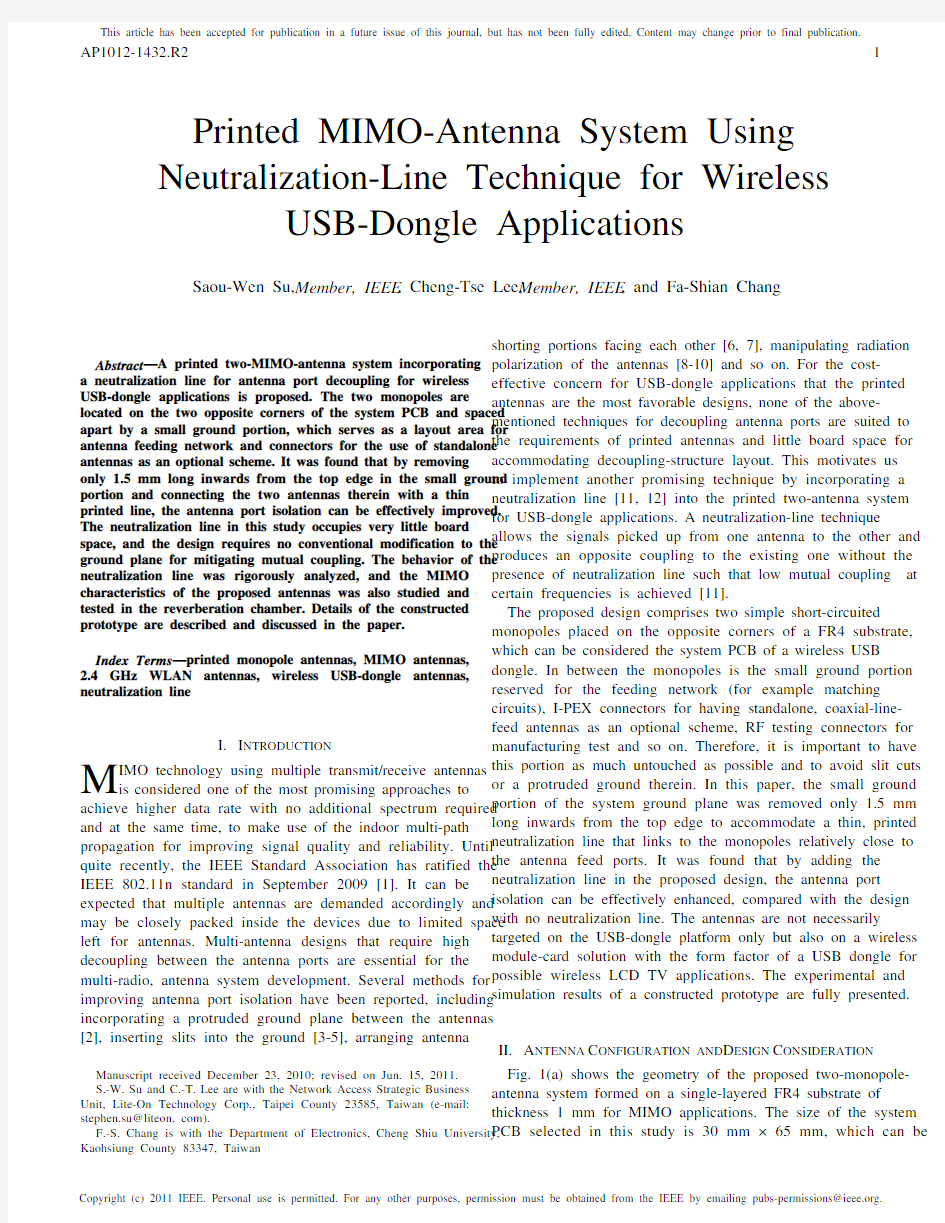
The proposed design comprises two simple short-circuited monopoles placed on the opposite corners of a FR4 substrate, which can be considered the system PCB of a wireless USB dongle. In between the monopoles is the small ground portion reserved for the feeding network (for example matching circuits), I-PEX connectors for having standalone, coaxial-line- feed antennas as an optional scheme, RF testing connectors for manufacturing test and so on. Therefore, it is important to have this portion as much untouched as possible and to avoid slit cuts or a protruded ground therein. In this paper, the small ground portion of the system ground plane was removed only 1.5 mm long inwards from the top edge to accommodate a thin, printed neutralization line that links to the monopoles relatively close to the antenna feed ports. It was found that by adding the neutralization line in the proposed design, the antenna port isolation can be effectively enhanced, compared with the design with no neutralization line. The antennas are not necessarily targeted on the USB-dongle platform only but also on a wireless module-card solution with the form factor of a USB dongle for possible wireless LCD TV applications. The experimental and simulation results of a constructed prototype are fully presented. II.A NTENNA C ONFIGURATION AND D ESIGN C ONSIDERATION Fig. 1(a) shows the geometry of the proposed two-monopole- antenna system formed on a single-layered FR4 substrate of thickness 1 mm for MIMO applications. The size of the system PCB selected in this study is 30 mm × 65 mm, which can be
Printed MIMO-Antenna System Using
Neutralization-Line Technique for Wireless
USB-Dongle Applications
Saou-Wen Su, Member, IEEE, Cheng-Tse Lee, Member, IEEE, and Fa-Shian Chang M
considered the form factor of the PCB for a wireless USB dongle. The two monopoles are printed on the two opposite corners of the PCB [shown on the top portion in Fig. 1(a)] and spaced 14 mm apart with a small ground portion (13 mm × 14 mm) therein between. Each monopole is designed in a clearance area (no grounding layout and electric components therein) of size 8 mm × 14.5 mm. The two monopoles are also identical in size and symmetrically placed with respect to the PCB center line [see symmetrical line in Fig. 1(a)]. Accordingly, it is expected that the performance of each monopole should be the same. Notice that the small ground portion is reserved for the antenna feeding network and the I-PEX connectors for the use of the standalone, coaxial-line-feed antennas as an optional scheme. Therefore, it is important to keep this area as much untouched as possible (no slit cut or protruded ground).
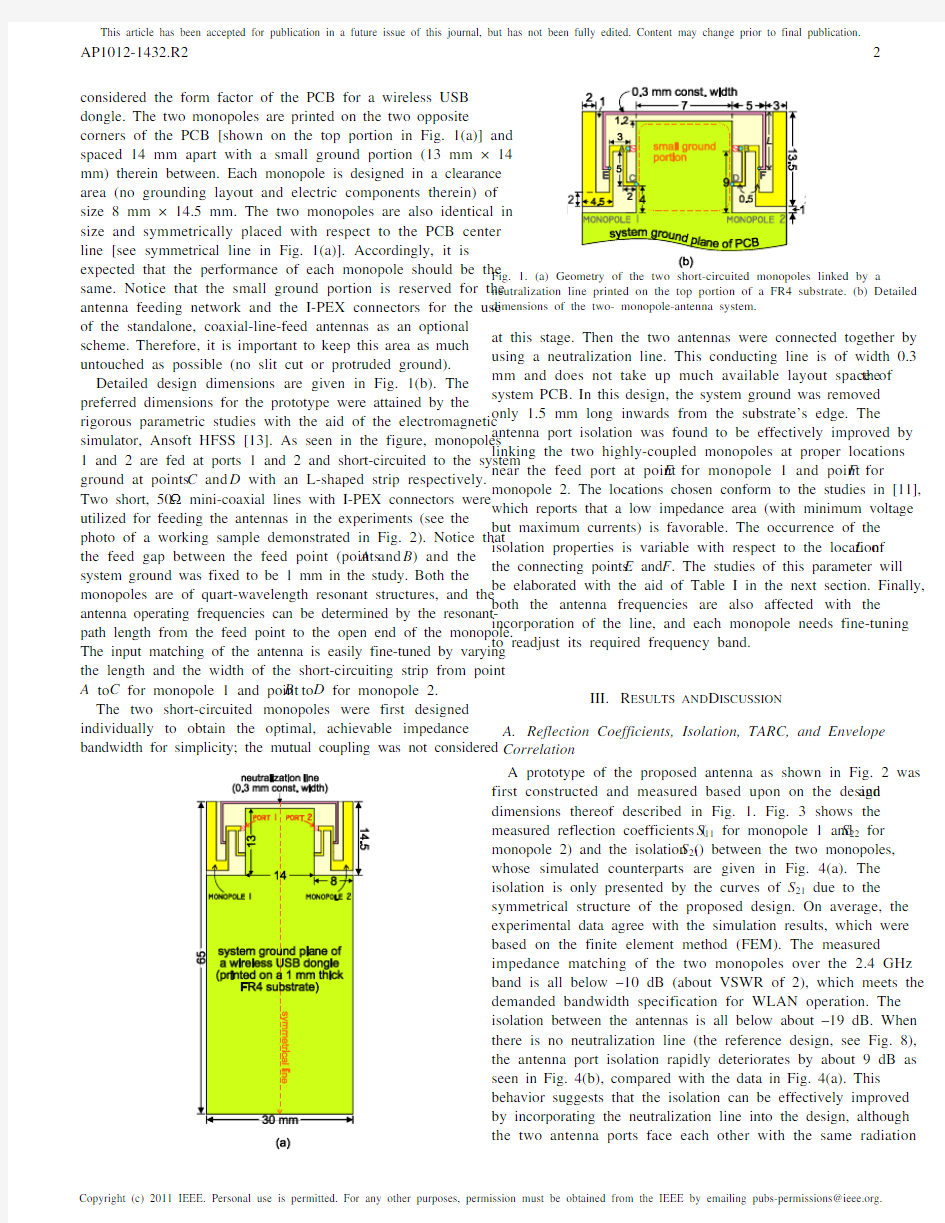
Detailed design dimensions are given in Fig. 1(b). The preferred dimensions for the prototype were attained by the rigorous parametric studies with the aid of the electromagnetic simulator, Ansoft HFSS [13]. As seen in the figure, monopoles 1 and 2 are fed at ports 1 and 2 and short-circuited to the system ground at points C and D with an L-shaped strip respectively. Two short, 50-? mini-coaxial lines with I-PEX connectors were utilized for feeding the antennas in the experiments (see the photo of a working sample demonstrated in Fig. 2). Notice that the feed gap between the feed point (points A and B ) and the system ground was fixed to be 1 mm in the study. Both the monopoles are of quart-wavelength resonant structures, and the antenna operating frequencies can be determined by the resonant- path length from the feed point to the open end of the monopole. The input matching of the antenna is easily fine-tuned by varying the length and the width of the short-circuiting strip from point A to C for monopole 1 and point B to D for monopole 2.
The two short-circuited monopoles were first designed individually to obtain the optimal, achievable impedance bandwidth for simplicity; the mutual coupling was not considered
Fig. 1. (a) Geometry of the two monopoles linked by a neutralization line printed on the top portion of a FR4 substrate. (b) Detailed dimensions of the two- monopole-antenna system.
at this stage. Then the two antennas were connected together by using a neutralization line. This conducting line is of width 0.3 mm and does not take up much available layout space of the system PCB. In this design, the system ground was removed only 1.5 mm long inwards from the substrate’s edge. The antenna port isolation was found to be effectively improved by linking the two highly-coupled monopoles at proper locations near the feed port at point E for monopole 1 and point F for monopole 2. The locations chosen conform to the studies in [11], which reports that a low impedance area (with minimum voltage but maximum currents) is favorable. The occurrence of the isolation properties is variable with respect to the location L of the connecting points E and F . The studies of this parameter will be elaborated with the aid of Table I in the next section. Finally, both the antenna frequencies are also affected with the incorporation of the line, and each monopole needs fine-tuning to readjust its required frequency band.
III. R ESULTS AND D ISCUSSION
A. Reflection Coefficients, Isolation, TARC, and Envelope Correlation
A prototype of the proposed antenna as shown in Fig. 2 was first constructed and measured based upon on the design and dimensions thereof described in Fig. 1. Fig. 3 shows the measured reflection coefficients (S 11 for monopole 1 and S 22 for monopole 2) and the isolation (S 21) between the two monopoles, whose simulated counterparts are given in Fig. 4(a). The isolation is only presented by the curves of S 21 due to the symmetrical structure of the proposed design. On average, the experimental data agree with the simulation results, which were based on the finite element method (FEM). The measured impedance matching of the two monopoles over the 2.4 GHz band is all below –10 d
B (about VSWR of 2), which meets the demanded bandwidth specification for WLAN operation. The isolation between the antennas is all below about –19 dB. When there is no neutralization line (the reference design, see Fig. 8), the antenna port isolation rapidly deteriorates by about 9 dB as seen in Fig. 4(b), compared with the data in Fig. 4(a). This behavior suggests that the isolation can be effectively improved by incorporating the neutralization line into the design, although the two antenna ports face each other with the same radiation
polarization (see Fig. 10). It is noticed that the antenna
operating frequencies and the impedance bandwidth thereof are also affected by the use of the neutralization-line technique. Furthermore, various locations L of the connecting points E and F were also analyzed on the monopole frequencies (S11) and the in-band isolation (S21); the results are tabulated in Table I. The antenna frequencies are seen to be less affected compared with the port isolation and can still be within the 2.4 GHz frequency range. However, the dip of the S21 curve shifts from the lower to higher frequencies with an increase in the length L. In this case, there exists an optimal location for connecting both the monopoles. Fig. 5 presents the impedance of the isolation studied in Fig. 4. For the reference, the resistance impedance is stable and close to 50 ohms with inductive reactance over the band. This behavior resembles an inductor put in between and well matched to the two ports (that’s ports 1 and 2 here) and transfers the signals from port 1 to port 2, resulting poor antenna port isolation. For the proposed design, it is interesting to observe that part of the resistance values is negative [14], which indicates an opposed direction for the current flow in a virtual capacitor (because of negative imaginary part) placed between the ports to replace the two monopoles and the radiation air path. The increase in the currents entering port 1 to the loading between the two ports also results in decreased voltage over the
Fig. 2. Photo of a constructed prototype fed by 50-? mini-coaxial cables.
Fig. 3. Measured reflection 11monopole 1 and S22 for monopole 2) and isolation (S21) between the two monopoles of the proposed design; L = 8 mm.
Fig. 4. Simulated reflection (S11for monopole 1 and S22 for monopole 2) and isolation (S21) between the two monopoles for (a) the proposed design and (b) the reference case (with no neutralization line).
Fig. 5. Impedance of 21two monopoles for the proposed and the reference designs studied in Fig. 4.
TABLE I
S IMULATED RESULTS OF THE MONOPOLES AS A FUNCTION OF L STUDIED IN F IG.
3. F L AND F U ARE, RESPECTIVELY, THE LOWER AND UPPER EDGE FREQUENCIES OF THE –10 D B IMPEDANCE AND THE SAME FOR BOTH MONOPOLES 1 AND 2;S21 IS OF THE MAXIMUM VALUE WITHIN THE BAND OF INTEREST. loading. In this case, the coupling field between the antenna ports is weak, leading to good antenna port isolation.
To consider the constructive and destructive coupled signals on the combination of each antenna port’s reflected signals, the total active reflection coefficient (TARC) [15-17] is also L (mm) Achievable Bandwidth, f L ~ f U (MHz)
Max. S21 (dB) in the
2.4 GHz band
6 125, 2360 ~ 2485 –8.0
7 130, 2370 ~ 2500 –9.7
8 120, 2370 ~ 2490 –14.6
9 135, 2350 ~ 2485 –9.5
10 110, 2380 ~ 2490 –7.0
investigated. TARC is defined as the ratio of the square root of total reflected power divided by the square root of total incident
(1)
power and can be considered the MIMO array radiation efficiency for a multi-port antenna [16]. The calculations can be done by using Equation (1) described in [17], where θ is the phase angle of port 2 excitation, from which it is straightforward to see that TARC accounts for both coupling and random signals combining. Fig. 6 presents the calculated TARC from the scattering-matrix elements of S 11, S 12, S 21, S 22 obtained in Fig. 4(a) for monopole 1 with randomly phased excitation of monopole 2 with a set of seven excitation vectors. The curves retain the original characteristics of the reflection coefficient of a single antenna, but the impedance bandwidth is changed due to the effects of the mutual coupling and the incident waves with random phases. Interesting to notice that TARC becomes worst when the phase is equal to 180° (out- of-phase incident signals upon monopole 2 with respect to monopole 1). The average TARC in Fig. 6 shows that the in-band impedance is all below –10 dB and the worst case calculated TARC is smaller than –7.3 dB over the band.
Fig. 6. Calculated TARC for antenna system; each curve shows a reflection coefficient for an excitation with constant amplitude but different phase angle of port 2 excitation in steps of 30 degrees for 180 degrees.
Fig. 7 plots the calculated envelope correlation ρe between the two monopoles. The correlation was determined by the S parameters in the equation (11) reported in [18] for sufficiently accurate results in many practical cases [19]. However, it should be noticed that the equation is unsuitable for the case of zero mutual coupling (S 21 = 0). The magnitude and phase of the S parameters were collected from the simulation data in Fig. 4(a). A brief description of the calculation was discussed in [20]. From the results, the values remain under 0.006 in the 2.4 GHz band and are much smaller than 0.5 at the mobile station (the user end) [21]. In addition to the said method, the evaluation of the envelope correlation can be measured in a reverberation chamber [22]. The correlation coefficient ρ is measured, and the envelope correlation is then obtained by Equation (2).
(2)
B. Current Distribution, Near-Field, and Far-Field Radiation Characteristics
The excited surface-current distributions of the design with (the proposed) and without (the reference) the neutralization line are studied in Fig. 8 to understand the behavior of the neutralization line in relation to the two monopoles. The current-magnitude scale is kept the same among all the cases. First, the current distributions on the system ground plane and the strength thereof are similar between the proposed and the reference. This behavior is different from the finding in [23], which indicates the isolation between the antennas is related to the surface currents on the ground. Instead, the mutual coupling in this study is mitigated by introducing the counter-phased currents against the excited antenna [11]. For example, when monopole 1 is excited (port 1 excitation) with the currents entering the antenna, the current vector on the two-third of the neutralization line closer to monopole 2 is in the direction toward monopole 1. In this case, the surface currents are out of phase with a null located closer to monopole 1 on the line, such that the conductive currents are opposed to the excited antenna. In addition, it can be seen that the currents enter the two monopoles in the proposed (see currents from points A to E or B to F ) but in opposite directions in the reference (currents entering port 2 from monopole 2). It means that there exists an close path, including monopoles 1, 2, and the air between the open ends of the two monopoles, from port 1 to port 2, and the signal currents entering port 2 are against those entering port 1 and out of phase between the two ports for the proposed. Quite the contrary, for the reference, the signals currents enter port 1 but leave port 2 from monopole 2, and the currents even enter the system ground through the shorting strip. These can explain poor isolation for the reference and better antenna port isolation for the proposed. Second, for the reference, although the current-distributions compared with the proposed are not much different on the system ground and identical on the monopole from point E and F to the open end, the antenna isolation is poor because without any means of coupling cancellation. Also, the currents leave monopole 1 and enter monopole 2 respectively at each open end of the monopole. This suggests that the corresponding antenna could receive the radiating signals of the excited antenna through the near-field radiation in this design. Therefore, to redirect the maximum near-field strength of the
Γa t j j s s e s s e =+++F H I K
1112221222
2
θθ
c
h c
h ρρ2
≈e
excited antenna away from the port of the corresponding antenna should facilitate port-to-port decoupling in a two-antenna system.
proposed reference
port 1 excitation
port 2 excitation
Fig. 8. Simulated surface-current distributions at 2442 MHz for the proposed and the reference designs with port 1 and port 2 excitation respectively.
Fig. 9 presents the simulated reactive near-field radiation patterns for monopole 1 excited at 2442 MHz for the proposed and the reference designs. The radius with port 1 or the gap source in the simulation as the center was set 14 and 22 mm, which are the effective range that the near field of the excited antenna (monopole 1) affects the corresponding one (monopole 2). The radius, 14 mm, is the same length as that of the small ground portion between the monopoles; in this case, the range is of the port-to-port distance. Therefore, the radiation in Fig. 9(a) represents that when monopole 1 is operating, the coverage reaches only to port 2 but not monopole 2 included. For the radius of 22 mm in Fig. 9(b), the range counts from port 1 to the right edge of monopole 2. Compared with the reference, which shows the large field strength aiming at port 2, the maximum strength of the reactive near field in Fig. 9(a) is not in the direction of port 2 but pointing to the portion of the neutralization line with the maximum currents seen in Fig. 8. This characteristic indicates that the large currents on the neutralization line can draw the near field in the case of the port-to-port radius and redirect the field away from the receiving antenna port, which in turn results in better port isolation. However, if the range of the reactive near field exceeds the port-to-port distance, the near-field radiation behaves similarly between the proposed and the reference as can be seen in Fig. 9(b). This phenomenon is expected because the current distributions on monopoles 1 and 2 from point E and F to the open end are identical, the reactive near field excited by monopole 1 can reach the open end of monopole 2 over the air, such that the currents leave the open end of monopole 1 and enter the open end of monopole 2. The reactive near fields with other radius values larger than port-to-port range of 14 mm but smaller than one wavelength (range criterion for reactive near field) at 2442 MHz were also examined. The results showed similar patterns for both the proposed and the reference designs. The over-the-air (OTA) performance of the antenna in free space was studied. Fig. 10 shows the far-field, 2-D radiation
patterns at 2442 MHz, the center frequency of the 2.4 GHz band
E E
proposed
max = 88.3 dB E min
= 39.3 dB reference
max
= 74.7 dB
E
min
= 41.5 dB
E
E
proposed
max = 83.4 dB E min
= 34.4 dB reference
max = 81.9 dB E min = 41.2 dB
2442 MHz for the proposed and the reference designs with the radius of (a) 14 mm and (b) 22 mm with respect to port 1 (monopole 1) excitation.
, in E θ and E ? fields for monopoles 1 and 2. The patterns were normalized with respect to the maximum field strength among three major planes: the x -z , y -z , and x -y cuts. The omnidirectional radiation patterns in this design lie in the x -y and x -z planes, and the radiation for ports 1 and 2 tends to cover the complementary space region (see y -z cuts). The polarization for the two monopoles was observed the same. Fig. 11 presents the simulated, far-field 3-D radiation patterns of the antennas studied in Fig. 10; the measured counterparts are given in Fig. 12. The measurement was made by the ETS-Lindgren OTA test system using the great-circle method in a CTIA authorized test laboratory [24]. Overall, the measured results are similar to the simulation. It can be seen that the null radiation is located in the opposite half-spaces in the y -z planes. Other in-band frequencies were also measured, and no inconsistency on the patterns was noticed. Fig. 13 shows the peak antenna gain and the radiation efficiency against frequency for the two monopoles. Again, because the two antennas are identical and symmetrically placed with respect to the PCB center, the gain and the radiation efficiency are about the same. The peak gain in the 2.4 GHz band for the two antennas is at a constant level of about 2.1 dBi, and the radiation efficiency is larger than about 70%. The gain measurement here takes account of the antenna mismatching and is the “realized gain” [25]. The radiation efficiency was obtained by calculating the total radiated power of the antenna under test (AUT) over the 3-D spherical radiation first and then dividing that total amount by the input power of 0
(b) monopole 2 studied in Fig. 3.
port 1 excitation
gain: 2.1 dBi
port 2
excitation
efficiency: 81%
Fig. 11. Simulated 3-D radiation patterns at 2442 MHz for monopole 1 (port 1 excitation) and monopole 2 (port 2 excitation) studied in Fig. 3.
dBm (default value) given to the AUT in the test laboratory.
Finally, to find out the antenna diversity gain, the proposed design was tested in the Bluetest reverberation chamber [22], which emulates a rich scattering and fading environment following a Rayleigh distribution to represent a real MIMO environment. The S 1j of the two monopoles were measured simultaneously by connecting each antenna (denoted as one branch) to a four-port vector network analyzer. The subscript “1” and “j” of S 1j means port 1 connecting to the three transmitting monopoles placed perpendicular to each other for three polarization and port j connecting to each corresponding antenna in the test (see Fig. 12.10, in [26]). The center
frequency was set at 2442 MHz with used, measured frequencies ranging from 2440 to 2444 MHz for sampling. Fig. 14 plots the cumulative distribution function (CDF) of the measured power-transmission samples for the two branches (monopoles 1 and 2) against the relative received power recorded. At a cumulative probability level of 1% (that’s, the sufficient quality 99% of the time), the difference between the
-15
-12-9
-6-3
03
-18
unit: dBi
unit: dBi
Fig. 12. Measured 3-D radiation (including the x -z and y -z cuts) at 2442 MHz for (a) monopole 1 and (b) monopole 2 studied in Fig 3.
studied in Fig. 12.
the reverberation chamber based on 3016 measured power samples for each monopole (branch).
CDF of selection combining and the best CDF between the two monopoles represents the apparent diversity gain [26]. The apparent diversity gain was observed about 9.8 dB in the test.
IV.C ONCLUSION
A printed, two-monopole-antenna system decoupled by using the neutralization-line technique has been demonstrated to attain good antenna port isolation, and the constructed prototype has been successfully constructed and tested. Each antenna is of the same size and occupies a clearance layout area of 8 mm × 14.5 mm on the two opposite corners of the system PC
B with a small ground portion between the antennas. The neutralization line in this design does not occupy much board space of the system ground plane and only takes 1.5 mm long inwards from the PCB edge in the small ground portion. In this case, the antenna feeding network and the I-PEX connectors can be all placed on that small ground portion for practical applications. The results showed that the obtained antenna port isolation is less than about –19 dB and is better than that of the reference case with no neutralization line by about 9 dB. The envelope correlation and the TAR
C were also studied and derived from the S parameters. The radiation patterns of the two monopoles cover the complementary space regions in general, and the antenna yields peak gain of about 2.1 dBi with radiation efficiency exceeding about 70%. The impedance of the isolation, the surface currents, and the near-fields were analyzed in detail for the effects of the neutralization line used. The proposed design is also expected to be applied to wireless module-card solution in the form factor of a USB dongle.
R EFERENCES
[1]IEEE ratifies 802.11n, Wireless LAN specification to provide
significantly improved data throughput and range, The IEEE Standard Association [Online]. Available at https://www.360docs.net/doc/5e6532512.html,/ announcements/ieee802.11n_2009amend- ment_ratified.html
[2]T. Y. Wu, S. T. Fang, and K.L. Wong, “Printed diversity monopole
antenna for WLAN operation,” Electron. Lett., vol. 38, pp. 1625-1626, Dec. 2002.
[3]T. Ohishi, N. Oodachi, S. Sekine, and H. Shoki, “A method to improve
the correlation coefficient and the mutual coupling for diversity antenna,”
in IEEE Antennas Propag. Soc. Int. Symp. Dig., Washington, DC, USA, 2005, pp. 507-510. [4]G. A. Mavridis, J. N. Sahalos, and M. T. Chryssomallis, “Spatial diversity
two-branch antenna for wireless devices,” Electron. Lett., vol. 42, pp.
266-268, Mar. 2006.
[5] C. Y. Chiu, C. H. Cheng, R. D. Murch, and C. R. Rowell, “Reduction of
mutual coupling between closely-packed antenna elements,” IEEE Trans.
Antennas Propag., vol. 55, pp. 1732-1738, Jun. 2007.
[6]K. L. Wong and J. H. Chou, “Integrated 2.4- and 5-GHz WLAN antennas
with two isolated feeds for dual-module applications,” Micro. Opt.
Technol. Lett., vol. 47, pp. 263-265, Nov. 2005.
[7]S. W. Su, J. H. Chou, and T. Y. Wu, “Internal broadband diversity dipole
antenna,” Microw. Opt. Technol. Lett., vol. 49, pp. 810-812, Apr. 2007.
[8]Y. Ge, K. P. Esselle, and T. S. Bird, “Compact diversity antenna for
wireless devices,” Electron. Lett., vol. 41, pp. 52-53, Jan. 2005.
[9]S. W. Su, J. H. Chou, and Y. T. Liu, Realization of dual-dipole-antenna
system for concurrent dual-radio operation using polarization diversity, Micro. Opt. Technol. Lett., vol. 51, pp. 1725-1729, Jul. 2009.
[10]S. W. Su, “A three-in-one diversity antenna system for 5 GHz WLAN
applications,” Micro. Opt. Technol. Lett., vol. 51, pp. 2477-2481, Oct.
2009.
[11] A. Diallo, C. Luxey, P. Le Thuc, R. Staraj, and G. Kossiavas, “Study and
reduction of the mutual coupling between two mobile phone PIFAs operating in the DCS1800 and UMTS bands,” IEEE Trans. Antennas.
Propag., vol. 54, pp. 3063-3074, Nov. 2006.
[12] A. Diallo, C. Luxey, P. Le Thuc, R. Staraj, and G. Kossiavas, “Enhanced
two-antenna structures for universal mobile telecommunications system diversity terminals,” IET Microw. Antennas Propag., vol. 2, pp. 93-101.
2008.
[13]Ansoft Corp., HFSS [Online]. Available: https://www.360docs.net/doc/5e6532512.html,/
products/hf/hfss
[14]Negative resistance, Wikipedia, the free encyclopedia [Online]. Available
at https://www.360docs.net/doc/5e6532512.html,/wiki/Negative_resistance
[15]M. Manteghi and Y. Rahmat-Samii, “Multiport characteristics of a
wide-band cavity backed annular patch antenna for multipolarization operations,” IEEE Trans. Antennas Propag., vol. 53, pp. 466-474, Jan.
2005.
[16] D. W. Browne, M. Manteghi, M. P. Fitz, and Y. Rahmat-Samii,
“Experiments with compact antenna arrays for MIMO radio communications,” IEEE Trans Antennas Propag., vol. 54, pp.
3239-3250, Nov. 2006.
[17]S. H. Chae, S. K. Oh, and S. O. Park, “Analysis of mutual coupling,
correlations, and TARC in WiBro MIMO array antenna,” IEEE Antennas Wireless Propag., vol. 6, pp. 122-125, 2007.
[18]S. Blanch, J. Romeu, and I. Corbella, “Exact representation of antenna
system diversity performance from input parameter description,”
Electron. Lett., vol. 39, pp. 705-707, May 2003.
[19]V. Plicanic, Z. Ying, T. Bolin, G. Kristensson, and A. Derneryd,
“Antenna diversity evaluation for mobile terminals,” in Proc. Eur. Conf.
Antennas Propag., Nice, France, 2006, pp. 1-3.
[20]S. W. Su, High-gain dual-loop antennas for MIMO access points in the
the 2.4/5.2/5.8 GHz bands, IEEE Trans. Antennas Propa., vol. 58, pp.
2414-2419, Jul. 2010.
[21]R. G. Vaughan and J. B. Andersen, “Antenna diversity in mobile
communications,” IEEE Trans. Vehicular Technol., vol. 36, pp. 149-172, Nov. 1987.
[22]Reverberation Test Systems, Bluetest [Online]. Available at
http://www.bluetest. se/products/reverberation-test-systems
[23]K. L. Wong, J. H. Chou, S. W. Su, and C. M. Su, “Isolation between
GSM/DCS and WLAN antennas in a PDA phone,” Micro. Opt. Technol.
Lett., vol. 45, pp. 347-352, May 2005.
[24]CTIA authorized test laboratory, CTIA, the wireless association [Online].
Available at https://www.360docs.net/doc/5e6532512.html,/business_resources/certification/ test_labs/
[25]John L. Volakis, Antenna engineering handbook, 4th ed. New York:
McGraw-Hill, 2007, ch. 6, pp. 16-19.
[26] B. Furht, S. A. Ahson, Long Term Evolution: 3GPP LTE Radio and
Cellular Technology. Boca Raton: CRC Press, 2009, ch. 12, pp. 441-443.
专注于微波、射频、天线设计人才的培养
易迪拓培训
网址:https://www.360docs.net/doc/5e6532512.html,
射 频 和 天 线 设 计 培 训 课 程 推 荐
易迪拓培训(https://www.360docs.net/doc/5e6532512.html,)由数名来自于研发第一线的资深工程师发起成立,致力并专注于微波、射频、天线设计研发人才的培养;我们于2006年整合合并微波EDA网(https://www.360docs.net/doc/5e6532512.html,),现已发展成为国内最大的微波射频和天线设计人才培养基地,成功推出多套微波射频以及天线设计经典培训课程和ADS、HFSS等专业软件使用培训课程,广受客户好评;并先后与人民邮电出版社、电子工业出版社合作出版了多本专业图书,帮助数万名工程师提升了专业技术能力。客户遍布中兴通讯、研通高频、埃威航电、国人通信等多家国内知名公司,以及台湾工业技术研究院、永业科技、全一电子等多家台湾地区企业。
易迪拓培训课程列表:https://www.360docs.net/doc/5e6532512.html,/peixun/rfe/129.html
射频工程师养成培训课程套装
该套装精选了射频专业基础培训课程、射频仿真设计培训课程和射频电
路测量培训课程三个类别共30门视频培训课程和3本图书教材;旨在
引领学员全面学习一个射频工程师需要熟悉、理解和掌握的专业知识和
研发设计能力。通过套装的学习,能够让学员完全达到和胜任一个合格
的射频工程师的要求…
课程网址:https://www.360docs.net/doc/5e6532512.html,/peixun/rfe/110.html
ADS学习培训课程套装
该套装是迄今国内最全面、最权威的ADS培训教程,共包含10门ADS
学习培训课程。课程是由具有多年ADS使用经验的微波射频与通信系
统设计领域资深专家讲解,并多结合设计实例,由浅入深、详细而又
全面地讲解了ADS在微波射频电路设计、通信系统设计和电磁仿真设
计方面的内容。能让您在最短的时间内学会使用ADS,迅速提升个人技
术能力,把ADS真正应用到实际研发工作中去,成为ADS设计专家...
课程网址:
https://www.360docs.net/doc/5e6532512.html,/peixun/ads/13.html
HFSS学习培训课程套装
该套课程套装包含了本站全部HFSS培训课程,是迄今国内最全面、最
专业的HFSS培训教程套装,可以帮助您从零开始,全面深入学习HFSS
的各项功能和在多个方面的工程应用。购买套装,更可超值赠送3个月
免费学习答疑,随时解答您学习过程中遇到的棘手问题,让您的HFSS
学习更加轻松顺畅…
课程网址:https://www.360docs.net/doc/5e6532512.html,/peixun/hfss/11.html
专注于微波、射频、天线设计人才的培养易迪拓培训
网址:https://www.360docs.net/doc/5e6532512.html,
CST学习培训课程套装
该培训套装由易迪拓培训联合微波EDA网共同推出,是最全面、系统、专业的CST微波工作室培训课程套装,所有课程都由经验丰富的专家授课,视频教学,可以帮助您从零开始,全面系统地学习CST微波工作的各项功能及其在微波射频、天线设计等领域的设计应用。且购买该套装,还可超值赠送3个月免费学习答疑…
课程网址:https://www.360docs.net/doc/5e6532512.html,/peixun/cst/24.html
HFSS天线设计培训课程套装
套装包含6门视频课程和1本图书,课程从基础讲起,内容由浅入深,
理论介绍和实际操作讲解相结合,全面系统的讲解了HFSS天线设计的
全过程。是国内最全面、最专业的HFSS天线设计课程,可以帮助您快
速学习掌握如何使用HFSS设计天线,让天线设计不再难…
课程网址:https://www.360docs.net/doc/5e6532512.html,/peixun/hfss/122.html
13.56MHz NFC/RFID线圈天线设计培训课程套装
套装包含4门视频培训课程,培训将13.56MHz线圈天线设计原理和仿
真设计实践相结合,全面系统地讲解了13.56MHz线圈天线的工作原理、
设计方法、设计考量以及使用HFSS和CST仿真分析线圈天线的具体
操作,同时还介绍了13.56MHz线圈天线匹配电路的设计和调试。通过
该套课程的学习,可以帮助您快速学习掌握13.56MHz线圈天线及其匹
配电路的原理、设计和调试…
详情浏览:https://www.360docs.net/doc/5e6532512.html,/peixun/antenna/116.html
我们的课程优势:
※成立于2004年,10多年丰富的行业经验,
※一直致力并专注于微波射频和天线设计工程师的培养,更了解该行业对人才的要求
※经验丰富的一线资深工程师讲授,结合实际工程案例,直观、实用、易学
联系我们:
※ 易迪拓培训官网:https://www.360docs.net/doc/5e6532512.html,
※ 微波EDA网:https://www.360docs.net/doc/5e6532512.html,
※ 官方淘宝店:https://www.360docs.net/doc/5e6532512.html,
专注于微波、射频、天线设计人才的培养
易迪拓培训