激光传感器

A SENSOR FOR LASER ULTRASONIC MEASUREMENT OF ELASTIC PROPERTIES DURING MANUFACTURE
P. Ridgway 1, R. Russo 1, E. Lafond 2, T. Jackson 2, X. Zhang 2
Lawrence Berkeley National Laboratory, Berkeley, CA, USA; 2 Institute of Paper Science and Technology at Georgia Tech, Atlanta, GA, USA
Abstract: An automated sensor has been developed for use in paper manufacturing and for demonstration on a full scale paper machine during commercial operation. This laser ultrasonic sensor provides non-contact and on-line measurement of the elastic properties of paper and paperboard. It was tested on a pilot web handler at web speeds up to 12.7 m/s. Measurements of flexural rigidity and out-of-plane shear rigidity were made by fitting the frequency dependence of the phase velocity of A o Lamb waves mode to a model equation. Ultrasonic waves were generated in the paper with a pulsed Nd:YAG laser and detected with a Mach-Zehnder interferometer coupled with a scanning mirror/timing system to compensate for paper motion. On-line measurements agreed very well with off-line laboratory measurements.
Introduction
In Laser Ultrasonics (LU), also known as laser-based ultrasonics, acoustic waves can be
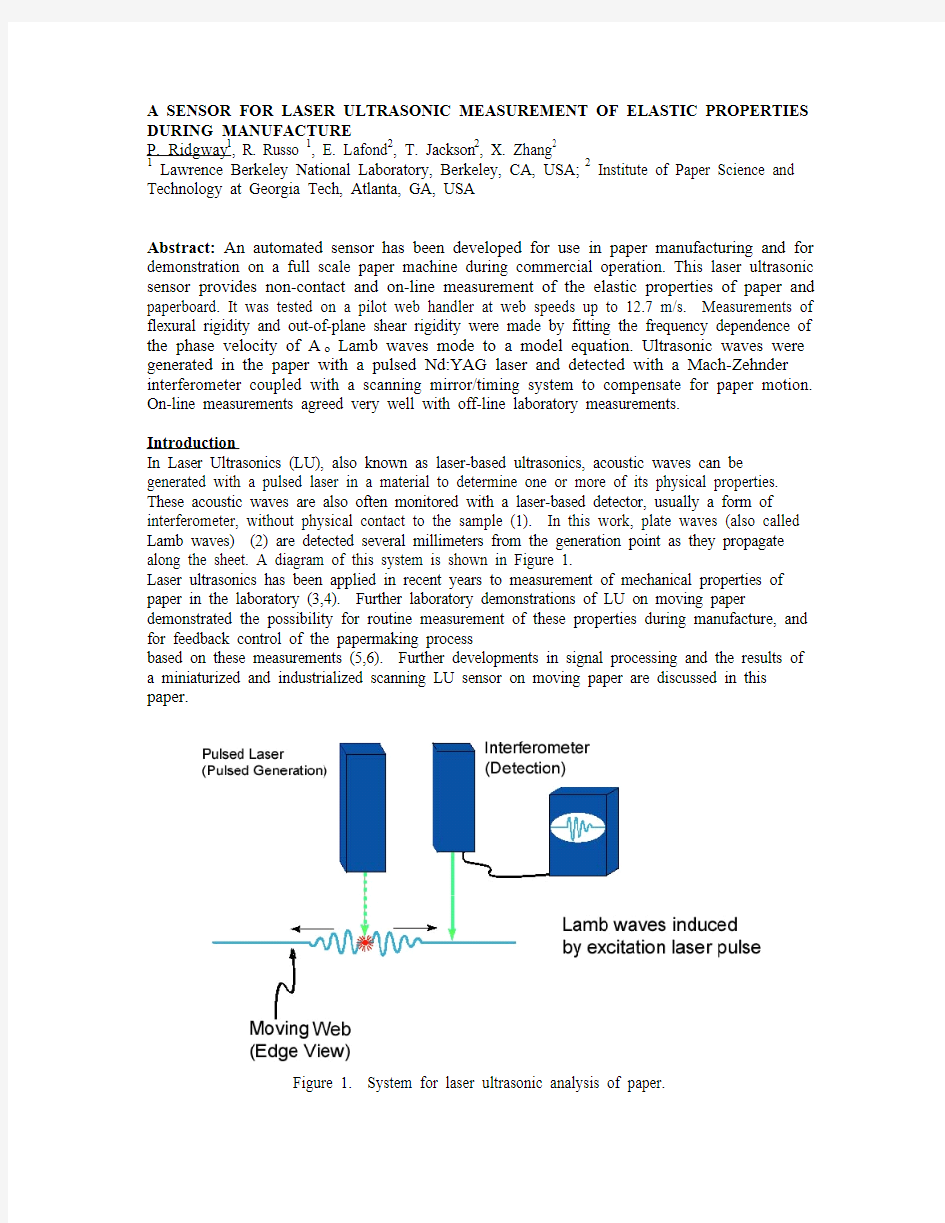
generated with a pulsed laser in a material to determine one or more of its physical properties. These acoustic waves are also often monitored with a laser-based detector, usually a form of interferometer, without physical contact to the sample (1). In this work, plate waves (also called Lamb waves) (2) are detected several millimeters from the generation point as they propagate along the sheet. A diagram of this system is shown in Figure 1.
Laser ultrasonics has been applied in recent years to measurement of mechanical properties of paper in the laboratory (3,4). Further laboratory demonstrations of LU on moving paper
demonstrated the possibility for routine measurement of these properties during manufacture, and for feedback control of the papermaking process
based on these measurements (5,6). Further developments in signal processing and the results of a miniaturized and industrialized scanning LU sensor on moving paper are discussed in this paper.
Figure 1. System for laser ultrasonic analysis of paper.
Background
LU signal energy in paper goes predominantly into the zero order anti-symmetric (A o) mode plate wave (3). The A o mode is characterized by relatively large (hundreds of nanometers) out-of plane displacements, which are easily detected with commercially available laser vibrometers. In this work, a Fourier transform, ‘phase unwrapping’ computational method was used to calculate two elastic properties from a phase velocity versus frequency dispersion curve that was constructed from two A o wave signals (7). The properties are flexural rigidity (D) and out-of-plane Shear Rigidity, SR (for homogeneous material shear rigidity is equal to shear modulus times caliper). Flexural rigidity differs slightly (for paper it is typically about 9% larger) from Bending Stiffness (BS) through a term that depends on the in-plane Poisson’s ratios (νxy and νyx):
D = BS/(1-νxyνyx)
The flexural rigidity measurement comes primarily from the low frequency portions of the dispersion curve, whereas shear rigidity comes from the high frequency components. As basis weight decreases (the basis weight is the weight per unit area of the web), the division between the high and low frequency regimes of the dispersion curve moves to higher frequencies. For low basis weight papers, there is little range for SR determination in our LU frequency range (about 10 KHz to 600 KHz). In practice, this means that LU methods provide good estimates of D and SR for paperboard products, but only good D values for light weight papers.
Bending stiffness is routinely measured in paperboard mill laboratories. Bending stiffness is of interest because it is closely related to flexural rigidity, which is the determining factor in the rigidity of paper sheets and structures. Of all the elastic parameters that could conceivably be measured “on-line” (on the papermaking machine), flexural rigidity is the one most directly related to important end use performance and the one of most practical value. Out of plane shear rigidity is a sensitive indicator of fiber bonding and is an important contributor to in-plane compressive strength (8). In addition to monitoring end-use properties, on-line measurements of D and SR are potentially useful as inputs for feedback process control.
The ability to monitor bending stiffness during manufacture (and implement the corresponding feedback process control) is expected to reduce production costs by reducing the basis weight needed to reach stiffness targets and reducing the amount of off-standard (low-stiffness) product. For example, a modest 2% reduction in basis weight needed to reach stiffness targets on a 479 ton per day uncoated free sheet machine is estimated to save $1.1 million/year in reduced fiber, chemicals and energy use. If a reduction in off-standard product from 6.2 to 5.2% (a 1% increase in first grade product) is achieved, an additional savings of $0.4 million/yr is expected. Further, a reduction in paper breaks is likely since on-line monitoring will allow a more uniform stiffness in the product, and therefore a more uniform strength of the web. Additional savings from recycling less off-standard product and less web breaks have not been included in this savings estimate (9).
LU measurements are complementary to contact ultrasonic techniques. Contact methods are applicable to the detection of low frequency zero order symmetric (S0) plate waves (2), in-plane shear horizontal plate waves, and out-of-plane bulk waves (10-15). Rather than flexural and shear rigidity, contact methods provide determinations of planar stiffness, in-plane shear rigidity, and effective out-of-plane bulk stiffness. The contact transducer coefficients find application through correlation with strength properties, whereas flexural rigidity is of practical importance in its own right. Another significant advantage of LU is that it does not require physical contact with the sheet, eliminating that potential cause of paper damage.
Sensor Hardware
The core of the prototype miniaturized sensor developed jointly by LBNL and IPST at Georgia Tech is shown in figure 2. It is housed in an aluminum enclosure designed to be mounted on the upstream end of the “head package” of a “Smart Platform” scanning system made by ABB
Corporation. The head package contains various sensors and is scanning the whole width of the web perpendicularly to the web motion as the paper is produced and goes by.
LU Sensor
Package Figure 2. The sensor installed on the pilot scale web simulator at IPST at Georgia Tech.
The core of the sensor is shown in detail in Figure 3 with its front cover removed. The cables are enclosed in a 2” diameter plastic conduit that is external to the scanning system and connects to an ancillary instrument platform up to 5 meters away. The ultrasound generation system consists of a pulsed Nd:YAG laser (New Wave Tempest 10) that delivers a 15 nanosecond pulse at 1.06 μm into an optical fiber , which transmits the laser pulse over a distance of approximately 8 m to the sensor where it is focused onto the web. To generate the ultrasonic signal, the generation laser beam was focused with a 10mm focal length aspheric lens. Since the beam at the output of the fiber optic is highly divergent, the laser generation spot is approximately 15 mm away from the aspheric lens. The laser pulse energies ranged from 3 to 8 mJ. The detection interferometer beam was focused onto the paper at a position separated by from 5 to 15 mm from the position where the generation beam was focused. The generation spot can be moved along the Machine Direction (MD: direction in which the web is moving) or Cross Direction (CD: direction in the plane of the web perpendicular to MD) thanks to the X-Y position servos. Using a thermostat, a thermocouple and a Vortex tube, the sensor is cooled, temperature-regulated and protected from dust by an air pressure above the ambient pressure. It also incorporates a web temperature sub-sensor to correct for the effect of web temperature on the flexural rigidity.
The ultrasound detector is a Mach-Zehnder interferometer (Polytec-PI CLV1000/OVD02) which includes a continuous, low-power (eye-safe) helium-neon laser source, coupled with a scanning mirror to move the detection laser beam and track paper motion, and a timing system to fire the generation laser when the detection beam is in the proper position on the paper surface.
Sensor
Sensor scanner
SmartPlatform
Spinning
sensor temp x/y position
Generation laser
Vortex Sheet temp sensor
thermostat frame
Sheet guide lower head
package thermocouple
Interferometer
Cooling Air servos optical fiber
Cooler Sensor Software
Figure 3. Detailed diagram of the core of the sensor.
The scanning mirror optics innovation was crucial and is shown in figure 4. Without it, textural noise from the moving, rough paper surface under the detection laser would overwhelm the LU signal which has a much smaller amplitude. Details of the apparatus have been described
previously (5). The system has since been modified to rotate the scanning mirror with a feedback-controlled DC servomotor and to collect data with a personal computer equipped with an oscilloscope card (Gage Compuscope 1250).
Figure 4. Detection on moving paper using a spinning mirror.
Data collection
A LabVIEW-based software is used to control the mechanical system and extract D and SR values from the ultrasound signals. The software also integrates sensor data from the rest of the AB
B scanning system. The sensor is capable of measuring D and SR in the MD, CD, or at any intermediate angle. During ultrasound data collection we monitor signals from other sensors within and outside the scanner and convert them to measurements of basis weight, web water content and temperature, web tension along MD and web speed. Gathering these signals
simultaneously allows precise alignment among all collected sensor data. These data are used to correct measurements of D for the effects of variations in these properties. Typically, 5 to 15 ultrasonic signals are averaged for better signal to noise ratio and consistency. All signals collected within a CD position range are joined into an averaged signal, which is displayed in the software panel shown in Figure 5. On it, one can see an averaged A0 wave starting at 10 μs with a 5 mm separation distance (in black) and an A0 wave having a 10 mm separation distance (in red). The unaveraged 10 mm signal is displayed on the middle left panel.
When the intensity of the light collected by the interferometer falls below a user-selected threshold (lower left panel), then the ultrasound signal is considered invalid and is not included in the averaged signal. All sensor data, CD position, time of day, and each raw ultrasonic pulse (one per laser shot) are saved to a log file for back-up.
Figure 5.Main panel for the data acquisition and dynamic averaging of the ultrasonic waves
before processing to extract elastic properties
Signal Analysis
The Fourier transforms of two ultrasonic signals, recorded at different excitation-to-reception separations (d) (usually 5 or 10 mm), were used to calculate the phase velocity C as a function of angular frequency, ω. Αt each frequency, the phase velocity was calculated from the difference in separation, ?d, and difference in Fourier phase ?φ,
C(ω) = -ω?d/?φ .
A plot of the phase velocity versus frequency is known as a dispersion curve. In order to calculate values of D/(basis weight, BW) and SR/BW, an approximate relationship of C(ω ) to
D/BW and D/SR,
C4+(D/SR)ω2C2-(D/BW)ω2 = 0 ,
was fitted to a selected region of the curve by an iterated, least square method. A proper determination of the dispersion equation requires the solution of a complex transcendental equation involving in-plane and out-of-plane elastic properties (2,15). For the A o mode at low frequencies, wave motion can be modeled with beam equations. The simplified dispersion equation shown earlier is easily derived if deformation is taken as the sum of shear and bending deformations, plane sections of the beam are assumed to remain planar during wave motion, and rotational inertia is ignored. We made mathematical comparisons between the full and approximate dispersion equation for typical papers in the frequency range of our measurements and found very small differences (16).
An artifact created by moving the detection beam with the paper is the changing optical path length inducing a very large amplitude distortion of the ultrasound signal at frequencies below about 5 KHz. This distortion is in the form of linear ramp that is useful in tuning the excitation laser trigger timing system, and can be filtered out when collecting ultrasound signals. The change in optical path length (~100μm) is very large compared to the displacement due to ultrasound (~100nm) we detect. This requires a very large dynamic range in the displacement measurement. The range of the Polytec vibrometer is large enough so that there is no saturation of the signal due to this changing optical path. This is partly because the vibrometer system measures out-of-plane velocity, rather than displacement. A disadvantage of out-of-plane velocity measurement is that the low-frequency sensitivity is much lower than in the case of interferometers which measure displacement, such as the LU Two-Wave Mixing (TWM) photorefractive interferometer developed at IPST at Georgia Tech for use on stationary paper and paperboard (17-18). The LU TWM-based instrument is, however, too sensitive to a fast and continuous motion of the object along the direction of the detection beam. This prevented its use in our sensor for moving paper. On the other hand, TWM signals cover a wider frequency range that can be more readily compared with theory to extract elastic properties. Thus the TWM interferometer is preferred for the development of automated algorithms for calculation of elastic properties from laser ultrasound signals on both stationary and moving paper.
The software described above is used for data acquisition, signal averaging and curve fitting. Signals at each separation are averaged. The resulting pair of signals and the web basis weight are used to calculate D and SR. The software panel that analyzes the waves, calculates and displays D and SR is shown in Figure 6. One can see a 5 mm (top window, in red) and a 10 mm (2nd window from top, in black) separation LU-generated Lamb wave and the magnitude of their spectra (center left window).
Figure 6. Software panel for display of automated D and SR measurements in real time. D is noted FR.
Results
The results presented hereafter are some preliminary data collected immediately after installing the sensor described above for testing on IPST at Georgia Tech’s pilot facility, prior to installation in the mill. Results of more extensive measurements made with an earlier and much more primitive version of this sensor on several paper grades at web speeds up to 25 m/s were published previously (19).
Laser Ultrasonic Measurements on Moving Paper
In the data presented in table 1, the signals obtained with the LU online sensor were not averaged, and the measurements have not been corrected for web moisture content, temperature, variations in basis weight, or MD tension as those parameters were not varied. Table 1 shows the flexural rigidity along the MD and CD obtained by the laser ultrasonic on-line sensor, at varying web speeds, on a belt of “IP offset” paper (paper used for copy machines; basis weight 77 g/m2), 1 foot wide and about 40 feet in circumference. The standard deviations in the measurements indicate the large local variability in elastic properties that is characteristic of paper. Correlation with Measurements from the TWM Laboratory Instrument
The LU values measured on the moving web were compared to offline LU measurements made with the TWM laboratory instrument. In the later case, dozens of TWM ultrasonic signals obtained at separation distances from 5 to 35 mm were combined into a single averaged measurement of the flexural rigidity of the sample. Therefore we cannot report a standard deviation of the measurement for comparison with the variation in the averaged measurements on moving paper. However, a variation of approximately 6% from location to location is expected from past work with the TWM instrument on samples of similar basis weights and dimensions. The area tested was only a few inches long, instead of a strip approximately 40 feet long for the measurements on moving paper. It is worth noticing that, thanks to averaging, the TWM results are well within the standard deviation of the results on moving paper.
Sensor
TWM
Laboratory
Online
sensor
Web speed (m/s) 0 1-9
MD 5.03E-04 5.37±1.4 E-04
D (N.m) (avg)
CD 3.33E-04 3.67±0.8 E-04
Table 1: Laboratory TWM interferometer and online sensor measurements on “IP Offset” paper
Further work will include tests on paper samples with basis weights ranging from 50-160 g/m2, and comparison of the on-line laser ultrasonic flexural rigidity results with off-line measurements.
Summary
An automated and miniaturized laser ultrasonic sensor has been developed for non-contact measurement of flexural rigidity of moving paper during manufacture. Prototype sensor hardware and software designed for demonstration on a full-scale paper machine in commercial operation, and data collected in the initial stages of system tests at a pilot facility are described. The continuous monitoring of flexural rigidity on moving paper during manufacture that this sensor provides will allow control of the papermaking process to reduce stiffness variability and maximize stiffness while minimizing basis weight when desired, and reduce waste reprocessing costs. It is another step toward a paper manufacturing process that is more efficient and cost-effective in use of energy and natural resources.
Acknowledgement
We thank Ake Hellstrom of ABB Corp. for consultation and design advice. We thank David White, technology transfer director of IPST for the economic analysis (9). This research is supported by the Department Of Energy/ Industrial Technology Programs, under Contracts No. DE-AC03-76SF00098, DE-FC07-97ID13578 and DE-FC07-02ID14344, and by internal funding from IPST at Georgia Tech.
References
(1) Scruby, B. and Drain, L.,“Laser Ultrasonics, Techniques and Applications”, Adam Hilger, New York (1990)
(2) Graff, F., “Wave Motion in Elastic Solids”, Dover, New York (1975)
(3) Johnson, M., PhD Thesis, Georgia Institute of Technology (1996)
(4) Berthelot, Y., and Johnson, M., “Laser Ultrasonics in Copy Paper”, Optical Eng. 36(2):408-416 (1997)
(5) Ridgway, P., Hunt, A., Quinby-Hunt, M., and Russo, R., “Laser Ultrasonics on Moving Paper”, Ultrasonic s 37:395-403 (1999)
(6) Pouet, B., Lafond, E., Pufahl, B., Bacher, D., Brodeur, P., and Klein, M., “On-Machine Characterization of Moving Paper Using a Photo-Emf Laser Ultrasonics Method”, SPIE Conference on Nondestructive Evaluation Techniques for Aging Infrastructure & Manufacturing/Process Control and Sensors for Manufacturing, Newport
, CA, SPIE3589:160 (1999)
(7) Jong, J., Brodeur, P., Lafond E., Gerhardstein J., and Pufahl B. “Laser Ultrasonics for Noncontact Measurement of Lamb Waves in Static and Moving Paper”, J. Pulp & Paper Sci
26(10):358-366 (2000)
(8) Habeger, C. and Whitsitt, W.,”A Mathematical Model of Compressive Strength in Paperboard” Fiber Sci. and Tech. 19:215 (1983)
(9) IPST in house report, using Jaako Poyry consultants’ economic model, $139/t Fiber, $103/t Chemicals, $40/t Energy (electricity $0.05/kWh, fuel oil $20/bbl), and uncoated free sheet value $630/t (2003)
(10) Baum, G., and Habeger, C., “On-line Measurement of Paper Mechanical Properties”, Tappi 63(6):63-66 (1980)
(11) Habeger, C., and Baum, G., “On-line Measurement of Paper Mechanical Properties”, Tappi 69(6):106-111 (1986)
(12) Vahey, D., “Ultrasonic-Based Strength Sensor for On-Line Measurements”, Tappi 70(3): 79-82 (1987)
(13) Pankonin, B., and Jimmerson, D., “Mill Experiences with On-Line Ultrasound-Based Stiffness Measurements”, 1999 Engineering/Process and product quality conference and trade fair, Anaheim, CA, USA, 12-16 Sept. 1999, vol. 2:919-928 (1999)
(14) Hall, M., “On-Line Ultrasonic Measurement of Strength in Paper”, Sensors 7(7):13-20 (1990)
(15) Habeger, C., Mann, R., and Baum, G., “Ultrasonic Plate Waves in Paper”, Ultrasonics, 17:57-62 (1979)
(16) Unpublished work of Chuck Habeger and Ted Jackson, Institute of Paper Science and Technology (IPST), Atlanta, GA, USA
(17) Lafond, E., Brodeur, P., Gerhardstein, J., Habeger, C., Telschow, K., “Photorefractive interferometers for ultrasonics measurements on paper”, Ultrasonics, 40:1019-1023, (2002) (18) Lafond E., Jackson T., Ridgway P., Habeger C., Russo R., X. Zhang, “A fully fiberized laser-ultrasonic instrument for measuring the stiffness properties of paper”, World Congress on Ultrasonics 2003 Proceedings, Paris, France, September 2003, 1431-1434 (2004)
(19) Ridgway, P., Russo, R., Lafond, E., Jackson, T., Habeger, C., “Laser Ultrasonic System for On-Line Measurement of Elastic Properties of Paper “, Journal of Pulp & Paper Science 29(9): 289-293 (2003)