matlab基础作图实例

实验三 MATLAB 的绘图
一、实验目的:掌握利用MATLAB 画曲线和曲面。 二、实验容:
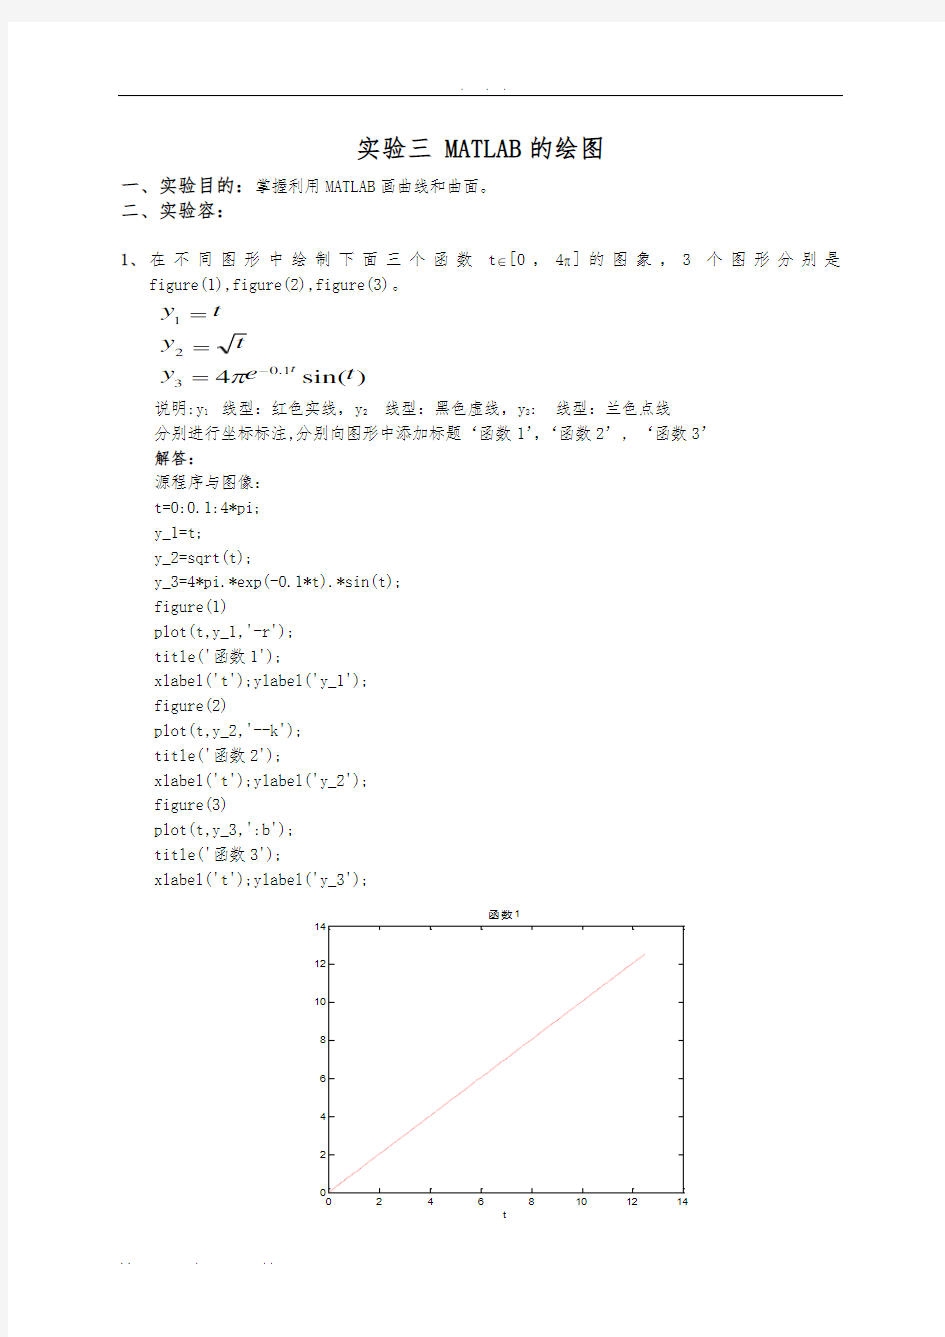
1、 在不同图形中绘制下面三个函数t ∈[0,4π]的图象,3个图形分别是
figure(1),figure(2),figure(3)。
)
sin(41.0321t e y t
y t y t -==
=π
说明:y 1 线型:红色实线,y 2 线型:黑色虚线,y 3: 线型:兰色点线 分别进行坐标标注,分别向图形中添加标题‘函数1’,‘函数2’, ‘函数3’ 解答:
源程序与图像: t=0:0.1:4*pi; y_1=t;
y_2=sqrt(t);
y_3=4*pi.*exp(-0.1*t).*sin(t); figure(1)
plot(t,y_1,'-r'); title('函数1');
xlabel('t');ylabel('y_1'); figure(2)
plot(t,y_2,'--k'); title('函数2');
xlabel('t');ylabel('y_2'); figure(3)
plot(t,y_3,':b'); title('函数3');
xlabel('t');ylabel('y_3');
函数1
t
y
1
函数2
t y
2
函数3
t
y
3
2、 在同一坐标系下绘制下面三个函数在t ∈[0,4π]的图象。 (用2种方法来画图,其中之一使用hold on ) 使用text 在图形适当的位置标注“函数1”“函数2”,“函数3” 使用gtext 重复上面的标注,注意体会gtext 和text 之间的区别 解答: 方法一: 程序与图形: t=0:0.1:4*pi; y_1=t;
y_2=sqrt(t);
y_3=4*pi.*exp(-0.1*t).*sin(t); figure(1)
plot(t,y_1,'-r'); gtext('函数1');
xlabel('t');ylabel('y'); hold on
plot(t,y_2,'--k'); gtext('函数2');
hold on
plot(t,y_3,':b'); gtext('函数3');
246
8101214
-10-50
5
10
15
t
y
方法二:
t=0:0.1:4*pi; y_1=t;
y_2=sqrt(t);
y_3=4*pi.*exp(-0.1*t).*sin(t); figure(1)
plot(t,y_1,'-r',t,y_2,'--k',t,y_3,':b'); xlabel('t');ylabel('y'); text(10,10,'函数1'); text(11,2,'函数2'); text(11,-5,'函数3');
0246
8101214
-10
-5
5
10
15
t
y
4、绘制ρ=sin(2θ)cos(2θ)的极坐标图
源程序和图形:
theta=0:pi/100:2*pi;
rho=sin(2*theta).*cos(2*theta); polar(theta,rho);
90
270
1800
5、绘制y=10x 2
的对数坐标图并与直角线性坐标图进行比较。
在一个图形中绘制4个子图,分别使用plot 、semilogx 、semilogy 、loglog 函数进行绘制; 并且用title 进行标注;同时添加网格线 源程序与图像: x=0:0.1:5; y=10*x.^2;
subplot(2,2,1) plot(x,x);
title('plot 函数图');grid on
subplot(2,2,2) semilogx(x,y);
title('semilogx 函数图');grid on
subplot(2,2,3) semilogy(x,y);
title('semilogy');grid on
subplot(2,2,4) loglog(x,y);
title('loglog 函数图');grid on
02
46
24
6plot 函数图
10
10
10
1
0100
200
300semilogx 函数图
0246
10
-2
10
10
2104
semilogy
10
10
10
1
10
-2
10
10
2
104
loglog 函数图
6、绘制下面函数在区间[-6,6]中的图象。
??
???>+-≤<≤=3
,630,
0,sin )(x x x x x x x y
源程序和图像: x=-6:0.1:0; y_1=sin(x);
plot(x,y_1,'-k');
xlabel('x');ylabel('y'); gtext('y_1=sin(x)'); hold on x=0:0.1:3; y_2=x;
plot(x,y_2,'--b'); gtext('y_2=x'); hold on x=3:0.1:6; y_3=-x+6;
plot(x,y_3,':r'); gtext('y_3=-x+6');
-6
-4-2
0246
-1-0.500.511.522.53x
y
7、三维空间曲线绘制t ∈[0,4π]