雅思图表作文笔记

Preferences of Students in an American University in 2002
?The American university students vary in our reading taste. Some prefer classics while others like popular books
better. A specific case here is the reading preferences of students in an American university.
?According to statistics, for the year 2002, popular fiction was their favourite, accounting for 65.9 percent of book
circulation in the library. General nonfiction ranked second, with 18.2 percent. Books on science, technology and education altogether accounted for 10.8 percent while art, literature and poetry proved to be the least popular, with merely a 5.1 percent.
?Based on the preceding data, it is justified in claiming that for those students, books served primarily a
entertainment purpose. They preferred the books that were relaxing and repelled those with an education function.
Therefore, it could be concluded that the students did not make an appropriate use of their library resources.
?Popular fiction gains the most popularity among the American university students.
?Popular fictions take an overwhelming superiority to the books of science, technology and literature.
?The data speaks for itself that popular fictions prevail (流行)among American university students.
?According to the World Tourism Organization, American receipts from tourism in 1997 totaled $75 billion. Italy
ranked second with receipts worth $30 billion. France and Spain came equal third, while Britain was fourth.
?In 1997, China enjoyed a bigger percentage increase in revenue from foreign visitors than any other country. Its
receipts from tourism exceeded/surpassed/were over $10 billion, increasing by 18.4% /representing an increase of 18.4%/ up 18.4% over/against a year earlier. Turkey also enjoyed a 17.4% increase in receipts from tourism.
?Hong Kong suffered an 11.1% fall in tourist revenues, while Austria’s income fell by 11.4%.
?
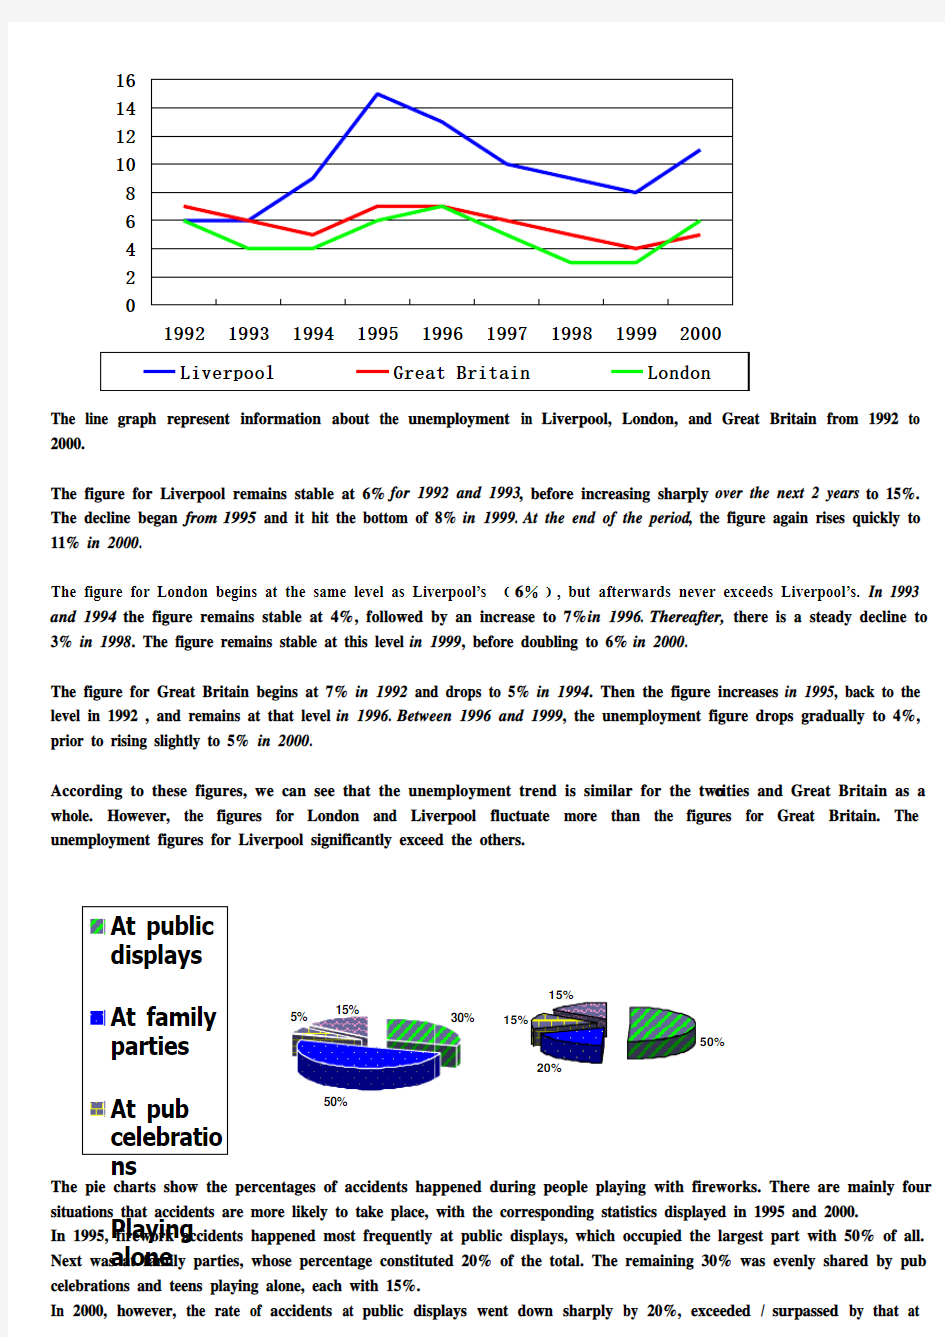
The line graph represent information about the unemployment in Liverpool, London, and Great Britain from 1992 to 2000.
The figure for Liverpool remains stable at 6% for 1992 and 1993, before increasing sharply over the next 2 years to 15%. The decline began from 1995 and it hit the bottom of 8% in 1999. At the end of the period , the figure again rises quickly to 11% in 2000.
The figure for London begins at the same level as Liverpool’s ﹙6%﹚, but afterwards never exceeds Liverpool’s. In 1993 and 1994 the figure remains stable at 4% , followed by an increase to 7% in 1996. Thereafter, there is a steady decline to 3% in 1998. The figure remains stable at this level in 1999, before doubling to 6% in 2000.
The figure for Great Britain begins at 7% in 1992 and drops to 5% in 1994. Then the figure increases in 1995, back to the level in 1992 , and remains at that level in 1996. Between 1996 and 1999, the unemployment figure drops gradually to 4%, prior to rising slightly to 5% in 2000.
According to these figures, we can see that the unemployment trend is similar for the two cities and Great Britain as a whole. However, the figures for London and Liverpool fluctuate more than the figures for Great Britain. The unemployment figures for Liverpool significantly exceed the others.
The pie charts show the percentages of accidents happened during people playing with fireworks. There are mainly four situations that accidents are more likely to take place, with the corresponding statistics displayed in 1995 and 2000. In 1995, firework accidents happened most frequently at public displays, which occupied the largest part with 50% of all. Next was at family parties, whose percentage constituted 20% of the total. The remaining 30% was evenly shared by pub celebrations and teens playing alone, each with 15%.
In 2000, however, the rate of accidents at public displays went down sharply by 20%, exceeded / surpassed by that
at 024
6
810121416199219931994199519961997199819992000Liverpool Great Britain
London
50%
Playing
alone
50%
family parties, which increased dramatically by 1.5 times and became the largest of all. In addition, the ratio of accidents occurred when teens playing alone still stayed at 15%, and it is worth mentioning that the smallest portion was at pub celebrations in 2000 with only 5%, which was just one third of its counterparts in 1995.
In conclusion, as clearly shown in the two pies, firework accidents are most likely to occur at public displays and family parties, and the chances of leading to accidents in private individual activities such as family reunions and children playing by themselves definitely increased during the five years.
From the chart, we can see obviously that the change of data is generally divided into three broad categories as follows:
In the first group, the trend is upward. Firework accidents at family parties made up 20% in 1995, while its percentage went up sharply to 50% in 2000, being the largest portion.
However, the second group presents a decreasing trend. The ratio of firework accidents that happened in public displays declined by 20% from 50% (the lion’s share) in 1995 to 30% in 2000. What’s more, in 1995, ac cidents at pub celebrations accounted for just 15%, whilst the chart described a threefold drop to only 5% in its percentage in 2000.
As shown in the last group, the rate remained steady at 15% in the accidents occurred when teenagers played alone.
The chart shows the different modes of transport used to travel to and from work in one European city in 1950, 1970 and 1990.
雅思小作文柱状图Bar类解析
雅思小作文柱状图Bar类解析 关于柱状图我们主要分两种写法: 1.如果横轴有明显的时间推移的话,烤鸭们应连接柱子顶点,重在描述柱子的升降起伏,写法类似于线状图。 2.如果无时间推移,则写法和饼状图一样。即按照各比较对象所占比例的高低写,同时要注意各所占比例之间的比较。 可以用到的词汇有: 1.表示“占多少”的动词 Account for Take up Make up Contribute to Have Represent 2.表示“最高级”和“比较级” 第一/最小the largest/biggest proportion of 第二the second/next largest/expensive(+ 形容词的最高级) 第三followed closely by 最低/最小the smallest percent of all 3.表示“相同比例” 即在饼状图中遇到了比例相同或者差不多的饼,如有A B两个比较对象。 A accounts for the same percentage as B . The proportion of A is as high as B A and B contributed equally/evenly to (all ) 在观察柱形图的时候首先要留意横轴的数据,若横轴为时间轴或者是年龄趋势,那么我们在主体段写作时候的基本思路就为从左到右;若横轴数据为具体专有名词诸如地点,交通工具等时,主体段的写作思路就可能是按照柱形的长度排列。本文根据上述的分析做以下的总结: 一、按照横轴从左到右排列数据: 1. 两根柱且趋势截然相反 在这种写法中,我们要注意观察2根柱的上升/下降的幅度。以下我们就来看一个例子:
雅思小作文地图题讲解
一个地图题的开头: The map about the development of the village sufficiently illustrates the way of progress of this area. In this map, we can find four main sectors and two main roads intersected with one railway and one motor way. It seems the overall development of this village has strong connection with the construction of roads. 雅思小作文地图题词汇 Part 1:表时间 流程图和地图题中都可能涉及时间表达。流程题中,使用较多的是过程时长的表述,而地图题的时间使用则体现为地理变迁的时间变化。一般在方位选址图题中较少出现。确切的时间指引,既增加文章的自然和连贯度,也能体现行文的精确性。 常见表示时间的词: in few hours几小时 during the period of …在…期间after 10 days 10天后 from…to从…到… between …and在…之间 over the…year period在一个…年期间5 years before 5年前a decade earlier几十年前from that moment on从那时起after a while一会 since自从 since then自从 finally最后 over the subsequent …years近连续几年 例句:The process lasts for up to 7 day s and the products are finally distributed to customers. Part 2:表空间 空间表达地图题出现概率较高,但流程图也偶尔出现。空间应该是地图题解题关键和主要特点。许多考生容易误把地图题的空间位置写成上下左右位置,这是失分点非常大的地方。朗阁海外考试研究中心的专家们提示烤鸭,空间表达时需要注意区分:在空间状语里,in表内部,on表接壤,to表分开。 常用的空间词: lies 靠近
雅思7分大作文范文批改和解析
雅思7分大作文范文批改和解析 距离雅思写作7分你大概还有3个步骤要走,是的,不是谁都可以轻轻松松活动雅思高分的。今天给大家带来了雅思7分大作范文批改和解析,希望能够帮助到大家,一起来学习吧。 雅思7分大作范文批改和解析 雅思写作提高第一步:结构(5.0 - 5.5) 问题:出国留学的优点(the advantages of disadvantages of study abroad) 同学:One reason for those who decide to go overseas to get a higher degree is that they believe they can get better education in certain fields. That is to say, different universities in different countries have their specialized courses and rich resources can be provided according to their needs and requirements. Another reason is that they can learn a foreign language in a more efficient way. There is no denying that living in an all-round English environment and being affected by local culture make people quick learners. 解析:出国留学和高学历完全是两回事(出去读初中和高中都算出国);出国就是better education,在国内就不是better? 出
雅思图表作文经典句型
雅思图表作文经典句型 一.上升增长 1.…add up to…增加了 e.g. The total amount of …added up to 14 billion pounds(14%) in 1994. 2.to jump to / to soar to.. 一跃达到/ 猛增到… e.g. The total working days lost soaredto 10 million in 1979. 3.…an increase of about…percent as compared with.. 与…相比大约增加了… e.g. In August as many as 39 car accidents were reported, indicating an increase of about 79% as compared with the number of January. 4.…to experience an increase/incline …有了增长 e.g. Tobacco consumption is experiencing an incline. 二.下降,减少 1.…to sink/drop/reduce to…减少到… e.g. The rate of strikes sank/dropped to the lowest point in 1979. 2.…to experience a decrease/decline …有了减少 e.g. Tobacco consumption is experiencing a decrease. 注意:
雅思经典图表作文范文
# 43. You should spend about 20 minutes on this task. The table below shows CO2 emissions for different forms of transport in the European Union. The Pie Chart shows the percentage of European Union funds being spent on different forms of transport. You should write at least 150 words.
model answer: The chart shows CO2 emissions per passenger kilometre for variuos methods of transport in the European Union while the pie chart shows European Union spending on transport. Flying by air produces by far the greatest CO2 emissions, approximately three times as much as passenger cars which are the next largest producers. Very little is spent by the EU on air travel while roads make up more than half of the EU transport budget. Trains produce about three times less CO2 emissions per passenger kilometre than passenger cars and eight times less than air travel. Nearly a third of EU transport funds are spent on railways. Ships are a clean form of transport and produce about the same amount of CO2 per passenger kilometre as trains do. However, only 2 percent of EU funds are spent on ports. A further one percent is spent on inland waterways. Coaches are the cleanest form of transport. Emissions of CO2 per passenger kilometre from coaches are half those of buses. Buses emit less than half as much CO2 per passenger kilometre as cars. The European Union spends 10 percent of its transport budget on public transport, such as buses and coaches. (197 words)
G类雅思7分作文范文
G类雅思7分作文范文 Topic Some people say that older people should live with their adult children. Others say that they shouldn't. Which do you think is good practice. TEXT(257 Words) One of the topics in daily life is whether or not the older people should live with their adult children. My answer is the question is that it is better for them not to. Firstly, people of different ages have different ways of life. The old people like a quiet, peaceful and regular life whereas the young prefer noises, activities and unrestrained enjoyment. If they live together, old may feel that they are always disturbed and the young may feel that they are often handicapped. Secondly, people of different generations have different views and values. What is quite normal to the parents may seem to be old-fashioned or wrong to the children. When they live together, they may disagree on matters ranging from minor domestic matters to national and international issues. Consequently, family life may be unpleasant or even unbearable to both the old and the young. Last but not the least, adult children, like their parents, love independence and freedom, but their parents still take them as children and unintentionally interfere in their affairs. The situation will be worse if the adult children are already married. In this case, the children have already built a new and closed world and any outside interference may lead to conflicts. From what has been discussed above, we may safely draw the conclusion that if the parents and their adult children do not live together, both the old and the young can enjoy complete independence and freedom, live a life they like, and keep intact their affections for each other 雅思范文:电脑是否现代教育所必须? 成因 You should spend about 40 minutes on this task. Present a written argument or case to an educated non-specialist audience on the following topic. Are computers an essential feature of modern education? What subjects can be better taught using computers? Are there aspects of a good education that cannot be taught using computers? You should write at least 250 words. 提示 You should you your own ideas, knowledge and experience and support your arguments with examples and relevant evidence. Topic words: Computers Essential features / absolutely necessary Modern education / good education Task words: There are no specific task words. Three separate questions are given. Questions I should ask myself: Do I think computers are essential for education? What subjects do I think are best be learnt using computers? What do I think are the features of a good education, and are computers important in it?
英语考试作文-9分雅思图表写作范文全集之地图篇 学校变迁
英语考试作文 9分雅思图表写作范文全集之地图篇学校 变迁 9分雅思图表小作文范文全集之地图学校变迁The diagrams below show the site of a school in 2004 and the plan for changes to the school site in 2024. 真题传送门:2017全年雅思写作真题范文大汇总(第一时间更新) 范文集结:全部9篇9分雅思写作地图范文汇总放送 范文 The two pictures compare the layout of a school as it was in the year 2004 with a proposed site design for the year 2024. It is clear that the main change for 2024 involves the addition of a new school building. The school will then be able to accommodate a considerably larger number of students. In 2004, there were 600 pupils attending the school,
and the two school buildings were separated by a path running from the main entrance to the sports field. By 2024, it is expected that there will be 1000 pupils, and a third building will have been constructed. Furthermore, the plan is to join the two original buildings together, creating a shorter path that links the buildings only. As the third building and a second car park will be built on the site of the original sports field, a new, smaller sports field will need to be laid. A new road will also be built from the main entrance to the second car park. Finally, no changes will be made to the main entrance and original car park. (183 words, band 9)
雅思小作文之图表作文
二.雅思图表作文 1.企业垃圾(线性图) 题目:The graph below shows the amounts of waste produced by three companies over a period of 15 years. 范文:The line graph compares three companies in terms of their waste output between the years 2000 and 2015. It is clear that there were significant changes in the amounts of waste produced by all three companies shown on the graph. While companies A and B saw waste output fall over the 15-year period, the amount of waste produced by company C increased considerably. In 2000, company A produced 12 tonnes of waste, while companies B and C produced around 8 tonnes and 4 tonnes of waste material respectively. Over the following 5 years, the waste output of companies B and C rose by around 2 tonnes, but the figure for company A fell by approximately 1 tonne. From 2005 to 2015, company A cut waste production by roughly 3 tonnes, and company B reduced its waste by around 7 tonnes. By contrast, company C saw an increase
2016.12.17雅思真题大作文7分范文
Task:Some people think getting old is entirely bad. However, others think that life of the elderly in modern world is much easier than in the past. Discuss both views and give your own opinion. 思路解析: 2016年雅思收官之战的作文来了一道新题,问当今社会老年人的生活是不是很 糟糕?说是新题,因为本题以前从未原题出现过,但关于年龄的话题却不缺少。 比如2010年7月10日“年轻人是否适合担任政府要职”,2012年3月10日“老 龄化现象的原因及解决方法”,2012年3月31日“年轻人和老年人谁的价值更 高?”,2013年6月8日“政府是否应该对老年人养老提供财政支持?”,2015 年1月1日“年轻人当领导,行不行?”,2015年4月11日“老年人与年轻人 争夺工作职位,怎么办?”等等。 本题需要论证的对立观点是:年老很糟糕 vs. 当今社会年老没有那么糟糕。那 么,变老有哪些坏处呢?首先,当然是身体条件没有以前好了,甚至可能出现多 种疾病(物质层面);其次,不工作了,与人的联系少了,心里可能会感觉孤单, 甚至感觉没有价值了(精神层面);最后,变老后对社会的依赖程度更高,给社会 增加了压力(社会层面)。那么,这些问题在当今社会是不是得到了解决呢?首先, 医疗条件的改善有助于保持老年人的身体状况;互联网的出现有助于缓解老年人 的心理孤单问题;物质水平的提高也降低了老年人给社会造成的压力。如此观之, 现代社会老年人的生活的确容易多了,但我的观点是:外部条件只是改善老年人 生活的一个方面,最重要的还是老年人自己要积极调整心态,努力适应退休后的 生活,从而过一个更幸福更祥和的晚年。 Sample answer: Getting old is a natural process that nobody really likes. When you reach a certain age, your physical conditions will inevitably deteriorate, and you may suffer from various kinds of diseases. When you retire, you will feel isolated because your previous work contacts may be all gone, then you may feel useless to the world. Furthermore, when you get too old, you’ ll have to rely heavily on the support from others, either physically or emotionally, and your life will become a great pressure to your family and the whole society as well. For all these bad things about getting old, many people argue that the life of the elderly today is much easier than in the past. In the first place, medical advances nowadays have made it possible for the old people to stay sound and healthy for quite a long while even after they retire. Diseases such as diabetes, hypertension and heart attack which might have
(管理流程图)雅思A类图表作文各个击破(流程图、柱图、曲线、表格)免费
A类图表作文各个击破(流程图、柱图、曲线图、表格) .5.2表格 4.5.2.1解题关键 F 1表格与饼图一样,都是静态图。切入点在描述分配; F 2表格题考查列举数字的能力和方法。通过举一些有代表性的数据来说明问题; F 3横向比较。介绍横向各个数据的区别、变化和趋势; F 4纵向比较。介绍纵向各个数据的区别、变化和趋势; F 5不需要将每一个数据分别说明,突出强调数据最大值和最小值; F 6对比时要总结出数据对比最悬殊的和最小的。 4.5.2.2表格举例 Topic 4-4:The table below shows carbon dioxide emissions from transport in three European countries in 1994 and 2004.Summarise the information by selecting and reporting the main features and make comparisons where relevant.(表格贴不上,大家看附件吧~ ^_^)范文
The given table provides an overview of carbon dioxide emissions from four main transport sources (namely,road transport,railways,civil aviation and shipping) in the United Kingdom,France and Germany in 1994 and 2004. Germany,although having higher emissions than either the United Kingdom or France did,saw the amount decrease slightly from 47.2 to 46.7 million tonnes.By comparison,France recorded an increase of four million tonnes from 34.7 million in 1994,while the United Kingdom had a smaller growth,2.5 million tonnes over the same period.(纵向比较三个国家1994到2004年间二氧化碳释放量的整体趋势变化。) In all the three countries, road transport was responsible for the majority of emissions.(横向对四个二氧化碳释放源进行比较,点明最大释放源)In the United Kingdom,road transport produced emissions up to 32.6 million tonnes in 2004,2 million more than ten years earlier,while other three transport sources did not show any remarkable growth.(接着对三个国家的释放源进行描述说明,说明从1994年到2004年间的变化)A similar pattern was seen in France,where road transport added 3.6 million tonnes to the total emissions within ten
雅思图表作文TASK1精讲精练
雅思图表作文TASK1精讲精练
雅思图表作文TASK1精讲精练 A理论部分: 雅思小作文概论 1、文章结构:主要分三部分:i。introductory sentence;ii。body paragraph;iii。Concluding sentence 具体讲:第一段introductory sentence只要写一句话,交待图形(如the line graph, pie chart等等),描述对象(如图表描述的是the number of tourists visiting England),地点(如the US, the UK等)以及时间(如between 1988 and 1997等等);另外要注意的就是第一段不能和图表上方已给的句子太过相似!否则,会失分的! 第二部分一般写1~3段,这要视情况而定。这部分主要就是对比不同的数据,如相似或相同的数据;某个数据是另一个数据的2倍;某个数据所占比例最大或最小等等。 最后一段concluding sentence也只要写一句话,
主要是总结图表的整个趋势。 2。文章的效果。很多学生会发现小作文的例文特别简单(特别是剑桥书里提供的)。原因很简单,这个report的目的就是要让university lecturer了解某个事物的发展趋势,因此写出来的文章必须结构清晰、易懂,绝对不能太复杂,也不要把每个数据都描写出来,只要描写有代表性的,重要的数据即可。 以下为雅思小作文的四个基本步骤 第一步:改写题目 经过同义词转换在短短的1分钟内就写好作文的第一段。 举例:The graph below shows the percentage of people unable to find work in three major countries from 1983 to 1992. 题目中划线的单词都能够进行同义转换: graph—figure, show—illustrate, percentage—proportion, major—key, from…to…—between…and…, 第二步:分析时态
雅思大作文5分与7分范文各项指数对比分析
雅思大作文5分与7分范文各项指数对比分析 Let’s compare two answers to a question.The topic is as follows: International tourism has brought enormous benefit to many places. At the same time, there is concern about its impact on local inhabitants and the environment. Do the advantages of international tourism outweigh the disadvantages? A Poor Essay – The following is a band 5 essay. International tourism has brought enormous benefit to many places. At the same time, there is concern about its impact on local inhabitants and the environment. Do the disadvantages of international tourism outweigh the advantages? In my opinion advantages outweight the disadvantages. Firstly, many countries like Egypt or Tailand live from tourism Lots of people work there as a seilsmens or tourist guides. These countries without support of tourists wouldn’t be able to funtcion properly. Secondly, in countries visited by tourists are plenty of places where people just can’t pass because of rare animals or plant s. Another thing is that people like traveling and seeing new exotic places. They like lie on the beach or swim in ocean. Furthermore, tourism is now more growing industry highering tousands of people. There are makeing new places to work and to have fun. But on the other hand, people often for get that they aren’t the only beings on the planet. Many tourists are living garbage just anywhere. Some of them wan’t an exotic souvenir so they pay for illegal things like dea d or live animals or some sculpture. To sum up I think international traveling is a good thing but people must realise that there is something else besides them. They need to know that flora and fauna needs to be protected. People have to enjoy their holidays but alsow protect environment. Below is an analysis of this essay. Task Response The essay question has been copied and used as the introduction (paragraph 1). Once these 34 words are taken off the word count, the response is underlength at 194 words and so loses marks. Nevertheless, the topic is addressed and a relevant position is expressed, although there are patches – as in the third paragraph – where the development is unclear. Other ideas are more relevant but are sometimes insufficiently developed.
雅思图表作文经典套句50句-题
雅思图表作文经典套句50句1.该表格描述了在…年之…年间…数量的变化。 2.该柱状图展示了… 3.该图为我们提供了有关…有趣数据。 4.该图向我们展示了… 5.该圆形图揭示了… 6.这个曲线图描述了…的趋势。 7.数据(字)表明… 8.该树型图向我们揭示了怎样… 9.该数据(字)可以这样理解… 10.这些数据资料令我们得出结论… 11.如图所示… 12.根据这些表(数字)… 13.如表格所示… 14.从图中可以看出,…发生了巨大变化。 15.从图表我们可以很清楚(明显)看到… 16.这个图表向我们展示了… 17.该表格描述了…年到…年间a与b的比例关系。 18.该图以圆形图形式描述了…总的趋势。
19.这是个柱型图,描述了… 20.如图所示,两条曲线描述了…的波动情况。 21.在…至…期间,…基本不变。 22.在…年到…期间… 23. 1995年至1998三年里… 24.从那时起… 25.…月(年)至…月(年)…的数量基本不变。 26.数字急剧上升至… 27.…至…期间…的比率维持不变。 28.…的数目在…月(年)达到顶点,为… 29.比率维持在… 30.…的比例比…的比例略高(低)。 31.…与…的区别不大。 32.该图表表明…的数目增长了三倍。 33…逐年减少,而…逐步上升。 34.…的情况(局势)到达顶(高)点,为…百分点。 35.数字(情况)在…达到底部。 36.数字(情况)达到底部(低谷)。
37. a是b的…倍。 38. a增长了… 39. a增长到… 40.比例高(低) 41.…数字呈上升趋势。 42. …到…发生急剧上升。 43.从…到…,下降速率减慢。 44.从这年起,…逐渐下降至… 45.与…相似 46.与…相同 47.…与…之间有许多相似(不同)之处 48. a于b有共同之处。 49. a与b之间的差别在于… 50.…年…急剧上升。
英语考试作文-9分雅思图表写作范文全集之混合图篇 英国移民
英语考试作文 9分雅思图表写作范文全集之混合图篇英 国移民 9分雅思图表小作文范文全集之混合图题型:英国移民The chart below shows long-term international migration in UK. 范文集结:全部9篇9分雅思写作混合图范文汇总放送 真题传送门:2017全年雅思写作真题范文大汇总(第一时间更新) 范文: The chart gives information about UK immigration, emigration and net migration between 1999 and 2008. Both immigration and emigration rates rose over the period shown, but the figures for immigration were significantly higher. Net migration peaked in 2004 and 2007. In 1999, over 450,000 people came to live in the UK, while the number of people who emigrated stood at just under 300,000. The figure for net migration was around 160,000, and
it remained at a similar level until 2003. From 1999 to 2004, the immigration rate rose by nearly 150,000 people, but there was a much smaller rise in emigration. Net migration peaked at almost 250,000 people in 2004. After 2004, the rate of immigration remained high, but the number of people emigrating fluctuated. Emigration fell suddenly in 2007, before peaking at about 420,000 people in 2008. As a result, the net migration figure rose to around 240,000 in 2007, but fell back to around 160,000 in 2008.(159)
雅思6.5分 小作文范文参考
●批改By Will 本次批改严格按照ILETS小作文评分标准进行。ILETS小作文评分项:TA (内容的完整性), CC (连贯性及一致性), GRA (语法范围及精准度), LR (词汇资源)。文末会进行总评及打分。 ●文中标识: 用词不当逻辑错误语法错误修改添加 The graph provides the information concerning the average temperatures on a month basis in three major cities.(介于有两张图,都要提一下。此后可加一句:In addition, clearly demonstrated in the table are the time of sunshine on an annual base.) (补充:在下一段看到了你对于后一张图的总结,这样的话建议你在开头强调一下“the first graph”) As can be seen from the graph, there is a similar trend in terms of average monthly temperature between London and New York during the period from January to December. (可加入连接词:To be specific) The average temperature in London (介于你后面写的是两个城市的数据,这里改为:for both of the cities) gradually rises from January to July both in London and new york, reaching a peak at 25 degrees and 20 degrees respectively. After that, the following 4 months witness a dramatic decrease both in London and new york. In comparison (这里不妨分段), an opposite trend is found in Sydney. It (这是悉尼的第一句,建议写出来具体的量词至少:The temperature) keeps stable at 25 degrees from January to march, after which the average temperature undergoes a considerable descent, reaching the bottom point at approximately 15 degrees, before there is (there is 没必要了,可以去除) a steady ascent by 10 degrees. It is obvious that the table depicts the average number of hours of sunshine per year in three major cities. As we can see from the statistics, when it comes to the total annual hours of sunshine, new york ranks first, followed by Sydney ,London lies last. Specifically, people who live in new york enjoy 2,353 hours of sunshine every year, which is similar to people living in London with 2,473 hours (不是人和人像,是时间长短像,改为:which is similar to the amount of sunshine for those in London). However, only 1,180 hours of sunshine are found in London annually. 总评6.5(TA6.5 CC6.5 LR6.5 GRA7.0) 1.语法变化上从句数量可以了,分词的使用还可以多一些。偶尔试试一到两句倒装,如我在开头给你的那个。 2.趋势等词汇变化可以,试着多换换题目话题词汇,如people=residents=citizens