雅思小作文 ielts writing task1
The chart and graph below give information about sales and share prices for Coca-Cola.
Write a report for a university lecturer describing the information shown below.
?You should write at least 150 words.
?You should spend about 20 minutes on this task.
model answer:
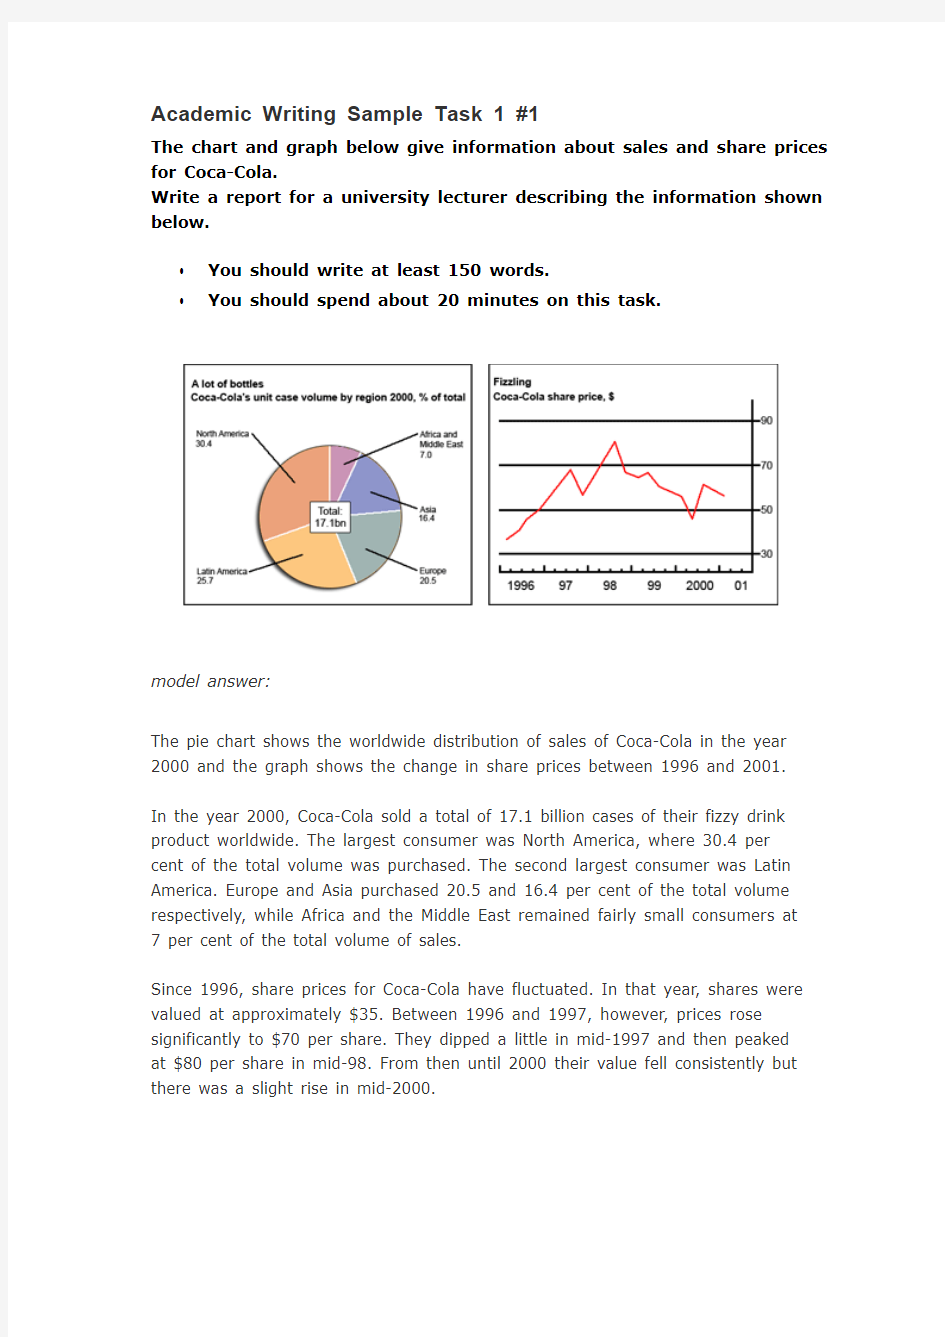
The pie chart shows the worldwide distribution of sales of Coca-Cola in the year 2000 and the graph shows the change in share prices between 1996 and 2001.
In the year 2000, Coca-Cola sold a total of 17.1 billion cases of their fizzy drink product worldwide. The largest consumer was North America, where 30.4 per cent of the total volume was purchased. The second largest consumer was Latin America. Europe and Asia purchased 20.5 and 16.4 per cent of the total volume respectively, while Africa and the Middle East remained fairly small consumers at 7 per cent of the total volume of sales.
Since 1996, share prices for Coca-Cola have fluctuated. In that year, shares were valued at approximately $35. Between 1996 and 1997, however, prices rose significantly to $70 per share. They dipped a little in mid-1997 and then peaked at $80 per share in mid-98. From then until 2000 their value fell consistently but there was a slight rise in mid-2000.
The chart below gives information about global sales of games software, CDs and DVD or video.
Write a report for a university lecturer describing the information.
?You should write at least 150 words.
?You should spend about 20 minutes on this task.
model answer:
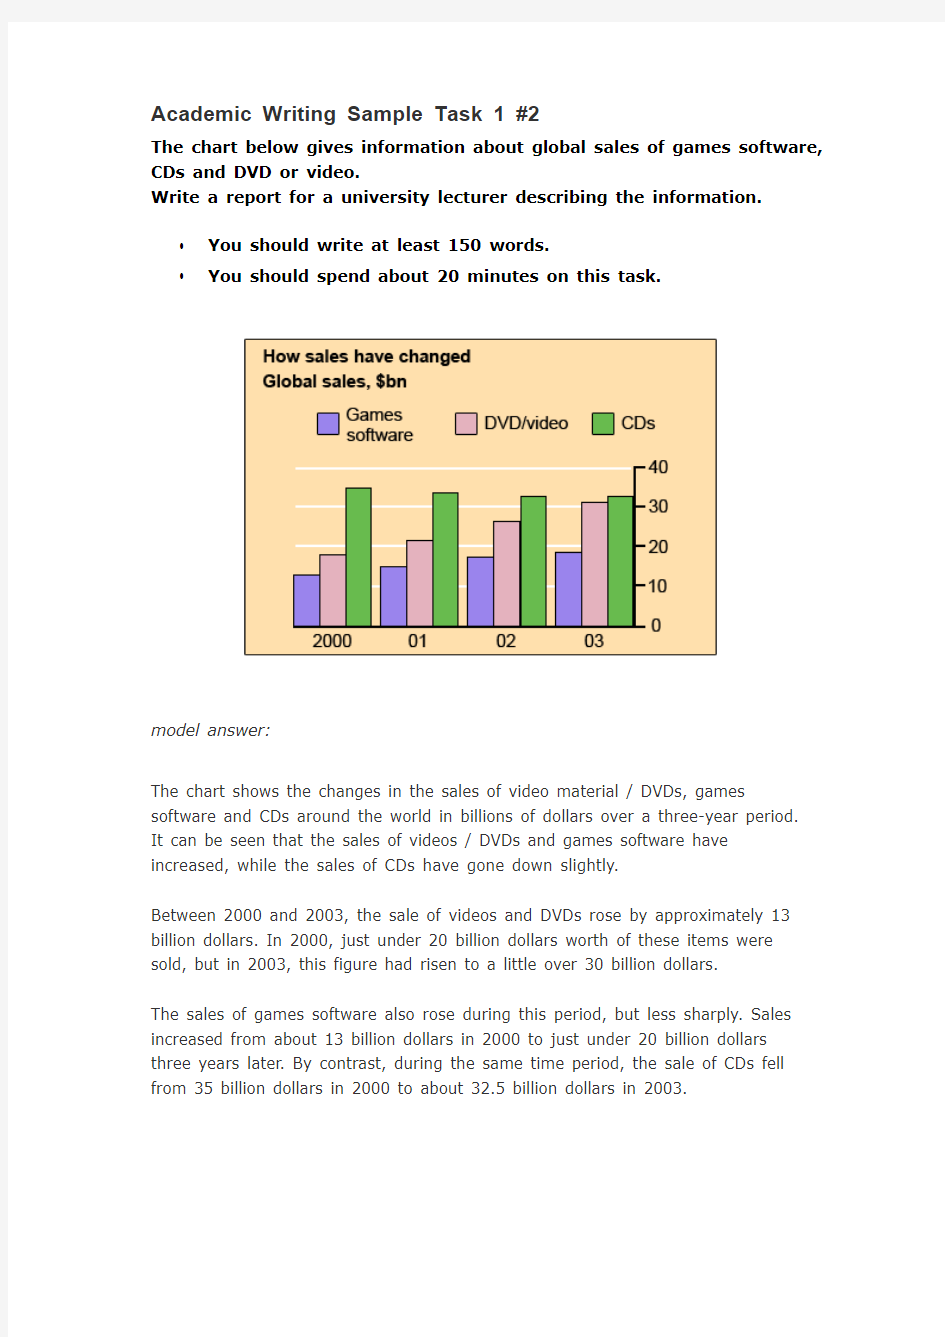
The chart shows the changes in the sales of video material / DVDs, games software and CDs around the world in billions of dollars over a three-year period. It can be seen that the sales of videos / DVDs and games software have increased, while the sales of CDs have gone down slightly.
Between 2000 and 2003, the sale of videos and DVDs rose by approximately 13 billion dollars. In 2000, just under 20 billion dollars worth of these items were sold, but in 2003, this figure had risen to a little over 30 billion dollars.
The sales of games software also rose during this period, but less sharply. Sales increased from about 13 billion dollars in 2000 to just under 20 billion dollars three years later. By contrast, during the same time period, the sale of CDs fell from 35 billion dollars in 2000 to about 32.5 billion dollars in 2003.
The graphs below show the types of music albums purchased by people in Britain according to s3x and age.
Write a report for a university lecturer describing the information shown below.
?You should write at least 150 words.
?You should spend about 20 minutes on this task.
model answer:
The three graphs provide an overview of the types of music people purchase in the UK. At first glance we see that classical music is far less popular than pop or rock music.
While slightly more women than men buy pop music, the rock market is dominated by men with 30% buying rock, compared to 17% of women. From the first graph we see that interest in pop music is steady from age 16 to 44 with 20% of the population continuing to buy pop CDs after the age of 45.
The interest in rock music reaches its peak among the 25 to 34 year olds, though it never sells as well as pop. Interest also drops off after the age of 35 with an even sharper fall from age 45 onwards, a pattern which is the opposite to the classical music graph.
Academic Writing Sample Task 1 #4
You should spend about 20 minutes on this task.
The graphs below show the numbers of male and female workers in 1975 and 1995 in several employment sectors of the republic of Freedonia.
Write a report for a university teacher describing the information shown.
You should write at least 150 words.
model answer:
The two decades between 1975 and 1995 brought significant changes in the representation of women in Freedonia's work force, according to the graphs.
In 1975, for example, some 300 000 men and 250 000 women worked in the communications sector. Twenty years later, though the number of men remained unchanged, the number of women rose to 550 000.
A similar situation was seen in the wholesale and retail trade sector, where the number of women rose from about 550 000 in 1975 to almost 800 000 two decades later. The number of men in this sector remained stable over the period, at around 700 000.
Women also made gains in both the finance/banking industries and in the defence-related public sector. Whereas some 125 000 women worked in finance and banking institutions in 1975, the number increased to 450 000 by 1995. The number of men grew only marginally from 425 000 to 480 000 over the same period. In defence, the number of men declined from 225 000 to 200 000, while the number of women rose from 25 000 to over 100 000.
Two sectors that retained stable employment numbers for both men and women were manufacturing, which had about 300 000 women and 650 000 men in both surveyed years, and the public sector (non-defence), which employed 650 000 women and 850 000 men.
Thus, women appear to have made gains in the Freedonian work force but not at the expense of men.
(243 words)
You should spend about 20 minutes on this task.
Eating sweet foods produces acid in the mouth, which can cause tooth decay. (High acid levels are measured by low pH values)
Describe the information below and discuss the implications for dental health.
You should write at least 150 words.
Anyone who has visited a dentist has been told that eating excessive amounts of sweets risks harming the teeth. This is because sweets lower pH levels in the mouth to dangerous levels.
When the pH level in the mouth is kept above 5.5, acidity is such that teeth are unlikely to be in danger of decay. Sweet foods, however, cause pH in the mouth to drop for a time, and the longer pH levels remain below 5.5, the greater the opportunity for decay to occur.
By comparing fruit sugar, cane sugar and honey, which are all common ingredients of sweet foods, we find that cane sugar lowers pH levels for the longest period, thus producing the greatest risk of the three. Approximately five minutes aftfter consuming cane sugar, pH levels drop to as little as pH 3.5. They then begin to rise slowly, but do not rise above pH 5.5 until at least 30 minutes have elapsed. By contrast, fruit sugar, which causes the mouth's acidity to fall to just above pH 4, poses a danger for a shorter period: tooth decay is unlikely 20 minutes after consumption. Honey appears an even less risky substance. Though acidity falls to about pH 4.75 within five minutes of consumption, it returns to above pH 5.5 in under fifteen minutes.
The implications, then, are that people who insist on eating sweet foods should be aware of the ingredients, and that fruit sugar or honey appear preferable to cane sugar.
(242 words)
The diagram below shows the typical stages of consumer goods manufacturing, including the process by which information is fed back to earlier stages to enable adjustment.
Write a report for a university lecturer describing the process shown.
?You should write at least 150 words.
?You should spend about 20 minutes on this task.
model answer:
Most consumer goods go through a series of stages before they emerge as finished products ready for sale.
Raw materials and manufactured components comprise the initial physical input in the manufacturing process. Once obtained, these are stored for later assembly. But assembly first depends upon the production planning stage, where it is decided how and in what quantities the stored materials will be processed to create sufficient quantities of finished goods. The production planning stage itself follows the requirements of the goods' design stage that proceeds from extensive research. After assembly, the products are inspected and tested to maintain quality control l Those units that pass the inspection and testing stages are then packaged, despatched and offered for sale in retail outlets. The level of sales, which is the end point of the manufacturing process, helps determine production planning.
A product's design is not only the result of product research, but is also influenced by testing and market research. If the testing stage (after assembly and inspection) reveals unacceptable problems in the finished product, then adjustments will have to be made to the product's design. Similarly, market research, which examines the extent and nature of the demand for products, has the role of guiding product design to suit consumer demands which may change with time. Market research, while influenced by product sales, also serves to foster future sales by devising suitable advertising for the goods.
Thus the reality of consumer goods manufacturing goes well beyond a simple linear production process.
Academic Writing Sample Task 1 #7
The table below shows social and economic indicators for four countries in 1994, according to United Nations statistics.
Describe the information shown below in your own words. What implications do the indicators have for the countries?
?You should write at least 150 words.
?Allow yourself 20 minutes for this task.
Indicators Canada Japan Peru Zaire Annual income per person (in $US)1110015760160130
Life expectancy at birth76785147
Daily calorie supply per person3326284619271749
Adult literacy rate (%)99996834
A glance at four indicators of economic and social conditions in four countries, Canada, Japan, Peru and Zaire, in 1994 reflects the great differences that exist between wealthier and poorer nations.
The table shows that Japan and Canada had annual incomes of $15 760 and $11 100 per person, respectively. These figures were overwhelmingly greater than the corresponding figures of $160 in Peru and $130 in Zaire.
Health indicators, too, reflected overall levels of affluence in the four nations. Life expectancy at birth, for example, was higher among the more economically developed countries. Japan reported the highest life expectancy, 78. This was followed by Canada, 76; Peru, 51; and Zaire, 47; This suggests that richer societies are able to put more money into health care than poorer ones.
The amount of calories consumed daily per person roughly followed the same ranking. Canadians each consumed some 3 326 calories per day while the Japanese took 2846 calories. The corresponding figures for Peru and Zaire were 1927 and 1749, respectively.
Literacy rates among adults, too, were higher in wealthier countries, no doubt a reflection of ability to invest in education. Canada and Japan both reported literacy rates of 99%, while Peru claimed 68%. Zaire, the least economically developed of the four countries, had a literacy rate of 34%.
The data appear to confirm the often cited link between national wealth and health and education standards.
Academic Writing Sample Task 1 #8
The diagram below shows the average hours of unpaid work per week done by people in different categories. (Unpaid work refers to such activities as childcare in the home, housework and gardening.)
Describe the information presented below, comparing results for men and women in the categories shown. Suggest reasons for what you see.
?You should write at least 150 words.
?You should spend about 20 minutes on this task.
model answer:
The diagram reveals that the number of hours per week spent in unpaid work is unequally distributed between men and women.
In households where there are no children, women are reported to work some 30 hours per week in such tasks as housework and gardening. Men's contribution to these unpaid jobs averages a considerably lower 18 hours.
When children enter the household, however, the inequality becomes even more pronounced. In families of 1 - 2 children, men maintain approximately the same number of hours of unpaid work as in childless households, but the number of hours women work in the home rises to 52 per week, much of it, on doubt, due to childcare responsibilities.
Interestingly, when there are three or more children in the household, men are found to work even fewer hours around the house than before the appearance of the third child. Whereas women's unpaid hours rise to approximately 56 per week, the corresponding figure for men, 16, actually represents a decrease.
The data suggest that the increased presence of women in the paid work force has yet to lead to an increased role for men in the home.
雅思小作文词汇总结
雅思小作文总结 1.读数据的方法 表达例句 多达 up to /as much as The number of shoppers plunged by up to 23 per cent. House prices fell as much as 40% between 1980 and 1985. 仅仅 only, a mere, no more than The web economy represents a mere 1% of the country’s GDP. 超过 top, exceed Exports topped / exceeded 10 billion in 2006. 超过 in excess of The turnover of the industry was in excess of 1.5 billion. 少于、多于 less than/ more than More than one-third of the British population has trouble sleeping from time to time. 少于、多于 above/over/below The consumption of fish was just below 50 grams. Less beef was consumed (just over 50 grams). 总数 a total of A total of 900 million was spent on public transport. 剩余的 remaining Medicine represented 30 per cent of the company’s revenues, merchandise 40 per cent and vehicles the remaining 30 per cent. 历史最高、低值 a(n)new/record/all-time/high a(n)new /all-time low The enrollment rate dropped to an all-time low, 50%. The price of oil reached a new high in 2010. UK trade deficit with China rose almost 10% to 3 billion, a ten-year high. 在。。。范围ranging from…The price was volatile, ranging from 20 to 40. 分别地 respectively Animals grazing and tree clearance constituted 25 per cent and 40 per cent of the world’s land degradation respectively. 到达最高点,到达,等于。。。peak at/amount to/equal Britain’s crime rate peaked at 9% or so in 1999. Time lost due to illness amounted to 1200 working days. 相比 versus There was a steep decrease in the spending on education (223 million in 1989 versus 110 million in 1994). 2.表示倍数的方法 表达例句 升2、3、4倍double/triple/quadruple Rent as a percentage of the household expenditure more than doubled between 1974 and 1998. 是。。。2、3倍 double/twice/triple/treble This park will cover 1400 surface acres, twice the size of the old park. This city had an accident rate triple the national average. 。。。2,3倍twofold/threefold There was a twofold increase in retail sales. The rent on average increased threefold in the past five years. 是。。。2、3倍twice/three times …as…as Television was twice as popular as washing machine in 1999. Britons were twice as likely to die from heart attacks as Italians and three times as Chinese.
雅思经典图表作文范文
# 43. You should spend about 20 minutes on this task. The table below shows CO2 emissions for different forms of transport in the European Union. The Pie Chart shows the percentage of European Union funds being spent on different forms of transport. You should write at least 150 words.
model answer: The chart shows CO2 emissions per passenger kilometre for variuos methods of transport in the European Union while the pie chart shows European Union spending on transport. Flying by air produces by far the greatest CO2 emissions, approximately three times as much as passenger cars which are the next largest producers. Very little is spent by the EU on air travel while roads make up more than half of the EU transport budget. Trains produce about three times less CO2 emissions per passenger kilometre than passenger cars and eight times less than air travel. Nearly a third of EU transport funds are spent on railways. Ships are a clean form of transport and produce about the same amount of CO2 per passenger kilometre as trains do. However, only 2 percent of EU funds are spent on ports. A further one percent is spent on inland waterways. Coaches are the cleanest form of transport. Emissions of CO2 per passenger kilometre from coaches are half those of buses. Buses emit less than half as much CO2 per passenger kilometre as cars. The European Union spends 10 percent of its transport budget on public transport, such as buses and coaches. (197 words)
雅思小作文地图题讲解
一个地图题的开头: The map about the development of the village sufficiently illustrates the way of progress of this area. In this map, we can find four main sectors and two main roads intersected with one railway and one motor way. It seems the overall development of this village has strong connection with the construction of roads. 雅思小作文地图题词汇 Part 1:表时间 流程图和地图题中都可能涉及时间表达。流程题中,使用较多的是过程时长的表述,而地图题的时间使用则体现为地理变迁的时间变化。一般在方位选址图题中较少出现。确切的时间指引,既增加文章的自然和连贯度,也能体现行文的精确性。 常见表示时间的词: in few hours几小时 during the period of …在…期间after 10 days 10天后 from…to从…到… between …and在…之间 over the…year period在一个…年期间5 years before 5年前a decade earlier几十年前from that moment on从那时起after a while一会 since自从 since then自从 finally最后 over the subsequent …years近连续几年 例句:The process lasts for up to 7 day s and the products are finally distributed to customers. Part 2:表空间 空间表达地图题出现概率较高,但流程图也偶尔出现。空间应该是地图题解题关键和主要特点。许多考生容易误把地图题的空间位置写成上下左右位置,这是失分点非常大的地方。朗阁海外考试研究中心的专家们提示烤鸭,空间表达时需要注意区分:在空间状语里,in表内部,on表接壤,to表分开。 常用的空间词: lies 靠近
雅思小作文必备词汇和句型 (基础版)
雅思小作文基础词汇句型 Yicheng 必备同义词替换: 展示,提供(首句谓语动词): show/ describe/ indicate/ illustrate/ provide 占百分之多少:Account for/ make up/ provide/ represent/ occupy … with… 趋势:trend/ tendency 数据:number/ data/ figure 百分比,比例:percentage/ proportion 类别:category / type/ kind/ group 然后:thereafter(替换then), after that e.g. Thereafter, the number of cases dropped slowly to about 2800 in September. 从前,过去:formerly (代替past) e.g. Many formerly inaccessible places are now reached by road and rail. 段落中的连接词: 同样的:likewise 同时:meanwhile 并且:moreover 但是:however,whereas 相反:conversely 相比之下:by comparison, in contrast, compared with sth, comparatively 四大趋势灵活表达总结:上升,下降,波动,不变
Task 1 的六大句型 (一) 开头段 The table / line graph / bar chart / pie chart / graph / chart shows / illustrates /describes / … 这个表格/ 曲线图/ 柱状图/ 饼图/ 图表/ 显示了… … (二) 描述“上升、下降、不变、波动” (各个对象在一段时间内进行变化) 1.There was / is / wil be a (+adj.) + n. in the number / percentage of A(数据+) 时间 A是对象的名字(图表中肯定有,照着写) n. 是表示“上升、下降、不变、波动”的名词 (1) 表示“增加(上升)”的名词increase / rise / growth / jump / surge / boom (2) 表示“减少(下降)”的名词decrease / decline / fall / reduction / drop / slump (3 )表示“波动”的名词fluctuation (4 )表示“不变”的名词no/little change adj.是形容词 (1 ) 表示“快速的,剧烈的,显著的”的形容词rapid/ sharp/ significant/ dramatic/ drastic (2 ) 表示“逐步的,适度的,稳定的,慢的,一点点的”的形容词Gradual / moderate / steady / slow
雅思小作文常用词汇短语例句同义词整理解析
小作文整理 过去past in times past 在过去; in past years/centuries/ages former in former times 从前; former glory/boss… old the old days; old school母校; old house 以前的房子previous 多用于虚物marriage earlier prior 多用于虚物arrangement/notcice preceding the years preceding……之前的几年 ancient 古代 现在current year current present, present day present situation; at the present time 目前existent 现行的存在的
Time In/around 1990 From 2009 onwards/backwards 2009年以前/以后Over the ten-year period between… In the following+时间 Since the early 1990s Preps Increase from 10 to 20 Reach a peak at/of/with … Drop by…, a decrease of…
雅思小作文模板句必备50句型 A 1.the table shows the changes in the number of...over the period from...to... 该表格描述了在...年之...年间...数量的变化。 2.the bar chart illustrates that... 该柱状图展示了... 3.the graph provides some interesting data regarding...该图为我们提供了有关...有趣数据。 4.the diagram shows (that)... 该图向我们展示了... 5.the pie graph depicts (that)....该圆形图揭示了... 6.this is a cure graph which describes the trend of...这个曲线图描述了...的趋势。 7.the figures/statistics show (that)... 数据(字)表明... 8.the tree diagram reveals how... 该树型图向我们揭示了如何... 9.the data/statistics show (that)... 该数据(字)可以这样理解... 10.the data/statistics/figures lead us to the conclusion that... 这些数据资料令我们得出结论... 11.as is shown/demonstrated/exhibited in the diagram/graph/chart/table...如图所示... 12.according to the chart/figures... 根据这些表(数字)... 13.as is shown in the table... 如表格所示... 14.as can be seen from the diagram, great changes have taken place in...从图中可以看发生 了巨大变化。...出, 15.from the table/chart/diagram/figure, we can see clearly that...or it is clear/apparent from the chart that... 从图表我们可以很清楚(明显)看到... 16.this is a graph which illustrates... 这个图表向我们展示了... 17.this table shows the changing proportion of a & b from...to... 该表格描述了...年到...年间a与b 的比例关系。 18.the graph, presented in a pie chart, shows the general trend in... 该图以圆形图形式描述了...总 的趋势。 19.this is a column chart showing... 这是个柱型图,描述了... 20.as can be seen from the graph, the two curves show the fluctuation of... 如图所示,两条曲线描述了...的波动情况。 21.over the period from...to...the...remained level. 在...至...期间,...基本不变。 22.in the year between...and... 在...年到...期间... 23.in the 3 years spanning from 1995 through 1998... 1995年至1998三年里... 24.from then on/from this time onwards...从那时起... 25.the number of...remained steady/stable from (month/year) to (month/year). ...月(年)至...月(年)...的数量基本不变。 26.the number sharply went up to... 数字急剧上升至... 27.the percentage of...stayed the same between...and... ...至...期间...的比率维持不变。 28.the figures peaked at...in(month/year) ...的数目在...月(年)达到顶点,为... 29.the percentage remained steady at... 比率维持在... 30.the percentage of...is sightly larger/smaller than that of... ...的比例比...的比例略高(低)。 31.there is not a great deal of difference between...and... ...与...的区别不大。 32.the graphs show a threefold increase in the number of... 该图表表明...的数目增长了三倍。 33....decreased year by year while...increased steadily. ...逐年减少,而...逐步上升。 34.the situation reached a peak(a high point at) of[%]. ...的情况(局势)到达顶(高)点,为...百分点。
雅思作文八分经典范文
雅思作文八分经典范文:环境、资源与交通问题 The unlimited use of cars may cause many problems.What are those problems?In order to reduce the problems,should we discourage people to use cars? The fast increase in the number of cars have brought along many related problems which are well worth our greatest attention. First of all,urban traffic is getting from bad to worse.I’d like to cite my own experience as an example.Five years ago,it took me about30minutes to drive from home to office.One year later,I needed to spend about40minutes on the way.Then two years later,I had to start out from home at least1hour earlier in order to get to my office on good time for work.And then,since last year,it has just been too normal for me to spend about one and half hours to make it.The traffic just moves like a worm! Second,with the ever growing number of cars,air quality in urban areas is deteriorating with each passing day.We used to see clear blue sky and breathe fresh air,but now this would be a real luxury.Car exhaust has seriously polluted the air and people’s health is greatly endangered.It seems certain that we human beings have already made a fatal mistake that could only be remedied by bringing down the number of cars hugely. Sure,we can not deny the fact that cars have brought us speed,comfort and greater mobility.However,these have already been history.We are suffering much more from cars than benefiting from them.Our health conditions are going down rapidly both due to the polluted air that we have to breathe every second and our lack of exercise as a result of the ever increasing amount of time we have to spend behind the wheel! What can we do?From the foregoing discussion,I’m sure we have already found a solution:to discourage people to use cars!I know very well that science and technology are also developing very fast and there might be better solutions coming up in the future,but, before that,let’s first salvage ourselves in such a passive way! 雅思写作八分经典作文:计算机的利与弊 Some people claim that public museums and art galleries will not be needed because people can see historical objects and works of art by using a computer.Do you agree or disagree with this opinion? It is simply absurd to assert that with historical objects and works of art being able to be
2016年10月8雅思考试小作文范文
Task:The table shows the energy production by different types of fuel in the UK 1 summarizing and selecting the main features 2 make the relevant comparisons Sample answer: The table provides information about the amount of energy produced by different kinds of fuel in the UK in three separate years. It is obvious that the UK relied more on traditional fuel (Natural Gas, Oil and Coal) to produce energy and the total production (around 220 units) was similar in three years. As for Natural Gas, the production increased from 76 units in 1990 to 94 units in 2000, which was the highest figure in across the period. The amounts of energy produced from oil and coal rose from 56 units and 22 units in 1990 to 70 units and 24 units in 1996 before decreasing to 60 and 23 units respectively. By contrast, the production of Nuclear power experienced an opposite trend, dropping from 40 units in 1990 to 30 units in 1996. However, by 2000, the
作文范文之雅思小作文真题
作文范文之雅思小作文真题
雅思小作文真题 【篇一:雅思作文题目汇总】 一、教育 1、教育应该包括哪些内容? 母题:it is generally believed that education is of vital importance to the development of individuals and the well-being of societies. what should education consist of to fulfil both these functions? (050312) 提示:本题围绕教育的两大功能来展开(个人与社会),准备好这篇文章,即可应付教育类话题中的最大分支—教育的功能,做到以不变应万变。对于社会角度,可以从促进经济发展、增加社会流动性(social mobility)、维护社会稳定这几个方面来展开,对于个人,可以写改变思维模式、有利于就业和便利生活来写。 子题:大学应当教授理论知识还是实践技能?大学的是应当把学生培养成合格的公民还是让他们自己得益?准备未来职业最好的方法是上大学还是尽快离校积累工作经验?大学要不要扩招?中学阶段应当提供通才教育还是专才教育?要不要延长义务教育年限?要不要让农村地区的学生更容易上学?老师要教学生如何判断是非吗? 2、学校的科目谁来选择?(060916) 母题:some people think that the government should decide which subjects students should study at the university, while others think that students should be allowed to apply for the subject they prefer. discuss the two views and give your opinion. 提示:这类题目采取的策略就是“双批判”,因为题目中提供的两种选择往往都是错误的。
雅思小作文必背词汇
常见曲线图变化趋势动词表达用名词作同义替换表达↑rose (to) a rise (in) increased (to) an increase (in) went up (to) a growth (in) climbed (to) an upward trend (in) boomed a boom in (a dramatic rise in) ↓fell (to) a decrease (in) decreased (to) a decline (in) dipped (to) dropped (to) a drop (in) went down (to) slumped (to) a slump in (dramatic fall in) reduced (to) a reduction (in) →levelled out (at) a levelling out (of) did not change remained stable (at) remained steady (at) stayed constant (at) maintained the same level no change (in) ↑↓fluctuated (around) peaked (at) plateaued (at) stood at (we use this phrase to focus on a particular point before we mention the movement, for example: in the first year, unemployment stood at...) a fluctuation (in) reached a peak (of) reached a plateau (at) 在曲线图中表示变化程度可以用到的词汇(degree of change)形容词副词dramatic dramatically sharp sharply huge hugely enormous enormously steep steeply substantial substantially considerable considerably significant significantly marked markedly moderate moderately slight slightly
经典雅思作文模板
1、From a more pragmatic standpoint, evidence abounds that A is still an indispensable part 从一个更务实的角度看,证据丰富,仍是一个必不可少的重要部分 2、In the first place, it goes without saying that ….. More exactly, …. 2 In the second place, ……。 3、However,I should admit that C still palys a pivotal role,The reason for this is that C…… 然而,我必须承认C还起到了举足轻重的作用,其原因是C…… 4、In summary, I would admit that C……. In spite of this, speaking for myself, I insist that…… 总之,我会承认C……。尽管如此,为自己说话,我坚持认为…… 5、This issue has widespread repercussion on society. 这个问题已经获得了广泛的社会影响。 6、Given the severity of this phenomenon, we have no alternative but to take immediate steps to address this situation. First, we must do our utmost to enhance people’s awareness of A . Second, We should spare no effort in doing sth. For instance. Lastly, C should strive to encourage D to do sth. 这一现象给予的严重性,我们别无选择,只能立即采取措施应对这种情况。首先,我们必须竭尽全力提高人们……的意识,第二,我们应该不遗余力的去做某事。例如……最后,我们应该努力鼓励D去做某事。 7、Since we have embraced upon information era, the way we live, work, play, and learn has undergone noticeable and profound transformation. Whether has been a breeding ground for heated debate. People from all walks of life can hardly reach on absolute consensus. For my part, my view will be identical with the advocates/opponents. 既然我们已经接受了在信息时代,我们的生活方式、工作、娱乐和学习经历了引人注目、深刻的变革。是否已孳生地为上演一场激烈的辩论。各行各业的人,很难找到完全的共识。至于我,我的观点将相同的提倡者/对手。 8、only under this circumstance can be establish a scientific, harmonious and progressive society. 只有在这种情况下,可以建立一个科学、和谐、进步的社会。
雅思写作高频词汇分类汇总+词性分类(完美打印版)
雅思写作高频词汇分类汇总雅思写作高频词汇分类汇总:媒体类 媒体类一: 1. paparazzi 狗仔队 2. mass media 大众媒体 3. entertainment 娱乐 4. journalism 新闻业 5. journal 期刊 6. the latest news 最新消息 7. exclusive news 独家新闻 8. news agency 新闻社 9. news blockout 新闻封锁 10. news censorship 新闻审查 11. freedom of the press 新闻自由 12. coverage 新闻报道 13. do reportage on …报导… 14. hit the headlines 上头条 15. issue 出版、发行 16. newsstand 报摊 17. free-lancer writer 自由撰稿人 18. chief editor 总编 19. editorial 社论 20. newsworthy 值得报道的 21. barometer 晴雨表 22. the barometer of public opinion 舆论的晴雨表 23. live broadcast 直播 24. quiz show 智力竞争节目 25. game show 游戏节目 26. variety show 综合节目 27. talk show 脱口秀 28. sitcom 情景喜剧 29. soap opera 肥皂剧 30. movie star 电影明星 31. movie king 影帝 32. movie queen 影后 33. affair 绯闻 34. celebrity 名人 35. fame 名声 36. rise to fame 声名鹊起 37. fan 粉丝 38. invade one's privacy 侵扰了…的隐私 39. misleading 误导性的 40. cheating 欺骗性的 41. popularity 知名度 42. scandal 丑闻 43. sensational 轰动的 44. prevalent 普遍的、流行的 45. imperative 重要的、必要的 46. audience ratings 收视率 47. propaganda 宣传 48. be abducted by 受…诱导 49. purify one's soul 净化心灵 50. live in virtual would 生活在一个虚拟世界中 51. be a great comfort to somebody 对…来说是一个巨 大安慰 52. meet different tastes 满足不同口味 53. provide somebody with something 给…提供… 54. follow the fashion blindly 盲目追逐时尚 55. commit crimes 犯罪 56. be inconceivable to somebody 对…来说是难以想 象的 57. impressive 给人印象深刻的 58. right to know 知情权 59. in the disguise of …打着…的幌子 60. endanger social stability and safety 危害社会稳定 和安全 媒体类二(影视类) 1. information era 信息时代 2. keep one informed about something 使人们了解… 3. audience/viewers 观众 4. have unhealthy and harmful effects on…对…有不良 影响 5. information-explosion society 信息爆炸的社会 6. influential 有影响的 7. revolutionize the way we acquire information 彻底 改变了我们获取信息的方式 8. blessing 福 9. curse 祸 10. various thrilling programs 各种各样激动人心的节 目 11. poor-quality programs 低质量节目 12. ever-accelerated 不断发展的 13. exaggerate 夸张 14. enjoyable 令人享受的 15. fashionable 时尚的 - 1 -
雅思小作文常用表达词语汇总
雅思小作文常用表达词语汇总 想要雅思小作文写得好,客观准确的表达方式是必不可少的。熟练运用各种句型,还能为大作文争取更多的时间。小编再为大家把相关句型整理一遍,快记下来吧!这次为备考雅思的同学介绍雅思小作文的常用词汇。 1. 雅思小作文开头 图表类型:table;chart;diagram;graph;column chart;pie graph 描述:show;describe;illustrate;can be seen from;clear;apparent;reveal;represent 内容:figure;statistic;number;percentage;proportion 2. 雅思小作文表示数据 最高(低)点:peaked;reached a peak/high point bottomed out;reached the bottom 变化:recover 略有回升; increase;jump;rise/rose;climb上升 decrease;fall;drop;decline;reduce下降 fluctuate 浮动,摇摆不定 remained steady/stable;stay the same;little/hardly any /no change稳定
雅思小作文描述变化程度: sudden/suddenly 突然的,意外的 rapid/rapidly 迅速的,飞快的,险峻的 dramatic/dramatically 戏剧性的,生动的 3. 其它在描述中常用到的词 in the case of adv. 在...的情况下 in terms of/in respect of/regarding 在...方面 in contrast 相反,大不相同 in conclusion adv. 最后,总之 in comparison 相比之下 inversely adv. 相反地,倒转地 in general 通常,大体上,一般而言 range from 从…到… excessive adj. 过多的,过分的,额外 lower v. 降低,跌落 小作文的常用词就为大家介绍到这,更多雅思小作文写作方法。我们一起努力,备考雅思!