雅思写作小作文表格图实例分析

雅思写作小作文表格图实例分析
朗阁雅思培训中心
表格图是雅思写作小作文中常考图形之一,也是烤鸭们在备考时必须要准备的一类题型。那么烤鸭们具体应该如何准备表格图呢?下面,朗阁雅思培训中心的专家将以一道具体的实例,就这一题型的解题思路和步骤做出详尽的分析和解答。
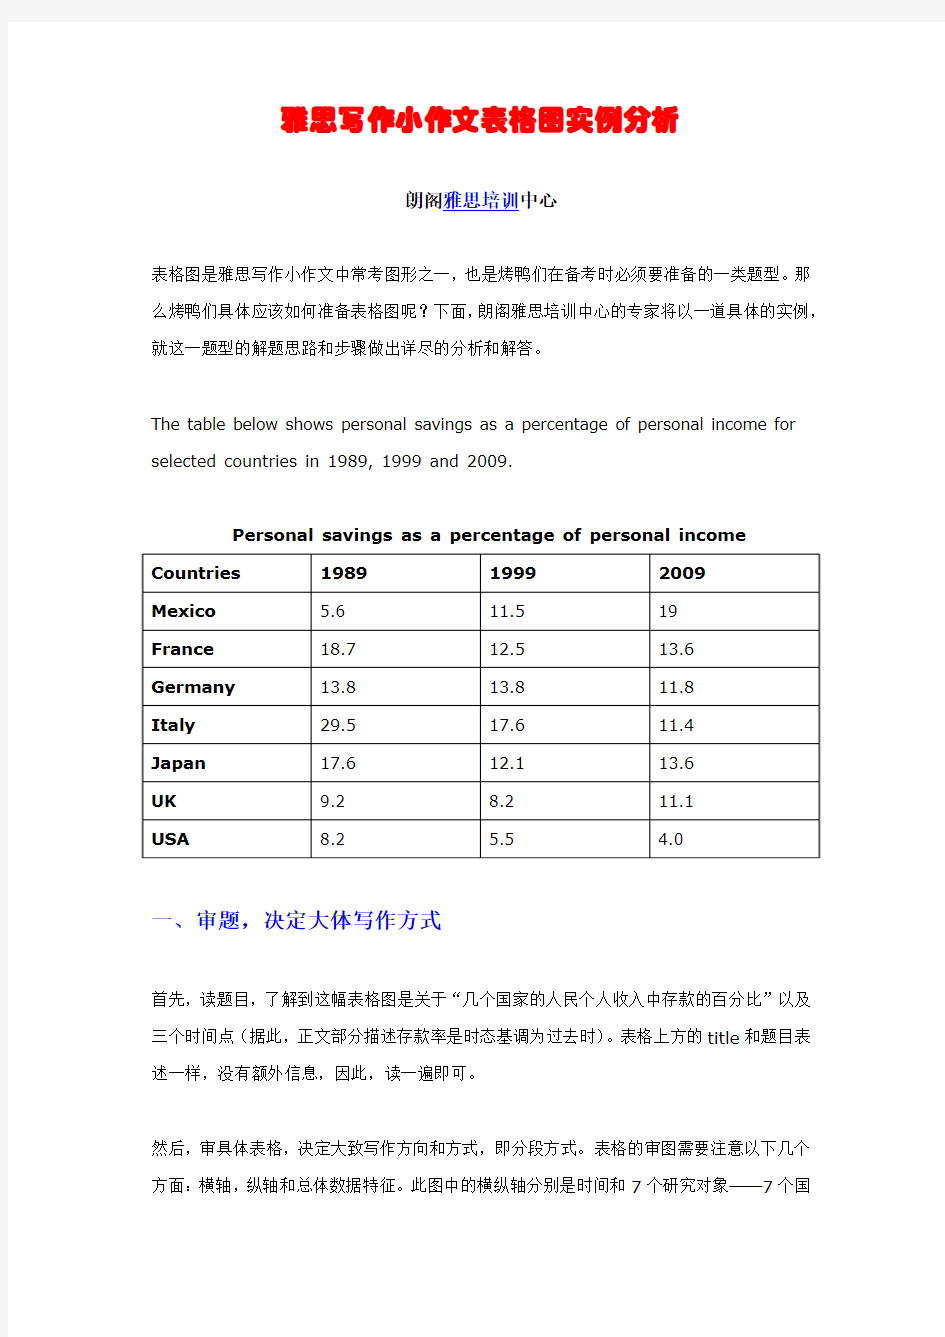
The table below shows personal savings as a percentage of personal income for selected countries in 1989, 1999 and 2009.
Personal savings as a percentage of personal income
一、审题,决定大体写作方式
首先,读题目,了解到这幅表格图是关于“几个国家的人民个人收入中存款的百分比”以及三个时间点(据此,正文部分描述存款率是时态基调为过去时)。表格上方的title和题目表述一样,没有额外信息,因此,读一遍即可。
然后,审具体表格,决定大致写作方向和方式,即分段方式。表格的审图需要注意以下几个方面:横轴,纵轴和总体数据特征。此图中的横纵轴分别是时间和7个研究对象——7个国
家。横纵轴中间有一栏为时间,那说明,此图原则上应该按曲线图原理来写——即,描述7个国家存款率上升或下降趋势;但是,经过下一步对表格中数据总体特征的总结发现:7个国家的存款率在这一段时间内总体呈现下降趋势。这一发现说明,如果继续按照曲线图原理描述,文章会非常单调,而且对比的空间也不大;相反,同一年份里,几个国家之间的差距很大。因此,正文部分应该按时间分成三个段落,对比同一时间内,7个国家之间的存款率的高低。
最后,审题的最后一关是总结表格中数据的明显特征。正文主要是从时间角度,纵向对比几个国家。但是,我们同时也需要反方向观察和对比,也就是,几个国家内部不同时间内存款率的起伏。我们发现,正如以上提到的一样,7个国家的存款率在这一段时间内总体呈现下降趋势。
二、文章各部分的写作分析
小作文的基本结构包括三部分:开头段,正文和结尾段。
首先,开头段落的写作方式相对比较简单——介绍接下来即将描述的是什么内容,即,改写题目。具体可以通过近义词,修改句子结构,加信息等方法实现,如:
The table shows the proportion of personal income put aside as savings in seven different countries in 1989, 1999 and 2009.
正文第一段描述1989年7个国家的存款率情况。Italy的最高,应作为第一个介绍对象单独说明。Mexico的最低,也应该提及。剩下的五个城市的数据无需一一提及,可挑选一两个相对较重要的数据做代表,通过“followed by...”等表示排序的句型进行介绍。同时,一定注意句子与句子之间的连贯性。如:
According to the table, in 1989, Italy had the highest savings rate of 29.5%, followed by France with 18.7% and Japan with 17.6%. However, Mexico had the
lowest rate—only 5.6%.
正文第二段对比第二个年份1999年几个国家的存款率。最先描述的数据可以是这一年最大的数据,也可以为了和1989年对比先介绍89年排名第一的国家。碰巧,此图中Italy既是99年最大值也是89年最大值,所以,先介绍意大利。同上,最低和中间数据的代表也应提及。应该注意的是,此时,99年的数据,尤其是和89年比变化大的,应该适当和89年进行比较。如:
By 1999, Italy was still the leading country, though its saving rate had dropped to 17.6%. Germany was next with 13.8%(same as that in 1989) , and the rates in France and Japan were close behind. In Mexico, the savings rate had almost doubled to 11.5%. By contrast, the UK and the USA had the lowest rates, with 8.2% and 5.5% respectively.
正文第三段写作方式同正文第二段,重点纵向对比国家间比例,同时注意和前一年数据的比较。比方说:
In 2009, the savings rates leveled out considerably across the seven countries, with France and Japan leading with 13.6%, followed by Germany, Italy and the UK at around 11%. Personal savings in North America dropped sharply, with the USA at 4% and Mexico at a very low 1.9%.
最后,结尾段总结该表格的明显特征,即7个国家的存款率在这一段时间内总体呈现下降趋势。
Overall, the proportion of income as savings in these countries, generally speaking, declined over this thirty-year period.
三、检查
落笔成文后,如时间允许的话,还可以进行快速的检查,查看是否有重要数据的遗漏、时态错误、单词错误拼写等小问题,尤其是平时练习中经常犯的错误。
总而言之,表格图的写作并非难事,考生们只需要按照上例顺序,了解图形特征,掌握表格类型,积累表达手段,注意连贯性和表达准确性,相信一篇出色的表格图作文应该是不成问题的。最后,朗阁雅思培训中心祝广大考生考出雅思好成绩。
雅思写作-小作文范文-柱状图
雅思经典小作文柱状图4篇范文+写作要点分析 C1T3 题目 The chart below shows the amount of money per week spent on fast foods in Britain. The graph shows the trends in consumption of fast foods. Write a report a university lecturer describing the information shown below. The chart shows that high income earners consumed considerably more fast foods than the other income groups, spending more than twice as much on hamburgers (43 pence per person per week) than on fish and chips or pizza (both under 20 pence). Average income earners also favored hamburgers, spending 33 pence per person per week, followed by fish and chips at 24 pence, then pizza at 11 pence. Low income earners appear to spend less than other income groups on fast foods, though fish and chip remains their most popular fast food, followed by
(完整版)剑桥雅思小作文表格及其他类的写法归纳
【表格的写法】 开头段: 中间段:1. 分析“行” 2. 分析“列” 结尾段:重述或补充说明总体特征(也可不写) *在描写行和列时注意避免重复,后写的可以概括一些 The table gives a breakdown of the different marriage figures in the UK during a long period from 1950 to 2000. The number of first marriages was 330 thousand in 1950, increasing steadily for the following two decades and peaking at 389 thousand in 1970. However, from then on, it experienced a sharp fall to 180 thousand in 2000, the lowest of the whole period. Similarly, the number of re-marriages had generally increased from 78 thousand in 1950 to a peak of 140 thousand in 1980, though its lowest point (58,000) was reached in 1960. The following decade from 1990 to 2000 witnessed an insignificant decrease to 126,000. Since marriages are a sum of first marriages and re-marriages, it can e clearly seen that the trend of marriage saw an overall slump, with its record low (306,000) in 2000, about a third less than its peak (471,000) in 1970
2019年雅思写作小作文流程图解析及范文:废纸回收
2019年雅思写作小作文流程图解析及范文:废纸回收 The chart below shows the process of waste paper recycling. 范文: The flow chart shows how waste paper is recycled. It is clear that there are six distinct stages in this process, from the initial collection of waste paper to the eventual production of usable paper. At the first stage in the paper recycling process, waste paper is collected either from paper banks, where members of the public leave their used paper, or directly from businesses. This paper is then sorted by hand and separated according to its grade, with any paper that is not suitable for recycling being removed. Next, the graded paper is transported to a paper mill. Stages four and five of the process both involve cleaning. The paper is cleaned and pulped, and foreign objects such as staples are taken out. Following this, all remnants of ink and glue are removed from the paper at the de-inking stage. Finally, the pulp can be processed in a paper making machine, which makes the end product: usable paper. (160 words, band 9)
雅思写作小作文范文118篇之范文14
雅思写作小作文范文118篇之范文14 以下是三立在线雅思网给大家分享的雅思写作小作文范文118篇:范文14。希望对大家的雅思备考有所帮助,更多雅思备考资料欢迎大家随时关注三立在线雅思网。 范文14 The computer is widely used in education,and some people think teachers do not play important roles in the classroom. To what extend do you agree or disagree? In this period of communication,computer has been used in all kinds of fields widely, and plays a particular role in our lives. Especially computer has become more and more important in educational field, therefore dozens of people considered teachers could be replaced computers that will go with the current of the times. The above point is certainly wrong; this essay will outline three reasons. The main reason is that people’s brain better than computer. Firstly, people design all kinds of computer’s programs. Secondly, computer doesn’t have logistic ideation. Computer only can defend on that designer inputted computer’s programs to judge a question’s right or wrong. In other words, computer can’t defend on thinking that computer independently analyzes a question’s right or wrong. In case, designer inputted programs that are wrong. Computer output the result that also will be wrong. If this kind of problem happened in classroom, students would be infused plenty of wrong information.
雅思小作文之图表作文
二.雅思图表作文 1.企业垃圾(线性图) 题目:The graph below shows the amounts of waste produced by three companies over a period of 15 years. 范文:The line graph compares three companies in terms of their waste output between the years 2000 and 2015. It is clear that there were significant changes in the amounts of waste produced by all three companies shown on the graph. While companies A and B saw waste output fall over the 15-year period, the amount of waste produced by company C increased considerably. In 2000, company A produced 12 tonnes of waste, while companies B and C produced around 8 tonnes and 4 tonnes of waste material respectively. Over the following 5 years, the waste output of companies B and C rose by around 2 tonnes, but the figure for company A fell by approximately 1 tonne. From 2005 to 2015, company A cut waste production by roughly 3 tonnes, and company B reduced its waste by around 7 tonnes. By contrast, company C saw an increase
雅思流程图写作指引
流程图 流程图6点参考要领: 1. 找到流程图的过程,起点,终点。 2. 找到图上标出的已知动作,如果出现生词,尽量猜测。无词,用自己的语言。 3. 按照步骤,分段描述,千万不能省略任何一步。 4. 切记!加入流畅合理的表示顺序的关联词。 5. 句型以主动为主,搭配被动,以及主语从句(例如:It can be seen from the graph that…)。 6. 时态要使用一般现在时。 例文分析1: The diagram shows the stages in the process of making chocolate.(所有的小作文第一句话都要用一般现在时。流程图必备三个词:process整个过程;stage阶段;step步骤)
Chocolate comes from the cacao tree, which is grown in parts of South America, Africa and Indonesia.(开头不能一上来就直接介绍cacao tree,而是通过主题词chocolate 引出,否则显得太唐突)【流程图特点之一:介绍过程要使用一般现在时】【流程图特点之二:大量使用定语从句,将有关联的两句话连接。】【流程图特点之三:大量使用被动语态】The tree produces large red pods which contain white cocoa beans.【流程图特点之四:使用一些表示顺序的连接词】when the pods are ripe, they are harvested, the beans are removed and they are fermented for several days in large wooden boxes.(三个句子的并列:“句子A,句子B and 句子C”。)During the fermenting process, the beans turn brown.【流程图特点之五:要适当地添加个别图中没有交代但能从图片中直接读出来的一些内容,否则可能达不到字数要求。但是一定要把握尺度,千万不要加上自己的主观观点,否则会扣分】 Next, the brown beans are spread in the sun to dry. They are then put in large sacks and transported by train or lorry. After this, the beans are taken to a chocolate factory where they are roasted in an oven at temperatures of between 250 and 350 degree Celsius. After being roasted, the beans are crushed and the outer shell is removed. This part is not needed for making chocolate. Finally, the inner part of the bean is pressed and liquid chocolate is produced.【流程图特点之六:一般不需要写总结】 例文分析2:
雅思小作文之流程图范文
You should spend about 20 minutes on this task. The diagram below shows the method of obtaining water outdoors. You should write at least 150 words. 1. The chart describes how water is obtained outdoors. 2. According to the figure, the first step of obtaining water outdoors is to find a hole with green plants on its bottom. Next, remove the green plants in the middle and put a container there. Then, cover the hole with a plastic sheet and place two stones on
both ends of it to secure its position. A third stone is laid on the middle of the plastic sheet so that the middle part is also the lowest part. 3. When the sun shines on the green plants in the hole, water evaporates from these plants. The vapor rises up and then cools down to form water drops on the plastic sheet. When there is more and more water, it flows along the sheet to accumulate on the lowest part. Finally, water falls down into the container directly under the middle stone. Thus, water is collected successfully through evaporation from green plants. 流程图的重点: 1.平时的格式 As is displayed in the flow chart, the process/principle, etc of _____ can be explained/ analyzed/ specified as follows. There are ____stages in ______. First, Second, Next Last/Finally/In the end (Thus, the new circle begins.) As to/for, As far as …is concerned In respect/aspect of, in approach to, in regard to
作文范文之雅思小作文table
作文范文之雅思小作文table
雅思小作文table 【篇一:雅思小作文表格图实例分析】 雅思小作文表格图实例分析 朗阁海外考试研究中心 表格图是雅思小作文的常考图形之一,也是烤鸭们在备考时必须要准备的一类题型。那么烤鸭们具体应该如何准备表格图呢?下面,朗阁海外考试研究中心的专家将以一道具体的实例,就这一题型的解题思路和步骤做出详尽的分析和解答。 the table below shows personal savings as a percentage of personal income for selected countries in 1989, 1999 and 2009. personal savings as a percentage of personal income 一、审题,决定大体写作方式 首先,读题目,了解到这幅表格图是关于“几个国家的人民个人收入中存款的百分比”以及三个时间点(据此,正文部分描述存款率是时态基调为过去时)。表格上方的title和题目表述一样,没有额外信息,因此,读一遍即可。 然后,审具体表格,决定大致写作方向和方式,即分段方式。表格的审图需要注意以下几个方面:横轴,纵轴和总体数据特征。此图中的横纵轴分别是时间和7个研究对象——7个国 家。横纵轴中间有一栏为时间,那说明,此图原则上应该按曲线图原理来写——即,描述7个国家存款率上升或下降趋势;但是,经过下一步对表格中数据总体特征的总结发现:7个国家的存款率在这一段时间内总体呈现下降趋势。这一发现说明,如果继续按照曲线图原理描述,文章会非常单调,而且对比的空间也不大;相反,同一年份里,
2020雅思小作文流程图的写作方法
2020雅思小作文流程图的写作方法 雅思写作考试中的Task1小有三种题型:图表,流程图和地图。考生们备考时多把注意力放在图表题,对后两类题目准备不足甚至无准备,一旦真遇到了流程图和地图,往往束手无策,凭自己的直觉应付写一下,凑够字数交差。流程图和地图题的写作是有一定的方法的,按照方法来写,其实并不难,在本文中,先来探讨流程图作文的写作。 题目给出的是流程图,就是以图示的方法把一个过程或流程清楚地显示了出来,现在要求考生做的是把该流程图还原成说明文。由此可见,我们实际上要做的就是看图作文。而大家都知道,看图作文是我们在小学最初学写作文时的入门做法。照着图来写,省却了要自己想象和构思的过程,这自然比起写议论文的挑战度要低一些。所以,大家应该更有信心去对付流程图作文,毕竟实际上所做的是“看图作文”。 流程图作文是以对流程的描述为主的。全文的安排通常分为两个主要部分:引言段和主体部分。引言段是用来作简介的,介绍该流程图表示了一个什么什么的过程,常用的句型为主语+谓语+宾语模式。然后视情况可以多加一句说整个过程可以分为若干个阶段。引言段只需一段,通常就是这么一二句话。
主体部分是文章的核心部分,主要是说明该流程,所以是说明文式的行文。主体部分可依照整个流程分成几个阶段而大体相应地分为几个自然段。主体部分的写作原则如下: 这是首要前提,理解了流程图表示的是什么以及是怎样的一个过程,才谈得上用文字表达出来。能否看得懂图取决于几方面的因素:词汇量,知识面,生活经验和常识等。考生平时要有心地做一下这些方面的积累和准备。一般来说,流程图是不难看懂的。万一有些什么地方卡住了,也要大胆地合乎逻辑地去猜测,推想,判断,要灵活机敏。 流程图会表示一个过程的流向顺序。因此,不难按照图示的顺序来写。若是分成几个阶段的,就按顺序逐个阶段来描述,通常就相应地分成几个自然段落。 流程图中会提供一些关键的说明性的词,比如步骤或环节的名称,怎样做,添加什么原料,去掉什么,输送到哪儿等等。我们就可以直接利用这些关键词写成句子,方法有两类,依照图的情况而分别采用之。如果流程图比较简短,用扩展的办法,就是以一个关键词为核心词,扩展成一个甚至两个句子,以达到字数的要求。反之,若图比较长而复杂,就采用串的办法,一句话把两个甚至三个步骤串起来,这样可以把较长的过程压缩得短一些来描述。无论用
雅思小作文范文--流程图写作详解!
流程图写作雅思小作文范文 今天我们就利用一篇经典的考官的雅思小作文范文,来向同学们展示一下关于令大家非常头疼的流程图的写作带给我们的启示:流程图其实一点都不难,掌握好了其中的语法知识点,我们甚至可以拿高分。 雅思写作中,和它联系最为紧密的就是语法。雅思写作四项评分中,语法作为重中之重被提及。语法基础不好,难有好作文的形成。如果一篇英语作文中反复出现低级的语法错误,那么无论你的观点多么吸引人,原本的写作立意多么新颖精彩,生产的都只是一篇有缺陷的英语作文,多会让阅读者对你文章的整体印象打折扣:-一个连基础语法都错误连连的作者,会有能力写出一篇思维严谨的作文吗? 读题分析:由于蚕的生命旅程并不是哪一个特定时刻发生的事情,而是一个公认的自然常识。它是作为一个流程而时时刻刻都在发生的事情,因此采用时态中的一般现在时来表达整篇文字就是最适合不过了 考官范文: The first diagram shows that there are four main stages in the life of the silkworm. First of all, eggs are produced by the moth and it takes ten days for each egg to become a silkworm larva that feeds on mulberry leaves. This stage lasts for
up to 6 weeks until the larva produces a cocoon of silk thread around itself. After a period of about 3 weeks, the adult moths eventually emerge from these cocoons and the life cycle begins again. 详细分析: 一、首先准备流程图的写作时,先考虑一下文章结构的完整。好的文章一般都是“总-分-总”结构,所以看看此文章的开头:The first diagram shows that there are four main stages in the life of the silkworm。这样的开头很符合文章“总起”的结构,所以宾语从句在小作文的开头一般不可少,the first diagram是主语,shows是谓语,that是连接词,而后面的内容都是shows的宾语,因此宾语从句是大家可以利用的开头句型,既简洁又有力。 另外,一定要尽量使用到三大从句来给你的作文增添光彩,刚刚已经讲完宾语从句,另二种复杂句则分别出现在:”…a silkworm larva that feeds on mulberry leaves”句子由that引导的定语从句和由until引导的”This stage lasts for up to 6 weeks until the larva produces a cocoon of silk thread around itself”时间状语从句这两个部分。定语从句能够使得你想表述的对象“silkworm larva”更加具体形象,而状语从句则是可以展现出流程图中时间结构的法宝。 二、There are four main stages…典型的there be 结构,可以说是雅思小作文写作中的一个法宝。只要带有了there be句型,文章就显得非常客观。比如下面这个句型就是
雅思小作文模板句必备50句型+
雅思小作文模板句必备50句型 A 1.the table shows the changes in the number of...over the period from...to... 该表格描述了在...年之...年间...数量的变化。 2.the bar chart illustrates that... 该柱状图展示了... 3.the graph provides some interesting data regarding... 该图为我们提供了有关...有趣数据。 4.the diagram shows (that)... 该图向我们展示了... 5.the pie graph depicts (that).... 该圆形图揭示了... 6.this is a cure graph which describes the trend of... 这个曲线图描述了...的趋势。 7.the figures/statistics show (that)... 数据(字)表明... 8.the tree diagram reveals how... 该树型图向我们揭示了如何... 9.the data/statistics show (that)... 该数据(字)可以这样理解... 10.the data/statistics/figures lead us to the conclusion that... 这些数据资料令我们得出结论... 11.as is shown/demonstrated/exhibited in the diagram/graph/chart/table... 如图所示... 12.according to the chart/figures... 根据这些表(数字)... 13.as is shown in the table... 如表格所示... 14.as can be seen from the diagram, great changes have taken place in... 从图中可以看出,...发生了巨大变化。 15.from the table/chart/diagram/figure, we can see clearly that...or it is clear/apparent from the chart that... 从图表我们可以很清楚(明显)看到... 16.this is a graph which illustrates... 这个图表向我们展示了... 17.this table shows the changing proportion of a & b from...to... 该表格描述了...年到...年间a与b的比例关系。 18.the graph, presented in a pie chart, shows the general trend in... 该图以圆形图形式描述了...总的趋势。 19.this is a column chart showing... 这是个柱型图,描述了...
雅思小作文流程图的写作方法
雅思小作文流程图的写作方法 导读:题目给出的是流程图,就是以图示的方法把一个过程或流程清楚地显示了出来,现在要求考生做的是把该流程图还原成说明文。由此可见,我们实际上要做的就是看图作文。而大家都知道,看图作文是我们在小学最初学写作文时的入门做法。照着图来写,省却了要自己想象和构思的过程,这自然比起写议论文的挑战度要低一些。所以,大家应该更有信心去对付流程图作文,毕竟实际上所做的是“看图作文”。 流程图写作基本原则 流程图作文是以对流程的描述为主的。全文的安排通常分为两个主要部分:引言段和主体部分。引言段是用来作简介的,介绍该流程图表示了一个什么什么的过程,常用的句型为主语+谓语+宾语模式。然后视情况可以多加一句说整个过程可以分为若干个阶段。引言段只需一段,通常就是这么一二句话。 主体部分是文章的核心部分,主要是说明该流程,所以是说明文式的行文。主体部分可依照整个流程分成几个阶段而大体相应地分为几个自然段。主体部分的写作原则如下: 1. 把图看懂 这是首要前提,理解了流程图表示的是什么以及是怎样的一个过程,才谈得上用文字表达出来。能否看得懂图取决于几方面的因素:词汇量,知识面,生活经验和常识等。考生平时要有心地做一下这些
方面的积累和准备。一般来说,流程图是不难看懂的。万一有些什么地方卡住了,也要大胆地合乎逻辑地去猜测,推想,判断,要灵活机敏。 2. 按图示的顺序写 流程图会表示一个过程的流向顺序。因此,不难按照图示的顺序来写。若是分成几个阶段的,就按顺序逐个阶段来描述,通常就相应地分成几个自然段落。 3. 将图所提供的词扩展(或串)成句子 流程图中会提供一些关键的说明性的词,比如步骤或环节的名称,怎样做,添加什么原料,去掉什么,输送到哪儿等等。我们就可以直接利用这些关键词写成句子,方法有两类,依照图的情况而分别采用之。如果流程图比较简短,用扩展的办法,就是以一个关键词为核心词,扩展成一个甚至两个句子,以达到字数的要求。反之,若图比较长而复杂,就采用串的办法,一句话把两个甚至三个步骤串起来,这样可以把较长的过程压缩得短一些来描述。无论用哪一种方法,都要利用流程图上所给出的'词,这是图提供给我们的方便,要充分利用。在读懂图的基础上,再有这些关键词的帮助,这篇作文就不难写出来了。整篇文章字数要求是150字,图中给出的词往往就占了将近三分之一,考生要写的就只是余下的三分之二左右了。 4. 主体部分的句子多用被动语态 流程图说明文的特点是多用被动语态,主要是指主体部分对过程
2011雅思小作文 最全万能模板
2011雅思小作文写作万能模板 1、通过第一个曲线图,我们可以知道____,也说明了结果是___ According to the first graph, it can be seen that ______________, it can also be concluded from it that ______________. 2、一张有趣、有教育意义的、(内容)的图片(这句模板在雅思小作文中的应用非常的广泛。) There is an interesting and instructive picture which goes like this: __________. 3、当前有一张涉及______的增长曲线图,许多人______,然而其他人倾向于___ Nowadays there is a growing concern over ______________. Many people like ______________, while others are inclined to ______________. 4、目前,共同之处是_________,许多人喜欢______因为_______除此之外还由于_____ Nowadays, it is common to ______________. Many people like______________ because ______________. Besides, ______________. 5、(图表所示)_____,就像许多其他事物,被____更加喜爱,然而这一观点正被________所抨击,一些人认为_________,他们指出___________ ______________, just like many other things, are preferred by ____________. While being attacked by the idea that ______________, some people consider ______________. They point that ______________. 6、每种事物都有两面性和________,是没有异议的,包括利和弊 Everything has two sides and ______________ is not an exception, it has both advantages and disadvantages. 7、_____作为_____被观察了许多年,但是人们现在像发现新大陆一样注视着它 For years ______________ had been viewed as ______________. But people are taking a fresh look at it now. 8、政府保证________,对于这份保证,大多数人做出了强烈地回应,因为_____ It has stipulated by the government that ______________. To this stipulation, many people respond actively because ______________. 9、_______出现在我们日常生活中是很平常的,无论我们做什么,_______都是不可避免的______________ is a common occurrence in our daily life. Whatever we do, ______________ can't be avoided. 10、_____在人群中已经成为热门话题,特别是在年轻人中,激烈的争论无休止______________ has become a hot topic among people, especially among the young, and heated debates are right on their way. 1 according to the chart```
雅思流程图写作技巧心得
The illustrations below show how chocolate is produced. Summarise the informaiton by selecting and reporting the main features. 【高分范文点评】 The diagram shows the stages in the process of making chocolate.【所有的小作文第一句话都要用一般现在时。流程图必备三个词:process:整个过程, stage:阶段,step:步骤】 Chocolate comes from the cacao tree, which is grown in parts of South America, Africa and Indonesia.【开头不能冲上来就直接介绍cacao tree,而是通过主题词chocolate引出,否则显得太唐突】【流程图特点之一:介绍过程要使用一般现在时】【流程图特点之二:大量使用定语从句,将有关联的两句话连接。】【流程图特点之三:大量使用被动语态】The tree produces large red pods which contain white cocoa beans. Firstly,【流程图特点之四:使用一些表示顺序的连接词】when the pods are ripe, they are harvested, the beans are removed and they are fermented for several days in large wooden boxes.【三个句子的并列:“句子A,句子B and句子C”。】During the fermenting process, the beans turn brown.【流程图特点之五:要适当地添加个别图中没有交代但能从图片中直接读出来的的
剑桥英语10雅思考官范文(大作文+小作文)
剑桥英语10雅思考官范文(大作文+小作文)
剑10 1-2 It is important for children to learn the difference between right and wrong at an early age. Punishment is necessary to help them learn this distinction. To what extent do you agree or disagree with this opinion? What sort of punishment should parents and teachers be allowed to use to teach good behavior to children? One important stage in a child’s growth is certainly the development of a conscience, which is linked to the ability to tell right from wrong. This skill comes with time and good parenting, and my firm conviction is that punishment does not have much of a role to play in this. Therefore I have to disagree almost entirely with the given statement. To some extent the question depends on the age of the child. To punish a very young child is both wrong and foolish, as an infant will not understand what is happening or why he or she is being punished. Once the age of reason is reached however, a child can be rewarded for good behavior and discouraged from bad. This kind but firm approach will achieve more than harsh punishments, which might entail many negative consequences unintended by the parents. To help a child learn the difference between right and wrong, teachers and parents should firstly provide good role modelling in their own behavior. After that, if sanctions are needed, the punishment should not be of a physical nature, as that merely sends the message that it is acceptable for larger people to hit smaller ones-an outcome which may well result in the child starting to bully others. Nor should the punishment be in any way cruel.
雅思写作批改--小作文范例2
Many women need to continue working even after they have children. The charts below show the working patterns of mothers with young children to care for. Summarise the information by selecting and reporting the main features and make comparisons where relevant. The pie charts illustrate the working profile of mother with dependent children in different age range. There are three kinds of working pattern: not working, working part-time and working full time. It is clearly from the picture that the younger the youngest dependent child, the more mothers are apt to be not taking a job. With dependent child under 2 years old, 70% of mothers are not working while for mothers of children older than 10 years old, only 26% of them do not have a job. (差距最大的not working) In comparison, more mothers with older children tend to work part time. Only 19% of them with younger than 2 years old kids prefer part time job while after their children develop to 5 years old and extend, about half of them are able to work part time. Situation of full time working mother is similar but with a difference that 29% of mothers tend to work full time only after their children grow to 10 years old, while before that, only about one tenth of them would like to do full time job. To recall, before fifth birthday of their children, most mothers tend to not work or take part time job, while after that, most of them are apt to work part time.