MAtlab傅里叶变换实验报告


班级信工142 学号22 姓名何岩实验组别
实验日期室温报告日期成绩
报告内容:(目得与要求,原理,步骤,数据,计算,小结等)
1、求信号得离散时间傅立叶变换并分析其周期性与对称性;
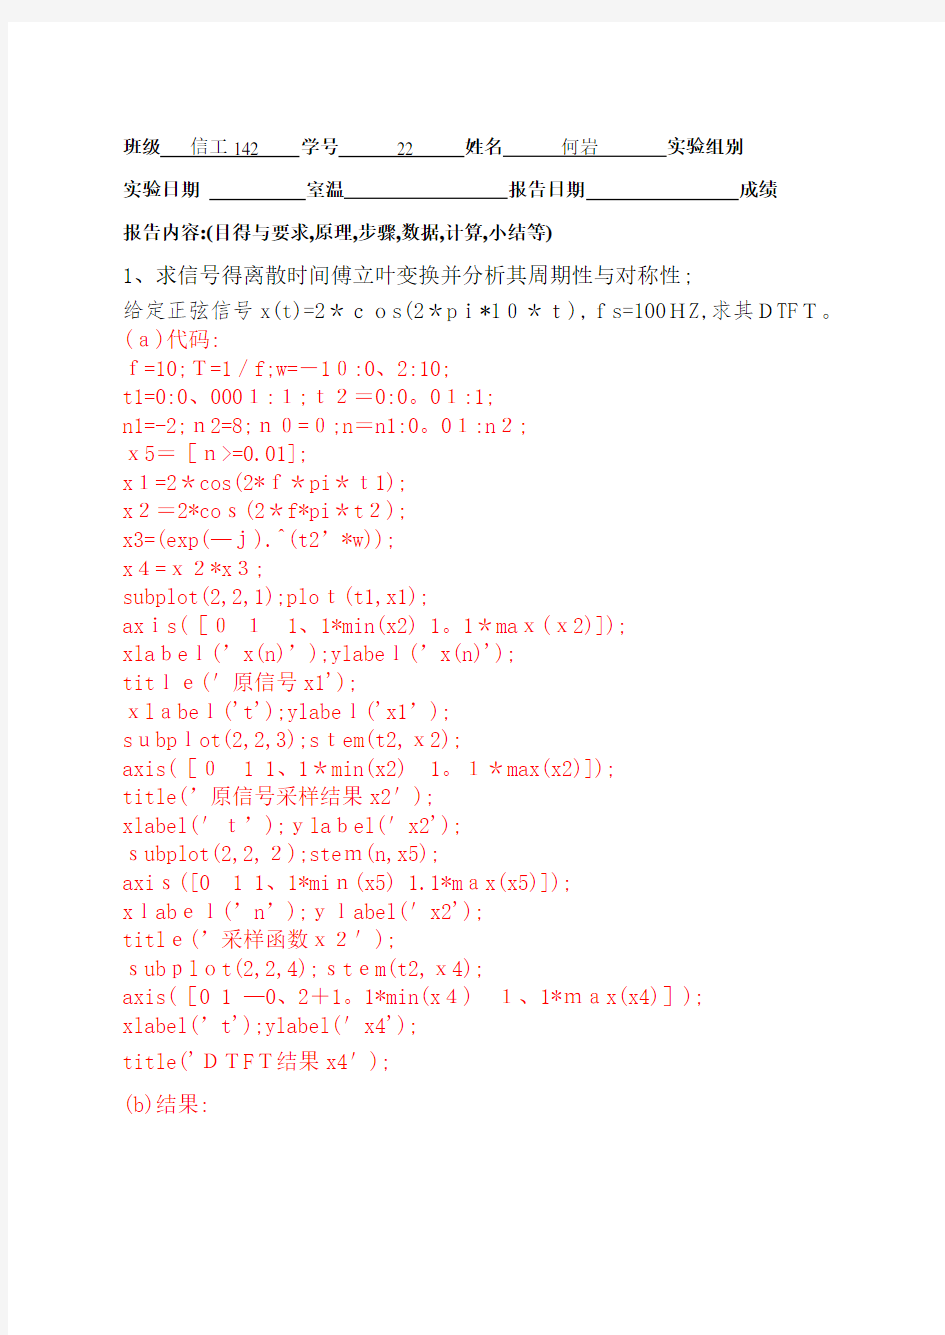
给定正弦信号x(t)=2*cos(2*pi*10*t),fs=100HZ,求其DTFT。(a)代码:
f=10;T=1/f;w=-10:0、2:10;
t1=0:0、0001:1;t2=0:0。01:1;
n1=-2;n2=8;n0=0;n=n1:0。01:n2;
x5=[n>=0.01];
x1=2*cos(2*f*pi*t1);
x2=2*cos(2*f*pi*t2);
x3=(exp(—j).^(t2’*w));
x4=x2*x3;
subplot(2,2,1);plot(t1,x1);
axis([011、1*min(x2) 1。1*max(x2)]);
xlabel(’x(n)’);ylabel(’x(n)');
title('原信号x1');
xlabel('t');ylabel('x1’);
subplot(2,2,3);stem(t2,x2);
axis([0 1 1、1*min(x2) 1。1*max(x2)]);
title(’原信号采样结果x2');
xlabel('t’);ylabel('x2');
subplot(2,2,2);stem(n,x5);
axis([0 1 1、1*min(x5) 1.1*max(x5)]);
xlabel(’n’);ylabel('x2');
title(’采样函数x2');
subplot(2,2,4);stem(t2,x4);
axis([0 1 —0、2+1。1*min(x4) 1、1*max(x4)]);
xlabel(’t');ylabel('x4');
title('DTFT结果x4');
(b)结果:
2、用以下两个有限长序列来验证DTFT得线性、卷积与共轭特性;
(n)
x1(n)=[12 3 4 5 6 7 8 9 10 11 12];x2(n)=R
10
(1)线性:(a)代码:
w=linspace(-8,8,10000);
nx1=[0:11]; nx2=[0:9];
x1=[1 2 3 4 567 8 9 10 1112];
x2=[1 1 1 1 1 1 1 1 11];
x3=[x2,zeros(1,(length(x1)—length(x2)))];
x4=2*x1+3*x3;
X1=x1*exp(-j*nx1'*w);%频率特性
X3=x3*exp(-j*nx1'*w);%频率特性
X4=x4*exp(—j*nx1’*w);%频率特性
subplot(5,3,1),stem(nx1,x1),axis([-1,13,0,15]);title('x1’),ylabel('x(n)’);
subplot(5,3,2),stem(nx2,x2),axis([—1,13,0,5]);title('x2');
subplot(5,3,3),stem(nx1,x4),axis([-1,13,0,26]);title(’x4=2*x1+3*x3');
subplot(5,3,4),plot(w,abs(X1)); ylabel('幅度’) subplot(5,3,7),plot(w,angle(X1));ylabel(’相位')
subplot(5,3,10),plot(w,real(X1));ylabel(’实部’)
subplot(5,3,13),plot(w,imag(X1)); ylabel('虚部’)
subplot(5,3,5),plot(w,abs(X3));
subplot(5,3,8),plot(w,angle(X3));
subplot(5,3,11),plot(w,real(X3));
subplot(5,3,14),plot(w,imag(X3));
subplot(5,3,6),plot(w,abs(X4));
subplot(5,3,9),plot(w,angle(X4));
subplot(5,3,12),plot(w,real(X4));
subplot(5,3,15),plot(w,imag(X4));
(b)结果:
(2)卷积:(a)代码:
nx1=0:11; nx2=0:9; nx3=0:20;
w=linspace(-8,8,40); %w=[—8,8]分10000份
x1=[1 2 3 45 6 78 9 10 11 12];
x2=[1 1 1 1 1 1 1 1 1 1];
x3=conv(x1,x2);% x1卷积x2
x4=x1*exp(-j*nx1'*w);% x1频率特性
x5=x2*exp(-j*nx2’*w);% x2频率特性
x6=x3*exp(-j*nx3'*w);% x1卷积x2频率特性
x7=x4、*x5;
subplot(2,2,1),stem(nx1,x1),axis([—1,15,0,15]),tit le(’x1');
subplot(2,2,2),stem(nx2,x2),axis([—1,1
5,0,5]),title(’x2’);
subplot(2,1,2),stem(nx3,x3),axis([—1,25,0,80]);title('x 1卷积x2结果x3’);
figure,subplot(2,2,1),stem(x4,'filled’),title('x1得DTFT结果x4’);
subplot(2,2,2),stem(x5,'filled'),title(’x2得DTFT 结果x5’);
subplot(2,2,3),stem(x6,'filled’),title(’x3得DTFT结果x6’);
subplot(2,2,4),stem(x7,'filled'),title('x4得DTFT结果x7’);
figure,subplot(3,2,1),stem(w,abs(x6)), ylabel('幅度’),title(’x1卷积x2得DTFT');
subplot(4,2,3),stem(w,angle(x6)),ylabel('相位')
subplot(4,2,5),stem(w,real(x6)),ylabel('实部’)
subplot(4,2,7),stem(w,imag(x6)),ylabel('虚部’)
subplot(4,2,2),stem(w,abs(x7)), title(’x1与x2得DTF T得乘积’);
subplot(4,2,4),stem(w,angle(x7));
subplot(4,2,6),stem(w,real(x7));
subplot(4,2,8),stem(w,imag(x7));
(b)结果:
(3)共轭:(a)代码:
x1n=[1 2 3 4 5 6 7 8 9 1011 12];
w=—10:10;
N1=length(x1n);n1=0:N1—1;
x1=real(x1n);
x2=imag(x1n);
x2n=x1—j*x2;
X1=x2n*(exp(-j)、^(n1'*w));
X2=x1n*(exp(j)、^(n1’*w));
x3=real(X2);
x4=imag(X2);
X2=x3—j*x4;
figure,subplot(211);stem(w,X1,'.’);title('x1n共轭得DTFT’);
subplot(212);stem(w,X2,'、’);title('x1n得DTFT取共轭且反折');
(b)结果:
3。求LTI系统得频率响应
给定系统H(Z)=B(Z)/A(Z),A=[0。98777 -0。31183 0、0256]
B=[0.98997 0.989 0。98997],求系统得幅频响应与相频响应、(要求使用filter(B,A,δ(n))求解。
(a)结果:
A=[0、98777 -0。31183 0、0256];
B=[0。98997 0、989 0、98997];
C=[1 0 0 0 0 0 0 0 0 0 0 0 0 0 00 0 0 0 0 00 0 0 0 0 0]
y=filter(B,A,C);
subplot(2,2,1);stem(y,'、’);title(’原始序列');
mag=abs(y);
ph=angle(y);
ph=ph*180/pi;
subplot(2,2,2);stem(mag,'、');title('幅频特性');
xlabel('时间信号n');ylabel('信号幅度');
subplot(2,2,3);stem(ph,'、’);title('相频特性');
xlabel('时间信号n');ylabel('信号相位');
(b)结果:
4. 采样与频谱混叠
给定信号x(t)=100*exp(-100*t)*cos(2*pi*500*t),求该信号得频谱;当采样频率分别为fs1=2000HZ,fs2=1000HZ;fs3=500HZ;
fs4=200HZ,时输出序列得DTFT。
(a)代码:
x=100*exp(-100*t)、*cos(2*pi*500*t);
t=—2:0、1:2;w=-10:0。1:10;
y=x*(exp(-j)、^(t’*w));
subplot(2,1,1),plot(t,x);
subplot(2,1,2),plot(w,y);title(’原始信号得频谱');
figure,fs1=2000;Ts1=1/fs1;n1=-2:Ts1:2;
fs2=1000;Ts2=1/fs2;n2=-2:Ts2:2;
fs3=500;Ts3=1/fs3;n3=-2:Ts3:2;
fs4=200;Ts4=1/fs4;n4=—2:Ts4:2;
x1=100。*exp(—100*n1)。*cos(2*pi*500*n1);y1=x1*(exp(-j)。^(n1'*w));
subplot(221);plot(w,y1);title('经2000Hz采样后信号得DTFT'); x2=100。*exp(-100*n2)、*cos(2*pi*500*n2);y2=x2*(exp(-j)、^(n2'*w));
subplot(222);plot(w,y2);title(’经1000Hz采样后信号得DTFT’);
x3=100、*exp(—100*n3)、*cos(2*pi*500*n3); y3=x3*(ex p(—j)、^(n3'*w));
subplot(223);plot(w,y3);title(’经500Hz采样后信号得DTF T');
x4=100.*exp(—100*n4)。*cos(2*pi*500*n4);y4=x4*(exp(—j)、^(n4’*w));
subplot(224);plot(w,y4);title(’经200Hz采样后信号得DTFT');
(b)结果:
收获及感想:
DFT针对得就是有限长数字信号得傅立叶变换或傅立叶时频分析问题。但以前得傅立叶变换就是定义在整个时间轴上得,而且一般针对得就是连续信号 ,获得得就是一个连续得频谱。
离散傅里叶变换(DFT),就是傅里叶变换在时域与频域上都呈现离散得形式,将时域信号得采样变换为在离散时间傅里叶变换(DTFT)频域得采样。在形式上,变换两端(时域与频域上)得序列就是有限长得,而实际上这两组序
列都应当被认为就是离散周期信号得主值序列。即使对有限长得离散信号作DFT,也应当将其瞧作经过周期延拓成为周期信号再作变换。在实际应用中通常采用快速傅里叶变换以高效计算DFT。
物理意义
设x(n)就是长度为N得有限长序列,则其傅里叶变换,Z变换与离散傅里叶变换分别用以下三个关系式表示
X(e^jω)= ∑n={0,N-1}x(n) e^jωn
X(z)= ∑n={0,N-1}x(n)z^-n
X(k)= ∑n={0,N-1}x(n)e^-j2π/Nnk
单位圆上得Z变换就就是序列得傅里叶变换
离散傅里叶变换就是x(n)得频谱X(ejω)在[0,2π]上得N点等间隔采样,也就就是对序列频谱得离散化,这就就是DFT得物理意义
