外文翻译原文

DATA CLASSIFICATION USING SUPPORT VECTOR
MACHINE
1DURGESH K. SRIVASTAVA, 2LEKHA BHAMBHU
1Ass. Prof., Department of CSE/IT, BRCM CET, Bahal, Bhiwani, Haryana, India-127028
2Ass. Prof, Department of CSE/IT, BRCM CET, Bahal, Bhiwani, Haryana, India-127028
ABSTRACT
Classification is one of the most important tasks for different application such as text categorization, tone recognition, image classification, micro-array gene expression, proteins structure predictions, data Classification etc. Most of the existing supervised classification methods are based on traditional statistics, which can provide ideal results when sample size is tending to infinity. However, only finite samples can be acquired in practice. In this paper, a novel learning method, Support Vector Machine (SVM), is applied on different data (Diabetes data, Heart Data, Satellite Data and Shuttle data) which have two or multi class. SVM, a powerful machine method developed from statistical learning and has made significant achievement in some field. Introduced in the early 90’s, they led to an explosion of interest in machine learning. The foundations of SVM have been developed by Vapnik and are gaining popularity in field of machine learning due to many attractive features and promising empirical performance. SVM method does not suffer the limitations of data dimensionality and limited samples [1] & [2].
In our experiment, the support vectors, which are critical for classification, are obtained by learning from the training samples. In this paper we have shown the comparative results using different kernel functions for all data samples.
Keywords: Classification, SVM, Kernel functions, Grid search.
1.INTRODUCTION
The Support Vector Machine (SVM) was first proposed by Vapnik and has since attracted a high degree of interest in the machine learning research community [2]. Several recent studies have reported that the SVM (support vector machines) generally are capable of delivering higher performance in terms of classification accuracy than the other data classification algorithms. Sims have been employed in a wide range of real world problems such as text categorization, hand-written digit recognition, tone recognition, image classification and object detection, micro-array gene expression data analysis, data classification. It has been shown that Sims is consistently superior to other supervised learning methods. However, for some datasets, the performance of SVM is very sensitive to how the cost parameter and kernel parameters are set. As a result, the user normally needs to conduct extensive cross validation in order to figure out the optimal parameter setting. This process is commonly referred to as model selection. One practical issue with model selection is that this process is very time consuming. We have experimented with a number of parameters associated with the use of the SVM algorithm that can impact the results. These parameters include choice of kernel functions, the standard deviation of the Gaussian kernel, relative weights associated with slack variables to account for the non-uniform distribution of labeled data, and the number of training examples.
For example, we have taken four different applications data set such as diabetes data, heart data and satellite data which all have different features, classes, number of training data and different number of testing data. These all data taken from RSES data set and https://www.360docs.net/doc/d810432537.html,/~mlearn/MLRepository.htm
l [5]. This paper is organized as follows. In next section, we introduce some related background
including some basic concepts of SVM, kernel function selection, and model selection (parameters selection) of SVM. In Section 3, we detail all experiments results. Finally, we have some conclusions and feature direction in Section 4.
2. SUPPORT VECTOR MACHINE
In this section we introduce some basic concepts of SVM, different kernel function, and model selection (parameters selection) of SVM.
2.1 OVERVIEW OF SVM
SVMs are set of related supervised learning methods used for classification and regression [2]. They belong to a family of generalized linear classification. A special property of SVM is , SVM simultaneously minimize the empirical
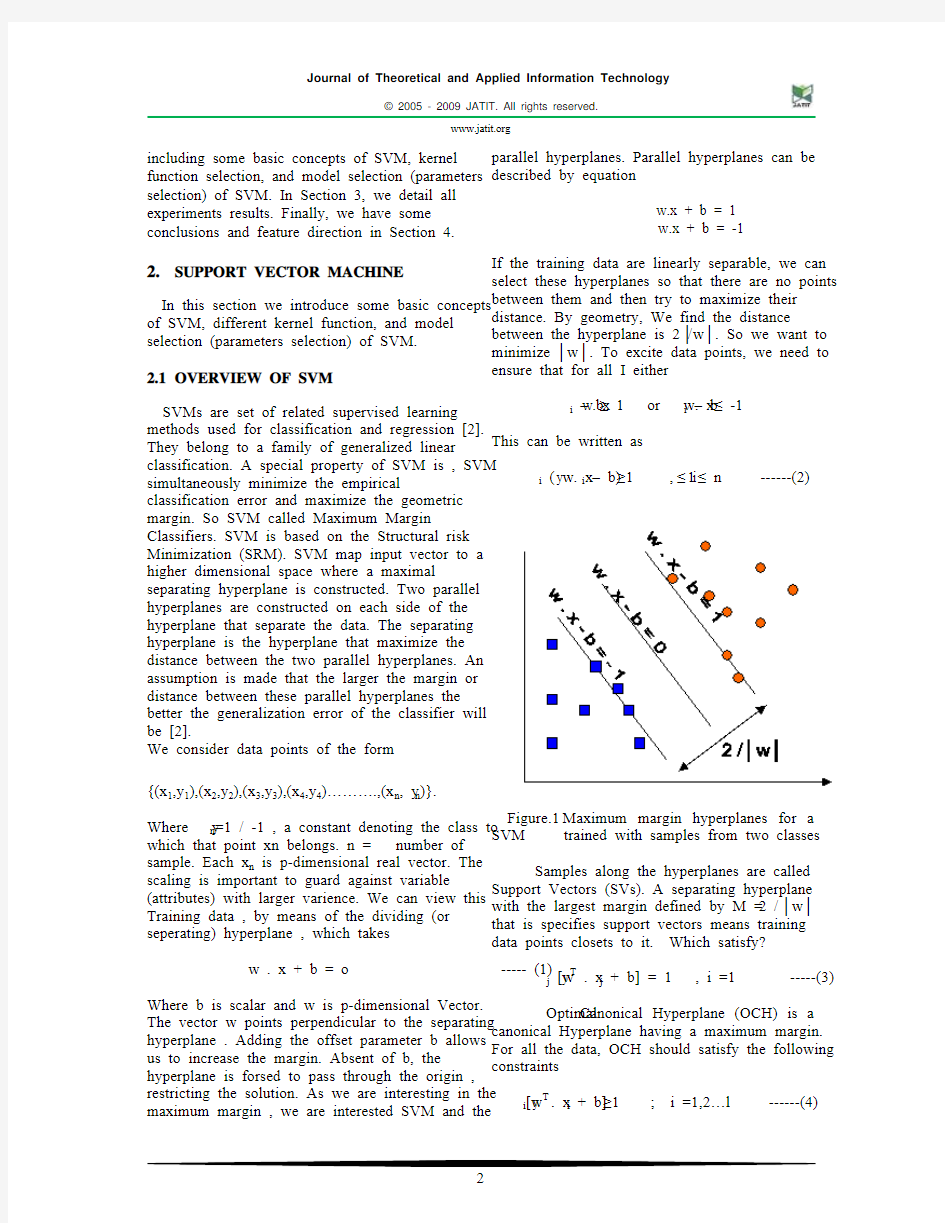
classification error and maximize the geometric margin. So SVM called Maximum Margin Classifiers. SVM is based on the Structural risk Minimization (SRM). SVM map input vector to a higher dimensional space where a maximal separating hyperplane is constructed. Two parallel hyperplanes are constructed on each side of the hyperplane that separate the data. The separating hyperplane is the hyperplane that maximize the distance between the two parallel hyperplanes. An assumption is made that the larger the margin or distance between these parallel hyperplanes the better the generalization error of the classifier will be [2].
We consider data points of the form
{(x 1,y 1),(x 2,y 2),(x 3,y 3),(x 4,y 4)……….,(x n , y n )}.
Where y n =1 / -1 , a constant denoting the class to
which that point xn belongs. n = number of
sample. Each x n is p-dimensional real vector. The
scaling is important to guard against variable
(attributes) with larger varience. We can view this
Training data , by means of the dividing (or
seperating) hyperplane , which takes
w . x + b = o ----- (1)
Where b is scalar and w is p-dimensional Vector.
The vector w points perpendicular to the separating
hyperplane . Adding the offset parameter b allows
us to increase the margin. Absent of b, the
hyperplane is forsed to pass through the origin ,
restricting the solution. As we are interesting in the
maximum margin , we are interested SVM and the
parallel hyperplanes. Parallel hyperplanes can be described by equation
w.x + b = 1
w.x + b = -1 If the training data are linearly separable, we can select these hyperplanes so that there are no points between them and then try to maximize their distance. By geometry, We find the distance
between the hyperplane is 2 / │w │. So we want to minimize │w │. To excite data points, we need to ensure that for all I either w. x i – b ≥ 1 or w. x i – b ≤ -1
This can be written as
y i ( w. x i – b) ≥1 , 1 ≤
i ≤ n ------(2) Figure.1 Maximum margin hyperplanes for a
SVM trained with samples from two classes
Samples along the hyperplanes are called
Support Vectors (SVs). A separating hyperplane
with the largest margin defined by M = 2 / │w │
that is specifies support vectors means training
data points closets to it. Which satisfy?
y j [w T . x j + b] = 1 , i =1 -----(3)
Optimal Canonical Hyperplane (OCH) is a
canonical Hyperplane having a maximum margin.
For all the data, OCH should satisfy the following
constraints
y i [w T . x i + b] ≥1 ; i =1,2…l ------(4)
Where l is Number of Training data point. In order to find the optimal separating hyperplane having a maximul margin, A learning macine should minimize ║w ║2 subject to the inequality constraints
y i [w T
. x i + b] ≥ 1 ; i =1,2…….l This optimization problem solved by the saddle
points of the Lagrange’s Function l L P = L (w, b, α) = 1/2║w ║2 -∑ αi (y i (w T
x i + b )-1) i=1
l
= 1/2 w T w -∑ αi (y i (w T x i + b )-1) ---(5)
i=1
Where αi is a Lagranges multiplier .The search for an optimal saddle points ( w 0, b 0, α0 ) is necessary because Lagranges must be minimized with respect to w and b and has to be maximized with respect to nonnegative αi (αi ≥ 0). This problem can be
solved either in primal form (which is the form of
w & b) or in a dual form (which is the form of αi
).Equation number (4) and (5) are convex and KKT
conditions, which are necessary and sufficient
conditions for a maximum of equation (4).
Partially differentiate equation (5) with respect to
saddle points ( w 0, b 0, α0 ).
?L / ?w 0 = 0
l
i .e w 0 = ∑ αi y i x i -----------(6)
i =1
And ?L / ?b 0 = 0
l
i .e ∑ αi y i = 0 -----------(7)
i =1
Substituting equation (6) and (7) in equation (5).
We change the primal form into dual form.
l
L d (α) = ∑ αi - 1/2 ∑ αi αj y i y j x i T x j -------(8)
i =1
In order to find the optimal hyperplane, a dual lagrangian (L d ) has to be maximized with respect to nonnegative αi (i .e. αi must be in the
nonnegative quadrant) and with respect to the equality constraints as follow
αi ≥ 0 , i = 1,2…...l
l
∑ αi y i = 0
i =1
Note that the dual Lagrangian L d (α) is expressed in terms of training data and depends only on the scalar products of input patterns (x i T x j ).More detailed information on SVM can be found in
Reference no.[1]&[2]. 2.2 KERNEL SELECTION OF SVM
Training vectors x i are mapped into a higher (may be infinite) dimensional space by the function Ф. Then SVM finds a linear separating
hyperplane with the maximal margin in this higher
dimension space .C > 0 is the penality parameter of the error term. Furthermore, K(x i , x j ) ≡ Ф(x i )T Ф(x j ) is called the kernel function[2]. There are many kernel functions in SVM, so how to select a good kernel function is also a research issue.However, for general purposes, there are some popular kernel functions [2] & [3]: ? Linear kernel: K (x i , x j ) = x i T x j .
? Polynomial kernel:
K (x i , x j ) = (γ x i T x j + r)d , γ > 0
? RBF kernel : K (x i , x j ) = exp(-γ ║x i - x j ║2) , γ > 0 ? Sigmoid kernel: K (x i , x j ) = tanh(γ x i T x j + r) Here, γ, r and d are kernel parameters. In these popular kernel functions, RBF is the main kernel function because of following reasons [2]: 1. The RBF kernel nonlinearly maps samples into a higher dimensional space unlike to linear kernel. 2. The RBF kernel has less hyperparameters than the polynomial kernel. 3. The RBF kernel has less numerical difficulties. 2.3 MODEL SELECTION OF SVM
Model selection is also an important issue in SVM. Recently, SVM have shown good
performance in data classification. Its success depends on the tuning of several parameters which affect the generalization error. We often call this parameter tuning procedure as the model selection. If you use the linear SVM, you only need to tune the cost parameter C. Unfortunately , linear SVM are often applied to linearly separable problems.
Many problems are non-linearly separable. For example, Satellite data and Shuttle data are not linearly separable. Therefore, we often apply nonlinear kernel to solve classification problems, so we need to select the cost parameter (C) and kernel parameters (γ, d) [4] & [5].
We usually use the grid-search method in cross validation to select the best parameter set. Then apply this parameter set to the training dataset and then get the classifier. After that, use the classifier to classify the testing dataset to get the generalization accuracy.
3.INTRODUCTION OF ROUGH SET
Rough set is a new mathematic tool to deal with un-integrality and uncertain knowledge. It can effectively .analyze and deal with all kinds of fuzzy, conflicting and incomplete information, and finds out the connotative knowledge from it, and reveals its underlying rules. It was first put forward by Z.Pawlak, a Polish mathematician, in 1982. In recent years, rough set theory is widely emphasized for the application in the fields of data mining and artificial intelligence.
3.1THE BASIC DEFINITIONS OF ROUGH
SET
Let S be an information system formed of 4 elements
S = (U, Q, V, f) where
U - is a finite set of objects
Q - is a finite set of attributes
V- is a finite set of values of the attributes
f- is the information function so that:
f : U × Q - V.
Let P be a subset of Q, P ? Q, i.e. a subset of attributes. The indiscernibility relation noted by IND(P) is a relation defined as follows
IND(P) = {< x, y > ∈ U × U: f(x, a) = f(y, a), for all a ∈ P}
If < x, y > ∈ IND(P), then we can say that x and y are indiscernible for the subset of P attributes. U/IND(P) indicate the object sets that are indiscernible for the subset of P attributes.
U / IND(P) = { U1, U2, …….U m }
Where U i∈ U, i = 1 to m is a set of indiscernible objects for the subset of P attributes and Ui ∩ Uj = Ф, i ,j = 1to m and i≠ j. Ui can be also called the equivalency class for the indiscernibility relation. For X ? U and P inferior approximation P1 and superior approximation P1 are defined as follows
P1(X) = U{Y ∈ U/ IND(P): Y ? Xl}
P1(X= U{Y ∈ U / INE(P): Y ∩ X ≠Ф }
Rough Set Theory is successfully used in feature selection and is based on finding a reduct from the original set of attributes. Data mining algorithms will not run on the original set of attributes, but on this reduct that will be equivalent with the original set. The set of attributes Q from the informational system S = (U, Q, V, f) can be divided into two subsets: C and D, so that C ?Q, D ? Q, C ∩ D =Ф. Subset C will contain the attributes of condition, while subset D those of decision. Equivalency classes U/IND(C) and U/IND(D) are called condition classes and decision classes
The degree of dependency of the set of attributes of decision D as compared to the set of attributes of condition C is marked with γ
c (D) an
d is defined by
POS C (D) contains the objects from U which can be classified as belonging to one of the classes of equivalency U/IND(D), using only the attributes in C. if γc (D) = 1 then C determines D functionally. Data set U is called consistent if γc (D) = 1. POS C(D) is called the positive region of decision classes U/IND(D), bearing in mind the attributes of condition from C.
Subset R ? C is a D-reduct of C if POS R (D) = POS C(D) and R has no R' subset, R' ? R so that POS R’.(D) = POS R(D) . Namely, a reduct is a minimal set of attributes that maintains the positive region of decision classes U/IND(D) bearing in mind the attributes of condition from C. Each reduct has the property that no attribute can be extracted from it without modifying the relation of indiscernibility. For the set of attributes C there might exist several reducts.
The set of attributes that belongs to the intersection of all reducts of C set is called the core of C.
An attribute a is indispensable for C if POS C (D) ≠ POS C[a] (D). The core of C is the union of all indispensable attributes in C. The core has two equivalent definitions. More detailed information on RSES can be found in .[1]&[2].
4RESULTS OF EXPERIMENTS
The classification experiments are conducted on different data like Heart data, Diabetes data, Satellite data and Shuttle data. These data taken from
https://www.360docs.net/doc/d810432537.html,/~mlearn/MLRepository.htm
l and RSES data sets . In these experiments, we done both method on different data set. Firstly, Use LIBSVM with different kernel linear , polinomial , sigmoid and RBF[5]. RBF kernel is employed. Accordingly, there are two parameters, the RBF kernel parameter γ and the cost parameter C, to be set. Table 1 lists the main characteristics of the three datasets used in the experiments. All three data sets, diabetes , heart, and satellite, are from the machine learning repository collection. In these experiments, 5-fold cross validation is conducted to determine the best value of different parameter C and γ .The combinations of (C, γ) is the most appropriate for the given data classification problem with respect to prediction accuracy. The value of (C , γ) for all data set are shown in Table 1. Second, RSES Tool set is used for data classification with all data set using different classifier technique as Rule Based classifier, Rule Based classifier with Discretization, K-NN classifier and LTF (Local Transfer Function) Classifier. The hardware platform used in the experiments is a workstation with Pentium-IV-
1GHz CPU, 256MB RAM, and the Windows XP(using MS-DOS Prompt).
The following three tables represent the different experiments results. Table 1 shows the best value of different RBF parameter value (C , γ) and cross validation rate with 5-fold cross validation using grid search method[5]&[6]. . Table 2 shows the Total execution time for all data to predict the accuracy in seconds.
Table 1
Fig. 2, 3 shows, Accuracy comparison of Diabetes data Set after taking different training set and all testing set for both technique (SVM & RSES) using RBF kernel function for SVM and Rule Base Classifier for RSES.
Fig :2 Accuracy of Heart data with SVM & RSES Applic
at-ions Train
ing
data
Testi
ng
data
Best c and g with
five fold
Cross
validati
on
rate
C γ
Diabet
es data
500 200
211=20
48
2- 7=
.007812
5
75.6
Heart
Data
200 70
25=32 2-7 =
.007812
5
82.5
Satellit
e Data
4435 2000
21=2 21=2
91.725
Shuttle
Data
4350
1443
5 215=
32768
21=2 99.92
Applications Total Execution Time to
Predict
SVM RSES Heart data
71 14
Diabetes data
22 7. 5
Satellite data
74749 85 Shuttle Data
252132.1 220
Fig: 3 Accuracy of Diabetes data with SVM & RSES
Table 3: Compare with Rough Set Classifiers
5 CONCLUSION
In this paper, we have shown the comparative results using different kernel functions. Fig 2 and
3 shows the comparative results of different data
samples using different kernels linear,
polynomial, sigmoid and RBF. The experiment
results are encouraging .It can be seen that the
choice of kernel function and best value of
parameters for particular kernel is critical for a
given amount of data. Fig 3 shows that the best
kernel is RBF for infinite data and multi class.
REFERENCES:
[1] Boser, B. E., I. Guyon, and V. Vapnik (1992).
A training algorithm for optimal margin
classifiers . In Proceedings of the Fifth
Annual Workshop on Computational
Learning Theory, pages. 144 -152. ACM Press 1992.
[2] V. Vapnik. The Nature of Statistical Learning Theory. NY: Springer-Verlag. 1995.
[3] Chih-Wei Hsu, Chih-Chung Chang, and Chih- Jen Lin. “A Practical Guide to Support Vector Classification” . Deptt of Computer Sci.
National Taiwan Uni, Taipei, 106, Taiwan
https://www.360docs.net/doc/d810432537.html,.tw/~cjlin 2007 [4] C.-W. Hsu and C. J. Lin. A comparison of
methods for multi-class support vector
machines. IEEE Transactions on Neural
Networks, 13(2):415-425, 2002.
[5] Chang, C.-C. and C. J. Lin (2001). LIBSVM:
a library for support vector machines.
https://www.360docs.net/doc/d810432537.html,.tw/~cjlin/libsvm . [6] Li Maokuan, Cheng Yusheng, Zhao Honghai ”Unlabeleddata classification via SVM and k- means Clustering”. Proceeding of the
International Conference on Computer
Graphics, Image and
Visualization (CGIV04), 2004 IEEE.
[7] Z. Pawlak, Rough sets and intelligent data
analysis, Information Sciences 147 (2002) 1– 12.
[8] RSES 2.2 User’s Guide Warsaw University https://www.360docs.net/doc/d810432537.html,.pl/?rses ,January 19, 2005
[9] Eva Kovacs, Losif Ignat, “Reduct Equivalent Rule Induction Based On Rough Set Theory”, Technical University ofCluj-Napoca.
[9] RSES Home page
https://www.360docs.net/doc/d810432537.html,.pl/?rses
Applications Training
data Testing
data
Feature No. Of
Classes
Using
SVM
(with
RBF
kernel)
Using RSES with Different classifier
Rule
Based
Classifier
Rule Based
Classifier
with
Discretization
K-NN
Classifier
LTF
Classifier
Heart data 200 70 13 2 82.8571 82.9 81.4 75.7 44.3 Diabetes
data
500 200 8 2 80.5 67.8 67.5 70.0 78.0
Satellite
data
4435 2000 36 7 91.8 87.5 89.43 90.4 89.7 Shuttle Data 43500 14435 9 7 99.9241 94.5 97.43 94.3 99.8
BIOGRAPHY:
Mr Durgesh K. Sriavastava received the degree in Information & Technology (IT) from MIET, Meerut, UP, INDIA in 2006. He was a research student of Birla Institute of Technology (BIT), Mesra, Ranchi, Jharkhand, INDIA) in 2008. Currently, he is an Assistant Professor (AP) at BRCM CET, Bahal, Bhiwani, Haryana, INDIA. His interests are in Software engineering & modeling and design, Machine Learning.
Mrs Lekha Bhambhu
received the degree in Computer Science & Engineering from BRCM CET, Bahal, Bhiwani, Haryana, INDIA. she was a research student of CDLU, Sirsa, Haryana, INDIA. Currently, she is an Assistant Professor (AP) at BRCM CET, Bahal, Bhiwani, Haryana, INDIA. Her interests are in Operating System, Software engineering.
1外文文献翻译原文及译文汇总
华北电力大学科技学院 毕业设计(论文)附件 外文文献翻译 学号:121912020115姓名:彭钰钊 所在系别:动力工程系专业班级:测控技术与仪器12K1指导教师:李冰 原文标题:Infrared Remote Control System Abstract 2016 年 4 月 19 日
红外遥控系统 摘要 红外数据通信技术是目前在世界范围内被广泛使用的一种无线连接技术,被众多的硬件和软件平台所支持。红外收发器产品具有成本低,小型化,传输速率快,点对点安全传输,不受电磁干扰等特点,可以实现信息在不同产品之间快速、方便、安全地交换与传送,在短距离无线传输方面拥有十分明显的优势。红外遥控收发系统的设计在具有很高的实用价值,目前红外收发器产品在可携式产品中的应用潜力很大。全世界约有1亿5千万台设备采用红外技术,在电子产品和工业设备、医疗设备等领域广泛使用。绝大多数笔记本电脑和手机都配置红外收发器接口。随着红外数据传输技术更加成熟、成本下降,红外收发器在短距离通讯领域必将得到更广泛的应用。 本系统的设计目的是用红外线作为传输媒质来传输用户的操作信息并由接收电路解调出原始信号,主要用到编码芯片和解码芯片对信号进行调制与解调,其中编码芯片用的是台湾生产的PT2262,解码芯片是PT2272。主要工作原理是:利用编码键盘可以为PT2262提供的输入信息,PT2262对输入的信息进行编码并加载到38KHZ的载波上并调制红外发射二极管并辐射到空间,然后再由接收系统接收到发射的信号并解调出原始信息,由PT2272对原信号进行解码以驱动相应的电路完成用户的操作要求。 关键字:红外线;编码;解码;LM386;红外收发器。 1 绪论
ASP外文翻译原文
https://www.360docs.net/doc/d810432537.html, https://www.360docs.net/doc/d810432537.html, 是一个统一的 Web 开发模型,它包括您使用尽可能少的代码生成企业级 Web 应用程序所必需的各种服务。https://www.360docs.net/doc/d810432537.html, 作为 .NET Framework 的一部分提供。当您编写 https://www.360docs.net/doc/d810432537.html, 应用程序的代码时,可以访问 .NET Framework 中的类。您可以使用与公共语言运行库 (CLR) 兼容的任何语言来编写应用程序的代码,这些语言包括 Microsoft Visual Basic、C#、JScript .NET 和 J#。使用这些语言,可以开发利用公共语言运行库、类型安全、继承等方面的优点的https://www.360docs.net/doc/d810432537.html, 应用程序。 https://www.360docs.net/doc/d810432537.html, 包括: ?页和控件框架 ?https://www.360docs.net/doc/d810432537.html, 编译器 ?安全基础结构 ?状态管理功能 ?应用程序配置 ?运行状况监视和性能功能 ?调试支持 ?XML Web services 框架 ?可扩展的宿主环境和应用程序生命周期管理 ?可扩展的设计器环境 https://www.360docs.net/doc/d810432537.html, 页和控件框架是一种编程框架,它在 Web 服务器上运行,可以动态地生成和呈现 https://www.360docs.net/doc/d810432537.html, 网页。可以从任何浏览器或客户端设备请求 https://www.360docs.net/doc/d810432537.html, 网页,https://www.360docs.net/doc/d810432537.html, 会向请求浏览器呈现标记(例如 HTML)。通常,您可以对多个浏览器使用相同的页,因为 https://www.360docs.net/doc/d810432537.html, 会为发出请求的浏览器呈现适当的标记。但是,您可以针对诸如 Microsoft Internet Explorer 6 的特定浏览器设计https://www.360docs.net/doc/d810432537.html, 网页,并利用该浏览器的功能。https://www.360docs.net/doc/d810432537.html, 支持基于 Web 的设备(如移动电话、手持型计算机和个人数字助理 (PDA))的移动控件。
毕业设计外文翻译附原文
外文翻译 专业机械设计制造及其自动化学生姓名刘链柱 班级机制111 学号1110101102 指导教师葛友华
外文资料名称: Design and performance evaluation of vacuum cleaners using cyclone technology 外文资料出处:Korean J. Chem. Eng., 23(6), (用外文写) 925-930 (2006) 附件: 1.外文资料翻译译文 2.外文原文
应用旋风技术真空吸尘器的设计和性能介绍 吉尔泰金,洪城铱昌,宰瑾李, 刘链柱译 摘要:旋风型分离器技术用于真空吸尘器 - 轴向进流旋风和切向进气道流旋风有效地收集粉尘和降低压力降已被实验研究。优化设计等因素作为集尘效率,压降,并切成尺寸被粒度对应于分级收集的50%的效率进行了研究。颗粒切成大小降低入口面积,体直径,减小涡取景器直径的旋风。切向入口的双流量气旋具有良好的性能考虑的350毫米汞柱的低压降和为1.5μm的质量中位直径在1米3的流量的截止尺寸。一使用切向入口的双流量旋风吸尘器示出了势是一种有效的方法,用于收集在家庭中产生的粉尘。 摘要及关键词:吸尘器; 粉尘; 旋风分离器 引言 我们这个时代的很大一部分都花在了房子,工作场所,或其他建筑,因此,室内空间应该是既舒适情绪和卫生。但室内空气中含有超过室外空气因气密性的二次污染物,毒物,食品气味。这是通过使用产生在建筑中的新材料和设备。真空吸尘器为代表的家电去除有害物质从地板到地毯所用的商用真空吸尘器房子由纸过滤,预过滤器和排气过滤器通过洁净的空气排放到大气中。虽然真空吸尘器是方便在使用中,吸入压力下降说唱空转成比例地清洗的时间,以及纸过滤器也应定期更换,由于压力下降,气味和细菌通过纸过滤器内的残留粉尘。 图1示出了大气气溶胶的粒度分布通常是双峰形,在粗颗粒(>2.0微米)模式为主要的外部来源,如风吹尘,海盐喷雾,火山,从工厂直接排放和车辆废气排放,以及那些在细颗粒模式包括燃烧或光化学反应。表1显示模式,典型的大气航空的直径和质量浓度溶胶被许多研究者测量。精细模式在0.18?0.36 在5.7到25微米尺寸范围微米尺寸范围。质量浓度为2?205微克,可直接在大气气溶胶和 3.85至36.3μg/m3柴油气溶胶。
毕业设计外文翻译原文.
Optimum blank design of an automobile sub-frame Jong-Yop Kim a ,Naksoo Kim a,*,Man-Sung Huh b a Department of Mechanical Engineering,Sogang University,Shinsu-dong 1,Mapo-ku,Seoul 121-742,South Korea b Hwa-shin Corporation,Young-chun,Kyung-buk,770-140,South Korea Received 17July 1998 Abstract A roll-back method is proposed to predict the optimum initial blank shape in the sheet metal forming process.The method takes the difference between the ?nal deformed shape and the target contour shape into account.Based on the method,a computer program composed of a blank design module,an FE-analysis program and a mesh generation module is developed.The roll-back method is applied to the drawing of a square cup with the ˉange of uniform size around its periphery,to con?rm its validity.Good agreement is recognized between the numerical results and the published results for initial blank shape and thickness strain distribution.The optimum blank shapes for two parts of an automobile sub-frame are designed.Both the thickness distribution and the level of punch load are improved with the designed blank.Also,the method is applied to design the weld line in a tailor-welded blank.It is concluded that the roll-back method is an effective and convenient method for an optimum blank shape design.#2000Elsevier Science S.A.All rights reserved. Keywords:Blank design;Sheet metal forming;Finite element method;Roll-back method
土木外文翻译原文和译文
A convection-conduction model for analysis of the freeze-thaw conditions in the surrounding rock wall of a tunnel in permafrost regions Abstract Based on the analyses of fundamental meteorological and hydrogeological conditions at the site of a tunnel in the cold regions, a combined convection-conduction model for air flow in the tunnel and temperature field in the surrounding has been constructed. Using the model, the air temperature distribution in the Xiluoqi No. 2 Tunnel has been simulated numerically. The simulated results are in agreement with the data observed. Then, based on the in situ conditions of sir temperature, atmospheric pressure, wind force, hydrogeology and engineering geology, the air-temperature relationship between the temperature on the surface of the tunnel wall and the air temperature at the entry and exit of the tunnel has been obtained, and the freeze-thaw conditions at the Dabanshan Tunnel which is now under construction is predicted. Keywords: tunnel in cold regions, convective heat exchange and conduction, freeze-thaw. A number of highway and railway tunnels have been constructed in the permafrost regions and their neighboring areas in China. Since the hydrological and thermal conditions changed after a tunnel was excavated,the surrounding wall rock materials often froze, the frost heaving caused damage to the liner layers and seeping water froze into ice diamonds,which seriously interfered with the communication and transportation. Similar problems of the freezing damage in the tunnels also appeared in other countries like Russia, Norway and Japan .Hence it is urgent to predict the freeze-thaw conditions in the surrounding rock materials and provide a basis for the design,construction and
中国的对外贸易外文翻译及原文
外文翻译 原文 Foreign T rade o f China Material Source:W anfang Database Author:Hitomi Iizaka 1.Introduction On December11,2001,China officially joined the World T rade Organization(WTO)and be c a me its143rd member.China’s presence in the worl d economy will continue to grow and deepen.The foreign trade sector plays an important andmultifaceted role in China’s economic development.At the same time, China’s expanded role in the world economy is beneficial t o all its trading partners. Regions that trade with China benefit from cheaper and mor e varieties of imported consumer goods,raw materials and intermediate products.China is also a large and growing export market.While the entry of any major trading nation in the global trading system can create a process of adjustment,the o u t c o me is fundamentally a win-win situation.In this p aper we would like t o provide a survey of the various institutions,laws and characteristics of China’s trade.Among some of the findings, we can highlight thefollowing: ?In2001,total trade to gross domestic pr oduct(GDP)ratio in China is44% ?In2001,47%of Chinese trade is processed trade1 ?In2001,51%of Chinese trade is conduct ed by foreign firms in China2 ?In2001,36%of Chinese exports originate from Gu an gdon g province ?In2001,39%of China’s exports go through Hong Kong to be re-exported elsewhere 2.Evolution of China’s Trade Regime Equally remarkable are the changes in the commodity composition of China’s exports and imports.Table2a shows China’s annu al export volumes of primary goods and manufactured goods over time.In1980,primary goods accounted for 50.3%of China’s exports and manufactured goods accounted for49.7%.Although the share of primary good declines slightly during the first half of1980’s,it remains at50.6%in1985.Since then,exports of manufactured goods have grown at a much
【最新推荐】应急法律外文文献翻译原文+译文
文献出处:Thronson P. Toward Comprehensive Reform of America’s Emergency Law Regime [J]. University of Michigan Journal of Law Reform, 2013, 46(2). 原文 TOWARD COMPREHENSIVE REFORM OF AMERICA’S EMERGENCY LAW REGIME Patrick A. Thronson Unbenownst to most Americans, the United States is presently under thirty presidentially declared states of emergency. They confer vast powers on the Executive Branch, including the ability to financially incapacitate any person or organization in the United States, seize control of the nation’s communications infrastructure, mobilize military forces, expand the permissible size of the military without congressional authorization, and extend tours of duty without consent from service personnel. Declared states of emergency may also activate Presidential Emergency Action Documents and other continuity-of-government procedures, which confer powers on the President—such as the unilateral suspension of habeas corpus—that appear fundamentally opposed to the American constitutional order.
毕业设计(论文)外文资料翻译〔含原文〕
南京理工大学 毕业设计(论文)外文资料翻译 教学点:南京信息职业技术学院 专业:电子信息工程 姓名:陈洁 学号: 014910253034 外文出处:《 Pci System Architecture 》 (用外文写) 附件: 1.外文资料翻译译文;2.外文原文。 指导教师评语: 该生外文翻译没有基本的语法错误,用词准确,没 有重要误译,忠实原文;译文通顺,条理清楚,数量与 质量上达到了本科水平。 签名: 年月日 注:请将该封面与附件装订成册。
附件1:外文资料翻译译文 64位PCI扩展 1.64位数据传送和64位寻址:独立的能力 PCI规范给出了允许64位总线主设备与64位目标实现64位数据传送的机理。在传送的开始,如果回应目标是一个64位或32位设备,64位总线设备会自动识别。如果它是64位设备,达到8个字节(一个4字)可以在每个数据段中传送。假定是一串0等待状态数据段。在33MHz总线速率上可以每秒264兆字节获取(8字节/传送*33百万传送字/秒),在66MHz总线上可以528M字节/秒获取。如果回应目标是32位设备,总线主设备会自动识别并且在下部4位数据通道上(AD[31::00])引导,所以数据指向或来自目标。 规范也定义了64位存储器寻址功能。此功能只用于寻址驻留在4GB地址边界以上的存储器目标。32位和64位总线主设备都可以实现64位寻址。此外,对64位寻址反映的存储器目标(驻留在4GB地址边界上)可以看作32位或64位目标来实现。 注意64位寻址和64位数据传送功能是两种特性,各自独立并且严格区分开来是非常重要的。一个设备可以支持一种、另一种、都支持或都不支持。 2.64位扩展信号 为了支持64位数据传送功能,PCI总线另有39个引脚。 ●REQ64#被64位总线主设备有效表明它想执行64位数据传送操作。REQ64#与FRAME#信号具有相同的时序和间隔。REQ64#信号必须由系统主板上的上拉电阻来支持。当32位总线主设备进行传送时,REQ64#不能又漂移。 ●ACK64#被目标有效以回应被主设备有效的REQ64#(如果目标支持64位数据传送),ACK64#与DEVSEL#具有相同的时序和间隔(但是直到REQ64#被主设备有效,ACK64#才可被有效)。像REQ64#一样,ACK64#信号线也必须由系统主板上的上拉电阻来支持。当32位设备是传送目标时,ACK64#不能漂移。 ●AD[64::32]包含上部4位地址/数据通道。 ●C/BE#[7::4]包含高4位命令/字节使能信号。 ●PAR64是为上部4个AD通道和上部4位C/BE信号线提供偶校验的奇偶校验位。 以下是几小结详细讨论64位数据传送和寻址功能。 3.在32位插入式连接器上的64位卡
英文翻译与英文原文.陈--
翻译文献:INVESTIGATION ON DYNAMIC PERFORMANCE OF SLIDE UNIT IN MODULAR MACHINE TOOL (对组合机床滑台动态性能的调查报告) 文献作者:Peter Dransfield, 出处:Peter Dransfield, Hydraulic Control System-Design and Analysis of TheirDynamics, Springer-Verlag, 1981 翻译页数:p139—144 英文译文: 对组合机床滑台动态性能的调查报告 【摘要】这一张纸处理调查利用有束缚力的曲线图和状态空间分析法对组合机床滑台的滑动影响和运动平稳性问题进行分析与研究,从而建立了滑台的液压驱动系统一自调背压调速系统的动态数学模型。通过计算机数字仿真系统,分析了滑台产生滑动影响和运动不平稳的原因及主要影响因素。从那些中可以得出那样的结论,如果能合理地设计液压缸和自调背压调压阀的结构尺寸. 本文中所使用的符号如下: s1-流源,即调速阀出口流量; S el—滑台滑动摩擦力 R一滑台等效粘性摩擦系数: I1—滑台与油缸的质量 12—自调背压阀阀心质量 C1、c2—油缸无杆腔及有杆腔的液容; C2—自调背压阀弹簧柔度; R1, R2自调背压阀阻尼孔液阻, R9—自调背压阀阀口液阻 S e2—自调背压阀弹簧的初始预紧力; I4, I5—管路的等效液感 C5、C6—管路的等效液容: R5, R7-管路的等效液阻; V3, V4—油缸无杆腔及有杆腔内容积; P3, P4—油缸无杆腔及有杆腔的压力 F—滑台承受负载, V—滑台运动速度。本文采用功率键合图和状态空间分折法建立系统的运动数学模型,滑台的动态特性可以能得到显著改善。
外文翻译原文
204/JOURNAL OF BRIDGE ENGINEERING/AUGUST1999
JOURNAL OF BRIDGE ENGINEERING /AUGUST 1999/205 ends.The stress state in each cylindrical strip was determined from the total potential energy of a nonlinear arch model using the Rayleigh-Ritz method. It was emphasized that the membrane stresses in the com-pression region of the curved models were less than those predicted by linear theory and that there was an accompanying increase in ?ange resultant force.The maximum web bending stress was shown to occur at 0.20h from the compression ?ange for the simple support stiffness condition and 0.24h for the ?xed condition,where h is the height of the analytical panel.It was noted that 0.20h would be the optimum position for longitudinal stiffeners in curved girders,which is the same as for straight girders based on stability requirements.From the ?xed condition cases it was determined that there was no signi?cant change in the membrane stresses (from free to ?xed)but that there was a signi?cant effect on the web bend-ing stresses.Numerical results were generated for the reduc-tion in effective moment required to produce initial yield in the ?anges based on curvature and web slenderness for a panel aspect ratio of 1.0and a web-to-?ange area ratio of 2.0.From the results,a maximum reduction of about 13%was noted for a /R =0.167and about 8%for a /R =0.10(h /t w =150),both of which would correspond to extreme curvature,where a is the length of the analytical panel (modeling the distance be-tween transverse stiffeners)and R is the radius of curvature.To apply the parametric results to developing design criteria for practical curved girders,the de?ections and web bending stresses that would occur for girders with a curvature corre-sponding to the initial imperfection out-of-?atness limit of D /120was used.It was noted that,for a panel with an aspect ratio of 1.0,this would correspond to a curvature of a /R =0.067.The values of moment reduction using this approach were compared with those presented by Basler (Basler and Thurlimann 1961;Vincent 1969).Numerical results based on this limit were generated,and the following web-slenderness requirement was derived: 2 D 36,500a a =1?8.6?34 (1) ? ??? t R R F w ?y where D =unsupported distance between ?anges;and F y =yield stress in psi. An extension of this work was published a year later,when Culver et al.(1973)checked the accuracy of the isolated elas-tically supported cylindrical strips by treating the panel as a unit two-way shell rather than as individual strips.The ?ange/web boundaries were modeled as ?xed,and the boundaries at the transverse stiffeners were modeled as ?xed and simple.Longitudinal stiffeners were modeled with moments of inertias as multiples of the AASHO (Standard 1969)values for straight https://www.360docs.net/doc/d810432537.html,ing analytical results obtained for the slenderness required to limit the plate bending stresses in the curved panel to those of a ?at panel with the maximum allowed out-of-?atness (a /R =0.067)and with D /t w =330,the following equa-tion was developed for curved plate girder web slenderness with one longitudinal stiffener: D 46,000a a =1?2.9 ?2.2 (2) ? ? ? t R f R w ?b where the calculated bending stress,f b ,is in psi.It was further concluded that if longitudinal stiffeners are located in both the tension and compression regions,the reduction in D /t w will not be required.For the case of two stiffeners,web bending in both regions is reduced and the web slenderness could be de-signed as a straight girder panel.Eq.(1)is currently used in the ‘‘Load Factor Design’’portion of the Guide Speci?cations ,and (2)is used in the ‘‘Allowable Stress Design’’portion for girders stiffened with one longitudinal stiffener.This work was continued by Mariani et al.(1973),where the optimum trans-verse stiffener rigidity was determined analytically. During almost the same time,Abdel-Sayed (1973)studied the prebuckling and elastic buckling behavior of curved web panels and proposed approximate conservative equations for estimating the critical load under pure normal loading (stress),pure shear,and combined normal and shear loading.The linear theory of shells was used.The panel was simply supported along all four edges with no torsional rigidity of the ?anges provided.The transverse stiffeners were therefore assumed to be rigid in their directions (no strains could be developed along the edges of the panels).The Galerkin method was used to solve the governing differential equations,and minimum eigenvalues of the critical load were calculated and presented for a wide range of loading conditions (bedding,shear,and combined),aspect ratios,and curvatures.For all cases,it was demonstrated that the critical load is higher for curved panels over the comparable ?at panel and increases with an increase in curvature. In 1980,Daniels et al.summarized the Lehigh University ?ve-year experimental research program on the fatigue behav-ior of horizontally curved bridges and concluded that the slen-derness limits suggested by Culver were too severe.Equations for ‘‘Load Factor Design’’and for ‘‘Allowable Stress Design’’were developed (respectively)as D 36,500a =1?4?192(3)? ?t R F w ?y D 23,000a =1?4 ?170 (4) ? ? t R f w ?b The latter equation is currently used in the ‘‘Allowable Stress Design’’portion of the Guide Speci?cations for girders not stiffened longitudinally. Numerous analytical and experimental works on the subject have also been published by Japanese researchers since the end of the CURT project.Mikami and colleagues presented work in Japanese journals (Mikami et al.1980;Mikami and Furunishi 1981)and later in the ASCE Journal of Engineering Mechanics (Mikami and Furunishi 1984)on the nonlinear be-havior of cylindrical web panels under bending and combined bending and shear.They analyzed the cylindrical panels based on Washizu’s (1975)nonlinear theory of shells.The governing nonlinear differential equations were solved numerically by the ?nite-difference method.Simple support boundary condi-tions were assumed along the curved boundaries (top and bot-tom at the ?ange locations)and both simple and ?xed support conditions were used at the straight (vertical)boundaries.The large displacement behavior was demonstrated by Mi-kami and Furunishi for a range of geometric properties.Nu-merical values of the load,de?ection,membrane stress,bend-ing stress,and torsional stress were obtained,but no equations for design use were presented.Signi?cant conclusions include that:(1)the compressive membrane stress in the circumfer-ential direction decreases with an increase in curvature;(2)the panel under combined bending and shear exhibits a lower level of the circumferential membrane stress as compared with the panel under pure bending,and as a result,the bending moment carried by the web panel is reduced;and (3)the plate bending stress under combined bending and shear is larger than that under pure bending.No formulations or recommendations for direct design use were made. Kuranishi and Hiwatashi (1981,1983)used the ?nite-ele-ment method to demonstrate the elastic ?nite displacement be-havior of curved I-girder webs under bending using models with and without ?ange rigidities.Rotation was not allowed (?xed condition)about the vertical axis at the ends of the panel (transverse stiffener locations).Again,the nonlinear distribu-
污水处理外文翻译(带原文)
提高塔式复合人工湿地处理农村生活污水的 脱氮效率1 摘要: 努力保护水源,尤其是在乡镇地区的饮用水源,是中国污水处理当前面临的主要问题。氮元素在水体富营养化和对水生物的潜在毒害方面的重要作用,目前废水脱氮已成为首要关注的焦点。人工湿地作为一种小型的,处理费用较低的方法被用于处理乡镇生活污水。比起活性炭在脱氮方面显示出的广阔前景,人工湿地系统由于溶解氧的缺乏而在脱氮方面存在一定的制约。为了提高脱氮效率,一种新型三阶段塔式混合湿地结构----人工湿地(thcw)应运而生。它的第一部分和第三部分是水平流矩形湿地结构,第二部分分三层,呈圆形,呈紊流状态。塔式结构中水流由顶层进入第二层及底层,形成瀑布溢流,因此水中溶解氧浓度增加,从而提高了硝化反应效率,反硝化效率也由于有另外的有机物的加入而得到了改善,增加反硝化速率的另一个原因是直接通过旁路进入第二部分的废水中带入的足量有机物。常绿植物池柏(Taxodium ascendens),经济作物蔺草(Schoenoplectus trigueter),野茭白(Zizania aquatica),有装饰性的多花植物睡莲(Nymphaea tetragona),香蒲(Typha angustifolia)被种植在湿地中。该系统对总悬浮物、化学需氧量、氨氮、总氮和总磷的去除率分别为89%、85%、83%、83% 和64%。高水力负荷和低水力负荷(16 cm/d 和32 cm/d)对于塔式复合人工湿地结构的性能没有显著的影响。通过硝化活性和硝化速率的测定,发现硝化和反硝化是湿地脱氮的主要机理。塔式复合人工湿地结构同样具有观赏的价值。 关键词: 人工湿地;硝化作用;反硝化作用;生活污水;脱氮;硝化细菌;反硝化细菌 1. 前言 对于提高水源水质的广泛需求,尤其是提高饮用水水源水质的需求是目前废水深度处理的技术发展指向。在中国的乡镇地区,生活污水是直接排入湖泊、河流、土壤、海洋等水源中。这些缺乏处理的污水排放对于很多水库、湖泊不能达到水质标准是有责任的。许多位于中国的乡镇地区的社区缺乏足够的生活污水处理设备。由于山区地形、人口分散、经济基础差等原因,废水的收集和处理是很成问题的。由于资源短缺,经济欠发达地区所采取的废水处理技术必须低价高效,并且要便于施用,能量输入及维护费用较低,而且要保证出水能达标。建造在城市中基于活性污泥床的废水集中处理厂,对于小乡镇缺乏经济适用性,主要是由于污水收集结构的建造费用高。 1Ecological Engineering,Fen xia ,Ying Li。