g-Factor Tuning and Manipulation of Spins by an Electric Current
g-Factor Tuning and Manipulation of Spins by an Electric Current
Zbyslaw Wilamowski,1, 2 Hans Malissa,1 Friedrich Sch¨?er,1 and Wolfgang Jantsch1 a
1
Institut f¨r Halbleiter- und Festk¨rperphysik, Johannes Kepler Universit¨t, A-4040 Linz, Austria u o a 2 Institute of Physics, Polish Academy of Sciences, Al. Lotnikov 32/46, PL 02-668, Warsaw, Poland (Dated: February 6, 2008)
arXiv:cond-mat/0610046v1 [cond-mat.other] 2 Oct 2006
We investigate the Zeeman splitting of two-dimensional electrons in an asymmetric silicon quantum well, by electron-spin-resonance (ESR) experiments. Applying a small dc current we observe a shift in the resonance ?eld due to the additional current-induced Bychkov-Rashba (BR) type of spin-orbit (SO) ?eld. This ?nding demonstrates SO coupling in the most straightforward way: in the presence of a transverse electric ?eld the drift velocity of the carriers imposes an e?ective SO magnetic ?eld. This e?ect allows selective tuning of the g-factor by an applied dc current. In addition, we show that an ac current may be used to induce spin resonance very e?ciently.
PACS numbers: 85.75.-d, 73.63.Hs, 75.75.+a, 76.30.-v
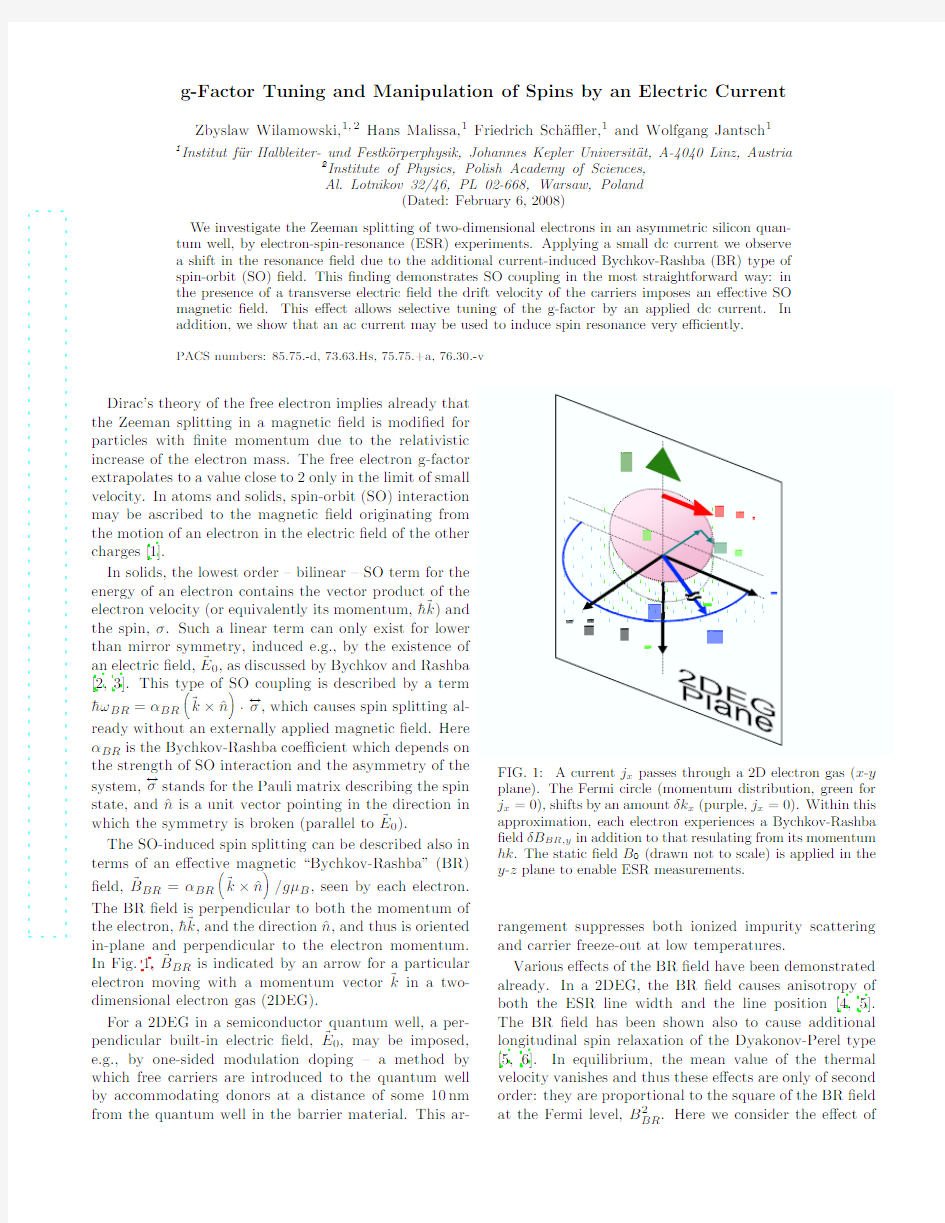
Dirac’s theory of the free electron implies already that the Zeeman splitting in a magnetic ?eld is modi?ed for particles with ?nite momentum due to the relativistic increase of the electron mass. The free electron g-factor extrapolates to a value close to 2 only in the limit of small velocity. In atoms and solids, spin-orbit (SO) interaction may be ascribed to the magnetic ?eld originating from the motion of an electron in the electric ?eld of the other charges [1]. In solids, the lowest order – bilinear – SO term for the energy of an electron contains the vector product of the electron velocity (or equivalently its momentum, hk) and ˉ the spin, σ. Such a linear term can only exist for lower than mirror symmetry, induced e.g., by the existence of an electric ?eld, E0 , as discussed by Bychkov and Rashba [2, 3]. This type of SO coupling is described by a term ? ? h ˉ ωBR = αBR k × n · σ , which causes spin splitting already without an externally applied magnetic ?eld. Here αBR is the Bychkov-Rashba coe?cient which depends on the strength of SO interaction and the asymmetry of the ? system, σ stands for the Pauli matrix describing the spin state, and n is a unit vector pointing in the direction in ? which the symmetry is broken (parallel to E0 ). The SO-induced spin splitting can be described also in terms of an e?ective magnetic “Bychkov-Rashba” (BR) ? ?eld, BBR = αBR k × n /gμB , seen by each electron. The BR ?eld is perpendicular to both the momentum of the electron, hk, and the direction n, and thus is oriented ˉ ? in-plane and perpendicular to the electron momentum. In Fig. 1, BBR is indicated by an arrow for a particular electron moving with a momentum vector k in a twodimensional electron gas (2DEG). For a 2DEG in a semiconductor quantum well, a perpendicular built-in electric ?eld, E0 , may be imposed, e.g., by one-sided modulation doping – a method by which free carriers are introduced to the quantum well by accommodating donors at a distance of some 10 nm from the quantum well in the barrier material. This ar-
FIG. 1: A current jx passes through a 2D electron gas (x-y plane). The Fermi circle (momentum distribution, green for jx = 0), shifts by an amount δkx (purple, jx = 0). Within this approximation, each electron experiences a Bychkov-Rashba ?eld δBBR,y in addition to that resulating from its momentum h ˉ k. The static ?eld B0 (drawn not to scale) is applied in the y-z plane to enable ESR measurements.
rangement suppresses both ionized impurity scattering and carrier freeze-out at low temperatures. Various e?ects of the BR ?eld have been demonstrated already. In a 2DEG, the BR ?eld causes anisotropy of both the ESR line width and the line position [4, 5]. The BR ?eld has been shown also to cause additional longitudinal spin relaxation of the Dyakonov-Perel type [5, 6]. In equilibrium, the mean value of the thermal velocity vanishes and thus these e?ects are only of second order: they are proportional to the square of the BR ?eld 2 at the Fermi level, BBR . Here we consider the e?ect of
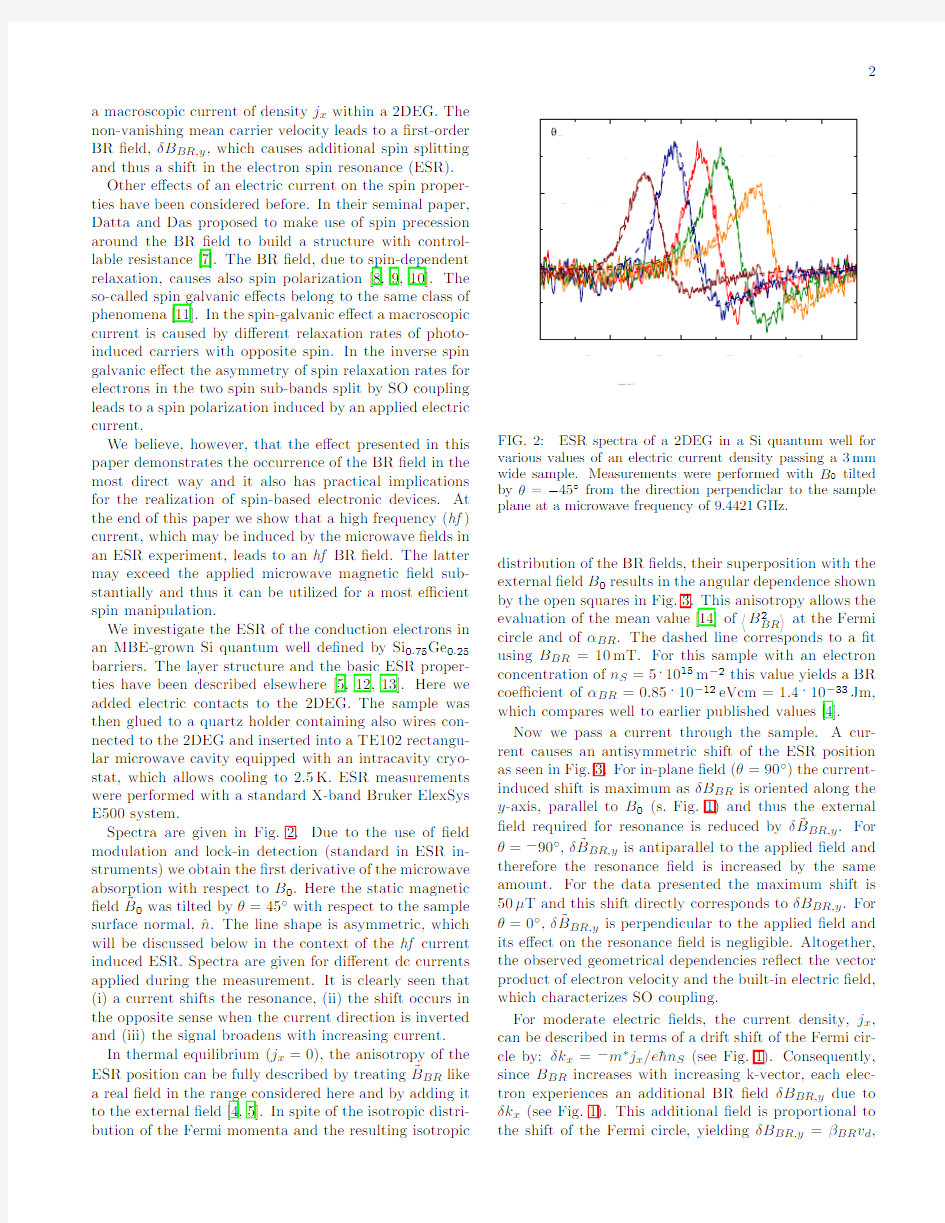
2 a macroscopic current of density jx within a 2DEG. The non-vanishing mean carrier velocity leads to a ?rst-order BR ?eld, δBBR,y , which causes additional spin splitting and thus a shift in the electron spin resonance (ESR). Other e?ects of an electric current on the spin properties have been considered before. In their seminal paper, Datta and Das proposed to make use of spin precession around the BR ?eld to build a structure with controllable resistance [7]. The BR ?eld, due to spin-dependent relaxation, causes also spin polarization [8, 9, 10]. The so-called spin galvanic e?ects belong to the same class of phenomena [11]. In the spin-galvanic e?ect a macroscopic current is caused by di?erent relaxation rates of photoinduced carriers with opposite spin. In the inverse spin galvanic e?ect the asymmetry of spin relaxation rates for electrons in the two spin sub-bands split by SO coupling leads to a spin polarization induced by an applied electric current. We believe, however, that the e?ect presented in this paper demonstrates the occurrence of the BR ?eld in the most direct way and it also has practical implications for the realization of spin-based electronic devices. At the end of this paper we show that a high frequency (hf ) current, which may be induced by the microwave ?elds in an ESR experiment, leads to an hf BR ?eld. The latter may exceed the applied microwave magnetic ?eld substantially and thus it can be utilized for a most e?cient spin manipulation. We investigate the ESR of the conduction electrons in an MBE-grown Si quantum well de?ned by Si0.75 Ge0.25 barriers. The layer structure and the basic ESR properties have been described elsewhere [5, 12, 13]. Here we added electric contacts to the 2DEG. The sample was then glued to a quartz holder containing also wires connected to the 2DEG and inserted into a TE102 rectangular microwave cavity equipped with an intracavity cryostat, which allows cooling to 2.5 K. ESR measurements were performed with a standard X-band Bruker ElexSys E500 system. Spectra are given in Fig. 2. Due to the use of ?eld modulation and lock-in detection (standard in ESR instruments) we obtain the ?rst derivative of the microwave absorption with respect to B0 . Here the static magnetic ?eld B0 was tilted by θ = 45? with respect to the sample surface normal, n. The line shape is asymmetric, which ? will be discussed below in the context of the hf current induced ESR. Spectra are given for di?erent dc currents applied during the measurement. It is clearly seen that (i) a current shifts the resonance, (ii) the shift occurs in the opposite sense when the current direction is inverted and (iii) the signal broadens with increasing current. In thermal equilibrium (jx = 0), the anisotropy of the ESR position can be fully described by treating BBR like a real ?eld in the range considered here and by adding it to the external ?eld [4, 5]. In spite of the isotropic distribution of the Fermi momenta and the resulting isotropic
= -45 deg
j = 0
x
EPR Derivative Signal (a.u.)
j =-0.3 A/m
x
j =0.3 A/m
x
j =-0.6 A/m
x
j =0.6 A/m
x
0.3381
0.3382
0.3383
0.3384
Magnetic Field (T)
FIG. 2: ESR spectra of a 2DEG in a Si quantum well for various values of an electric current density passing a 3 mm wide sample. Measurements were performed with B0 tilted by θ = ?45? from the direction perpendiclar to the sample plane at a microwave frequency of 9.4421 GHz.
distribution of the BR ?elds, their superposition with the external ?eld B0 results in the angular dependence shown by the open squares in Fig. 3. This anisotropy allows the 2 evaluation of the mean value [14] of BBR at the Fermi circle and of αBR . The dashed line corresponds to a ?t using BBR = 10 mT. For this sample with an electron concentration of nS = 5 · 1015 m?2 this value yields a BR coe?cient of αBR = 0.85 · 10?12 eVcm = 1.4 · 10?33 Jm, which compares well to earlier published values [4]. Now we pass a current through the sample. A current causes an antisymmetric shift of the ESR position as seen in Fig. 3. For in-plane ?eld (θ = 90? ) the currentinduced shift is maximum as δBBR is oriented along the y-axis, parallel to B0 (s. Fig. 1) and thus the external ?eld required for resonance is reduced by δ BBR,y . For θ = ?90? , δ BBR,y is antiparallel to the applied ?eld and therefore the resonance ?eld is increased by the same amount. For the data presented the maximum shift is 50 μT and this shift directly corresponds to δBBR,y . For θ = 0? , δ BBR,y is perpendicular to the applied ?eld and its e?ect on the resonance ?eld is negligible. Altogether, the observed geometrical dependencies re?ect the vector product of electron velocity and the built-in electric ?eld, which characterizes SO coupling. For moderate electric ?elds, the current density, jx , can be described in terms of a drift shift of the Fermi circle by: δkx = ?m? jx /eˉ nS (see Fig. 1). Consequently, h since BBR increases with increasing k-vector, each electron experiences an additional BR ?eld δBBR,y due to δkx (see Fig. 1). This additional ?eld is proportional to the shift of the Fermi circle, yielding δBBR,y = βBR vd ,
3
= -90°
Resonance Field (T)
Mean BR Field (T)
j =0.3 A/m
x
n =2.7x10
s
15
m
-2
1x10
-4
=2.8x10
-4
Tm/A
0.3383
0
n =5x10
s
15
m
-2
=1.5x10
-4
Tm/A
n =3.3x10
15
-1x10
-4
s
m
-2
=2.3x10
-4
Tm/A
-0.6
-0.4
-0.2
0.0
0.2
0.4
0.6
0.8
0.3382
Current Density (A/m)
j =-0.3 A/m
x
n =5 x 10 s
15
m
-2
-90
-60
-30
0
30
60
90
Direction of Magnetic Field
FIG. 4: Dependence of the resonance shift for in-plane orientation of B0 on the dc electric current density for three samples of di?erent sheet carrier concentration, nS .
FIG. 3: Angular dependence of the ESR ?eld for a current J = 0 (squares) and ±1 mA (open and full circles, respectively). The electron concentration is nS = 5 · 1015 m?2 and the sample width 3 mm. Error bars correspond to 20% of the resonance line width.
where βBR = αBR m? /gμB ˉ is a material parameter and h vd stands for the drift velocity. The current-induced resonance shift is thus expected to change linearly with current, where the slope η = δBBR,y /jx = βBR /enS is proportional to αBR and inversely proportional to nS . Our experiments con?rm this as shown in Fig. 4. The dependence of the resonance shift (for in-plane orientation) on the current density is shown for 3 samples with di?erent electron concentrations. The constant slope, η, is larger for smaller nS . The experimental value of η allows for an independent evaluation of the BR parameter, αBR . Within the experimental error of about 20%, all values for αBR , as obtained from the ratio η, are equal to those obtained from the anisotropy of the resonance ?eld in the absence of an electric current and independent of temperature. From the observed e?ect of a dc current we may also infer that high frequency e?ective ?elds can be generated by an hf current. The latter is limited in frequency only by the momentum scattering rate and therefore effective microwave magnetic ?elds can be generated this way. High frequency ?elds are of particular interest as they can be used to excite ESR. Using microwave pulses of speci?c duration, the magnetization can be turned by any Rabi angle, as has been demonstrated in spin-echo experiments [15]. In a classical ESR experiment, we are looking for magnetic dipole transitions. Therefore the sample is placed in the node of the electric ?eld within a microwave cavity in order to minimize losses due to conductance ef-
fects. Nevertheless, microwave currents within the high mobility 2DEG are evident in our experiment from the appearance of cyclotron resonance [5] which may cause electric currents and thus additional BR ?elds. We ?nd evidence for the hf BR ?eld from an analysis of the ESR amplitude and line shape. The latter (see Fig. 2) shows some asymmetric, dispersive component, similar to the Dysonian line shape discussed for 3D metals [16, 17]. Modi?cation of Dyson’s model for 2D samples yields, however, only a pure absorption signal. Here the phase shift of the hf BR ?eld with respect to the microwave electric ?eld must be taken into account to explain the line shapes observed. Our quantitative modeling explains the relative magnitude of dispersive and absorption signals as a function of microwave power and geometry [18]. We conclude that the appearance of a dispersive signal component in a 2DEG is a strong indication for a current-induced BR ?eld. Experimentally we investigated also the in?uence of the orientation of the 2DEG relative to B0 and the microwave magnetic ?eld, B1 , which is oriented in the xdirection in Fig. 1. Rotating the sample within the cavity about the x and z directions, we ?nd qualitative agreement with the model. The highest signal is obtained if the 2DEG is perpendicular to B1 . In that case, B1 very e?ciently induces eddy currents within the 2DEG, which in turn cause an additional microwave magnetic BR ?eld that is much stronger than the original microwave magnetic ?eld. The expected gain in ESR excitation, and the resulting Rabi frequency is proportional the electron mobility in the 2DEG and for state of the art mobilities in Si quantum wells we estimate gain values of 103 and more. The demonstrated e?ect of a current-induced spin resonance is somehow similar to the known e?ect of the electric dipole spin resonance [3, 19]. Both e?ects orig-
4 inate from a time modulation of the SO ?eld. Electric dipole transitions originate, however, from the modulation of the electric ?eld while the current-induced e?ect comes from the modulation of the carrier velocity. The presented experimental data demonstrate the occurrence of a current-induced spin orbit ?eld. A dc current allows tuning of the ESR frequency (and thus the g-factor), while a high frequency current occurs to be a very e?ective tool for spin excitation, or generally, for spin manipulation. This method of spin tuning and manipulation can be applied locally, e.g., to a nano-wire without heating of the rest of a sample in contrast to methods employing a resonator. Both the Rabi frequency and the spin relaxation rate increase with increasing SO coupling. SO coupling in III-V compounds is by up to three orders of magnitude stronger than in Si. Here the Rabi frequency scales linearly with the SO interaction and the line width with the square of it. Therefore, materials such as Si are much better suited if a large shift-to-line width-ratio of the ESR is needed. On the other hand, we expect a higher e?ciency for the current-induced spin manipulation for III-V compounds. The current-induced shift of the spin resonance described in this paper is probably the most direct and conceptually simplest e?ect of SO interaction in solids. Moreover, the ratio of the g-shift and current density is ruled by the BR parameter and the carrier density only, but it is independent of temperature, electron mobility or details of spin relaxation. This work was supported by the Fonds zur F¨rderung o der Wissenschaftlichen Forschung (Project P16631¨ N08), and the OAD, both Vienna, Austria, and in Poland by KBN.
pp. 1–98. [2] Yu. A. Bychkov and E. I. Rashba, J. Phys. C 17, 6039 (1984). [3] E. I. Rashba and V. I. Sheka, in Landau Level Spectroscopy, edited by G. Landwehr and E. I. Rashba (North-Holland, Amsterdam, 1991), vol. 1, pp. 131–206, and references therein. [4] Z. Wilamowski, W. Jantsch, H. Malissa, and U. R¨ssler, o Phys. Rev. B 66, 195315 (2002). [5] Z. Wilamowski and W. Jantsch, Phys. Rev. B 69, 035328 (2004). [6] M. I. Dyakonov and V. I. Perel, Sov. Phys. JETP 38, 177 (1973). [7] S. Datta and B. Das, Appl. Phys. Lett. 56, 665 (1990). [8] V. M. Edelstein, Sol. St. Comm. 73, 233 (1990). [9] A. Yu. Silov, P. A. Blajnov, J. H. Wolter, R. Hey, K. H. Ploog, and N. S. Averkiev, Appl. Phys. Lett. 85, 5929 (2004). [10] V. Sih, R. C. Myers, Y. K. Kato, W. H. Lau, A. C. Gossard, and D. D. Awschalom, Nature Phys. 1, 31 (2005). [11] S. D. Ganichev, E. L. Ivchenko, V. V. Bel’kov, S. A. Tarasenko, M. Sollinger, D. Weiss, W. Wegscheider, and W. Prettl, Nature 417, 153 (2002). [12] Z. Wilamowski, N. Sandersfeld, W. Jantsch, D. T¨bben, o and F. Sch¨?er, Phys. Rev. Lett. 87, 026401 (2001). a [13] K. Lai, W. Pan, D. C. Tsui, S. Lyon, M. M¨hlberger, u and F. Sch¨?er, Phys. Rev. Lett. 93, 156805 (2004). a [14] The characteristic time in measuring ESR is the inverse linewidth. Here it is of the order of 1 μs, i.e., very long as compared to the momentum relaxation time of about 10?11 s. As a result, the ESR data yield the mean BR ?eld of the ensemble rather than the BR ?eld seen by individual electrons (see also Ref. [6]). [15] A. M. Tyryshkin, S. A. Lyon, W. Jantsch, and F. Schaf?er, Phys. Rev. Lett. 94, 126802 (2005). [16] G. Feher and A. F. Kip, Phys. Rev. 98, 337 (1955). [17] F. J. Dyson, Phys. Rev. 98, 349 (1955). [18] Z. Wilamowski and W. Jantsch, unpublished. [19] M. Dobrowolska, Y. F. Chen, J. K. Furdyna, and S. Rodriguez, Phys. Rev. Lett. 51, 134 (1983).
[1] Y. Yafet, in Solid State Physics, edited by F. Seitz and D. Turnbull (Academic Press, New York, 1963), vol. 14,
ASPEN PLUS 反应器模拟教程
简介 什么是Process Flowsheet Process Flowsheet(流程图)可以简单理解为设备或其一部分的蓝图.它确定了所有的给料流,单元操作,连接单元操作的流动以及产物流.其包含的操作条件和技术细节取决于Flowsheet 的细节级别.这个级别可从粗糙的草图到非常精细的复杂装置的设计细节. 对于稳态操作,任何流程图都会产生有限个代数方程。例如,只有一个反应器和适当的给料和产物,方程数量可通过手工计算或者简单的计算机应用来控制。但是,当流程图复杂程度提高,且带有很多清洗流和循环流的蒸馏塔、换热器、吸收器等加入流程图时,方程数量很容易就成千上万了。这种情况下,解这一系列代数方程就成为一个挑战。然而,叫做流程图模拟的电脑应用专门解决这种大的方程组,Aspen PlusTM,ChemCadTM,PRO/IITM。这些产品高度精炼了用户界面和网上组分数据库。他们被用于在真是世界应用中,从实验室数据到大型工厂设备。 流程模拟的优点 在设备的三个阶段都很有用:研究&发展,设计,生产。在研究&发展阶段,可用来节省实验室实验和设备试运行;设计阶段可通过与不同方案的对比加速发展;生产阶段可用来对各种假设情况做无风险分析。 流程模拟缺点 人工解决问题通常会让人对问题思考的更深,找到新颖的解决方式,对假设的评估和重新评估更深入。流程模拟的缺点就是缺乏与问题详细的交互作用。这是一把双刃剑,一方面可以隐藏问题的复杂性使你专注于手边的真正问题,另一方面隐藏的问题可能使你失去对问题的深度理解。 历史 AspenPlusTM在密西根大学 界面基础 启动AspenPlus,一个新的AspenPlus对象有三个选项,可以Open an Existing Simulation,从Template开始,或者用BlankSimulation创建你的工作表。这里选择blank simulation。
(完整)反应器初步设计说明书
1
目录 第 1 章反应器设计 (1) 1.1 反应器设计概述 (1) 1.2 反应器的选型 (1) 第 2 章催化剂 (3) 2.1 催化剂的选择 (3) 2.2 催化剂失活的原因 (3) 2.3 催化剂再生的方法 (3) 第 3 章丙烷脱氢反应器 (4) 3.1 主反应及副反应方程式 (4) 3.2 反应机理 (4) 3.3 动力学方程 (4) 3.3.1 催化反应动力学模型 (4) 3.3.2 失活动力学 (5) 3.4 反应器设计思路说明 (6) 3.4.1 反应条件 (6) 3.4.2 反应器类型的选择 (7) 3.4.3 反应器数学模拟 (7) 3.4.4 反应器体积的计算 (7) 3.5 催化剂设计 (11) 3.5.1 催化剂用量 (11) 3.5.2 催化剂来源 (11) 3.5.3 催化剂的装填 (11) 3.6 反应器内部结构设计 (11) 3.6.1 催化剂床层开孔 (11) 3.6.2 催化剂分布器 (12) 3.6.3 气体分布器 (12) 2
3.7 反应器管口计算 (12) 3.7.1 进料管(以第一台反应器为例) (12) 3.7.2 出料管 (13) 3.7.3 吹扫空气入口 (13) 3.7.4 催化剂进料口 (13) 3.7.5 催化剂出口 (13) 3.7.6 排净口 (13) 3.7.7 人孔 (14) 3.7.8 催化剂床层固定钢 (14) 3.8 加热炉 (14) 3.9 机械强度的计算和校核 (14) 3.9.1 反应器材料的选择 (14) 3.9.2 反应器筒体厚度的选择 (14) 3.9.3 反应器封头厚度的计算 (15) 3.9.4 液压试验校核 (16) 3.9.5 反应器强度校核 (16) 3.9.6 反应器封头的选择 (25) 3.10 设计结果总结(以第一台反应器为例) (26) 第 4 章乙炔选择性加氢反应器 (26) 4.1 概述 (26) 4.2 反应方程式 (27) 4.3 催化剂的选用 (27) 4.4 设计简述 (27) 4.5 在Polymath中的模拟与优化 (29) 4.6 选择性加氢反应器总结 (30) 第 5 章参考文献 (30) 3
搅拌式反应器的模拟与优化设计
搅拌式反应器的模拟与优化设计 摘要 在综述了计算流体力学(CFD)技术在搅拌式反应器中的研究进展的基础上,着重讨论了搅拌式反应器中流场的模拟方法, 包括“黑箱”模型法、内外迭代法、多重参考系法和滑移网格法, 并指出了CFD技术的发展方向。在此基础上, 对反应器内流场的数学模型进行了介绍与评价。最后提出应用人工神经网络技术与遗传算法, 优化生物反应的工艺操作条件, 并结合CFD技术, 实现生物反应器的结构优化, 从而达到对生物反应系统整体优化的目的, 以指导实验与工业生产。 关键词计算流体力学,搅拌式反应器,数值模拟,人工神经网络,优化设计Simulation and optimization design of Stirred reactor Abstract: Base on the overview of computational fluid dynamics (CFD) technology in the stirred reactor research,we focused on the mixing reactor simulation of the flow field, including "black box" model of law, internal and external iteration, multiple reference frame method and the sliding mesh method, and pointed out the direction of development of CFD technology. On these basis,we described and evaluated the reactor flow mathematical model.We concludes with the application of artificial neural network and genetic algorithm to optimize the process operating conditions, biological response, and results combined CFD technology to achieve optimization of the structure of the bioreactor, so as to achieve overall optimization of the bioreactor system aims to guide experiments and industrial production. Keyword: computational fluid dynamics, stirred reactor, numerical simulation, artificial neural networks, optimization 第1章前言 搅拌式反应器( Stirred Tank Reactor, STR)因其结构灵活、操作方式多样