雅思A类小作文高阶-较难的图表写法和范例大汇总-T1_Tables_Collection_Hard
T1_Tables_Collection
IELTS Writing Task 1: 'table' essay
Today I'm going to explain my thinking process when I answer an IELTS Writing Task 1 question. We'll use this question (
Cambridge IELTS 7, page 30):
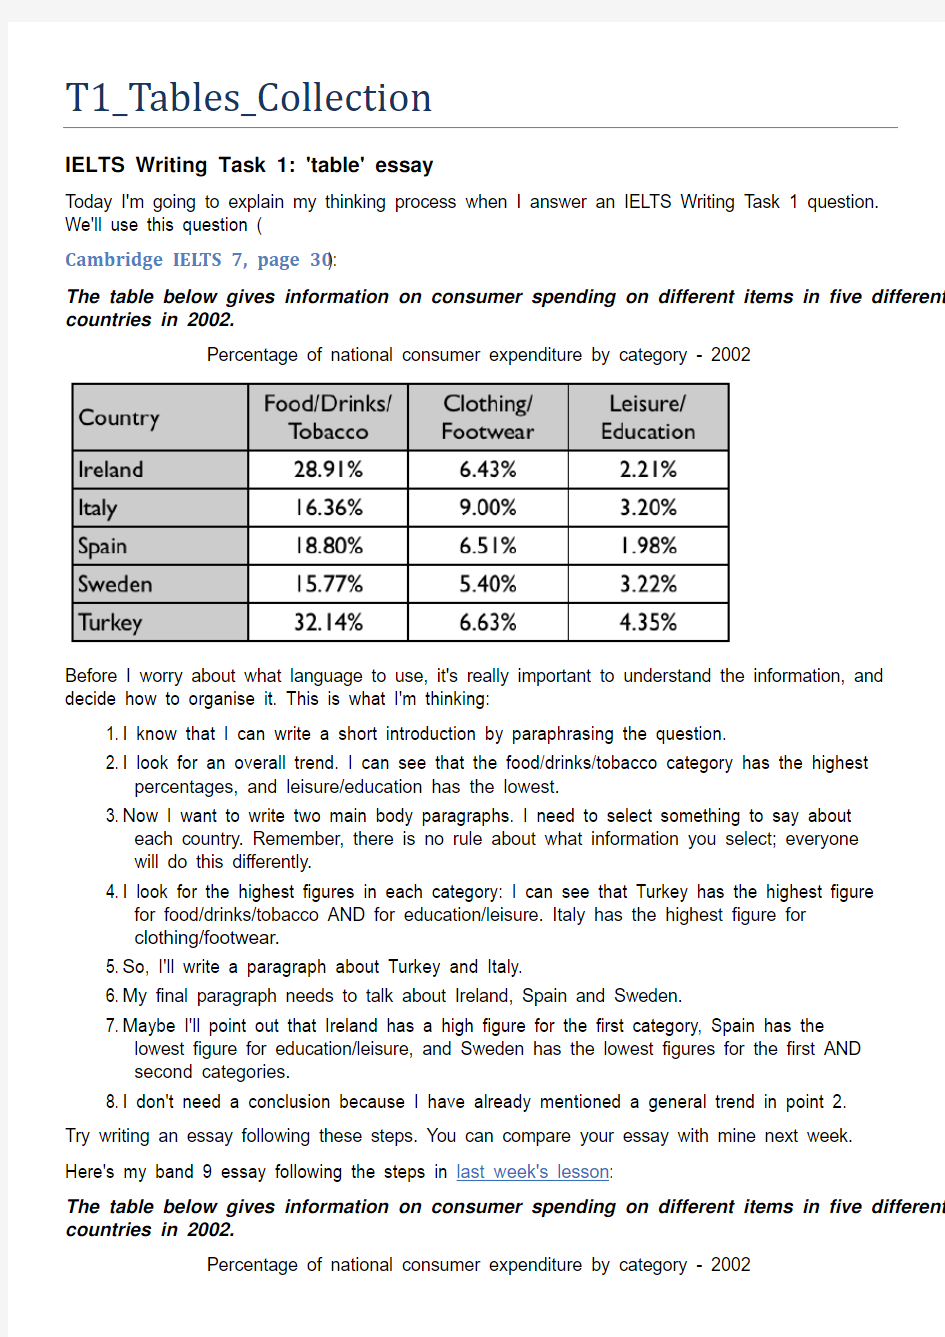
The table below gives information on consumer spending on different items in five different countries in 2002.
Percentage of national consumer expenditure by category - 2002
Before I worry about what language to use, it's really important to understand the information, and decide how to organise it. This is what I'm thinking:
1. I know that I can write a short introduction by paraphrasing the question.
2. I look for an overall trend. I can see that the food/drinks/tobacco category has the highest
percentages, and leisure/education has the lowest.
3. N ow I want to write two main body paragraphs. I need to select something to say about
each country. Remember, there is no rule about what information you select; everyone
will do this differently.
4. I look for the highest figures in each category: I can see that Turkey has the highest figure
for food/drinks/tobacco AND for education/leisure. Italy has the highest figure for
clothing/footwear.
5. S o, I'll write a paragraph about Turkey and Italy.
6. M y final paragraph needs to talk about Ireland, Spain and Sweden.
7. M aybe I'll point out that Ireland has a high figure for the first category, Spain has the
lowest figure for education/leisure, and Sweden has the lowest figures for the first AND
second categories.
8. I don't need a conclusion because I have already mentioned a general trend in point 2.
Try writing an essay following these steps. You can compare your essay with mine next week. Here's my band 9 essay following the steps in last week's lesson:
The table below gives information on consumer spending on different items in five different countries in 2002.
Percentage of national consumer expenditure by category - 2002
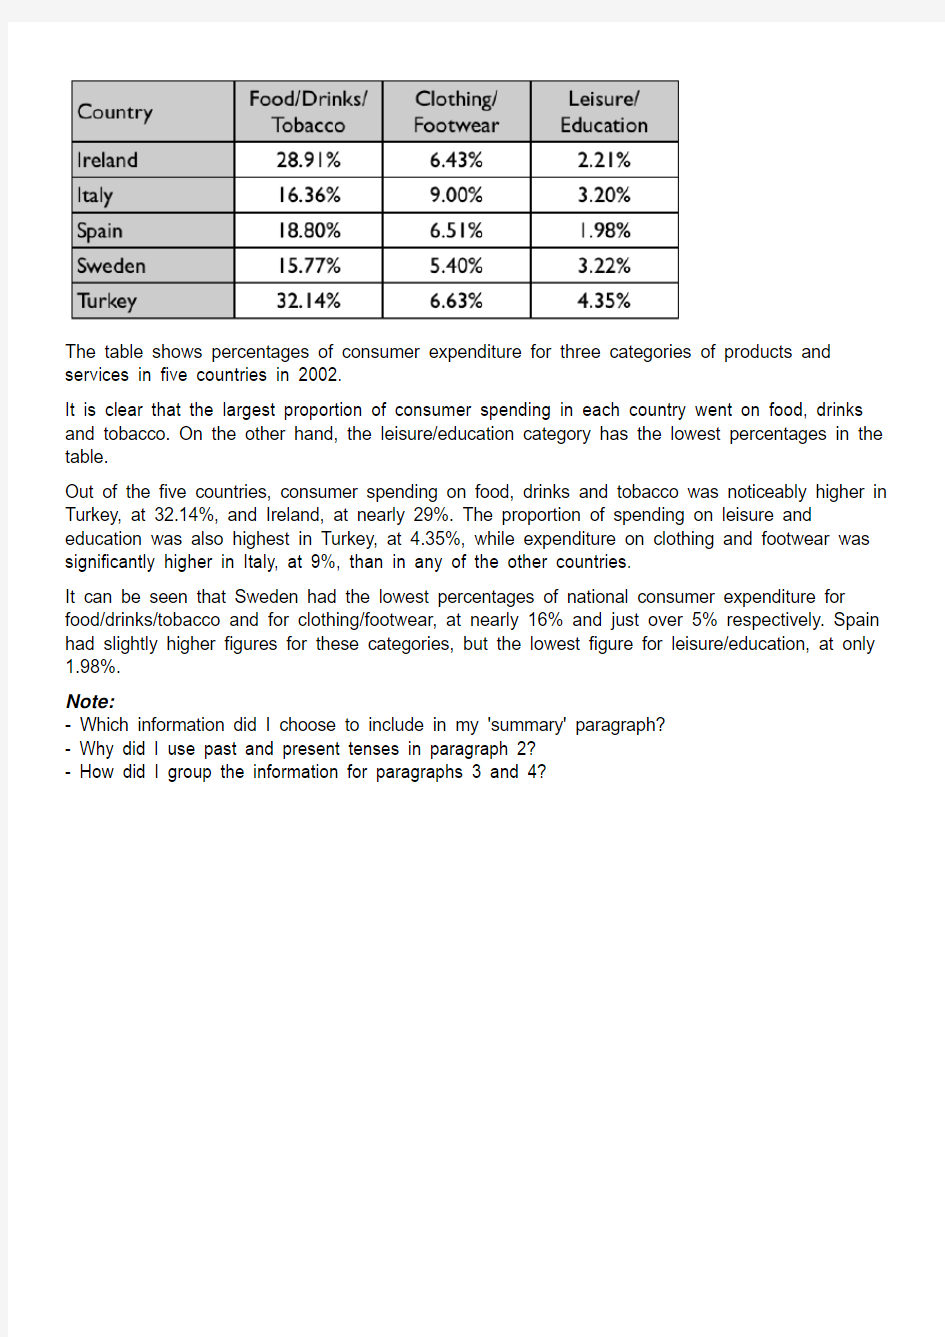
The table shows percentages of consumer expenditure for three categories of products and services in five countries in 2002.
It is clear that the largest proportion of consumer spending in each country went on food, drinks and tobacco. On the other hand, the leisure/education category has the lowest percentages in the table.
Out of the five countries, consumer spending on food, drinks and tobacco was noticeably higher in Turkey, at 32.14%, and Ireland, at nearly 29%. The proportion of spending on leisure and education was also highest in Turkey, at 4.35%, while expenditure on clothing and footwear was significantly higher in Italy, at 9%, than in any of the other countries.
It can be seen that Sweden had the lowest percentages of national consumer expenditure for food/drinks/tobacco and for clothing/footwear, at nearly 16% and just over 5% respectively. Spain had slightly higher figures for these categories, but the lowest figure for leisure/education, at only 1.98%.
Note:
- Which information did I choose to include in my 'summary' paragraph?
- Why did I use past and present tenses in paragraph 2?
- How did I group the information for paragraphs 3 and 4?
Q13. Task 1 - Graph (Solved) (Table graph)
Solution:
The two tabular charts depict the visits abroad by UK residents by purpose of visit and the destinations of visits for the years 1994 to 1998.
At the first glance, it is observed that the main reason for traveling abroad has been the holidays in all the 5 years followed by business and visits to friends and relatives. There was an approximate 30% increase in the holiday figures from 1994 to 1998 while in other purposes the figures inclined slightly. The maximum visits abroad by UK residents were in 1998.
Moving further, Western Europe was the favorite destination for UK residents traveling abroad and the figure jumped by an approximate 25% in 5 years. Visits to North America doubled from 919 to 1823 from the years 1994 to 1998.
Overall, the biggest reason for visits abroad was holidays and the favorite destination was Western Europe. Sample task
You should spend about 20 minutes on this task.
Write a report for a university lecturer describing the information in the table below. Write at least 150 words.
Your task
Complete the Task One report exercise above. Spend only 20 minutes.Then look at the notes and the sample answer below.
Sample answers
We will now compare two sample answers, one better than the other. How well does each one follow the guidelines? Sample answer 1
The table shows how people in different age groups spent their leisure time in Someland. It can be clearly seen that the amount of leisure time available varied considerably across the age groups.
Teenagers in Someland spent 1,200 hours a year watching TV and those in the over 70s group spent 100 hours less at 1,100. They spent 150 hours on socialising with 4 or less people compared with 200 hours at the other end of the scale. They spent 350 hours socialising with 4 or more people compared with 25 hours. The teenagers spent 450 hours on group exercise but retired people didn?t do any.
In conclusion, we can see that in Someland the teenagers and retired people prefer to spend their free time in different ways.
Teacher's comments on the sample answer
“The report structure is clear and well organised with an introduction, body and conclusion.
The candidate uses repetitive grammatical structures and vocabulary which would bring the mark down considerably. The tense used is not appropriate as there is no indication on the table that the figures refer to the past. Also the reader doesn?t know who is being referred to in the two sentences on socialising. The word …prefer? in the conclusion is inappropriate because the table does not give any indication of people?s reasons for spending their time on one activity rather than another. Someone may choose indoor rather than outdoor activities because of their health although they would prefer to go outside.
In terms of task requirements the report has serious problems. Although in writing about a table you will have the difficulty of there being too much information to put into a 150 word report, you can?t solve this problem by ignoring whole sections of the table. In this case the candidate simply compared two age levels and ignored the rest.”
Sample answer 2
The table shows how people in different age groups spend their leisure time in Someland over the course of a year. It can be clearly seen that the amount of leisure time available varies considerably across the age groups and that people of different age levels have very different ways of spending their leisure time.
According to the figures, as people age in Someland their social lives reduce. Teenagers and people in their twenties spend on average 500 hours per year on socialising and 350 hours of that time is with a group of more than 4 people. Although the total hours of socialising in their 30s, 40s, 50s and 60s is fairly constant (between 300-350), socialising with more than 4 people drops dramatically to 50 hours in the 30s and 40s age groups and only 25 from 50 years old. Group and individual exercise follow a similar pattern.
People of all ages spend a good part of their leisure time on entertainment such as TV/video viewing and cinema. In both cases, teenagers and retired people spend around twice as much time as those who are at working age. Home entertainment ranges from just over a thousand hours for teenagers and retired people and an average of 600 hours for everyone else. Cinema accounts for 100 hours of the teenagers and retired people?s leisure time and 25-50 hours for the rest.
In conclusion we can see there is a significant trend towards solitary and smaller group activities as people grow older and that teenagers and retired people spend a lot more time on entertainment than those of working age do.
Strategies for improving your IELTS score
Selecting information
Like the line graphs your report should be structured simply with an introduction, body and conclusion. Tenses should be used appropriately.
Use two standard opening sentences to introduce the table and your report. These opening sentences should make up the first paragraph. Sentence one should define what the table is about; that is, the date, location, what is being described in the graphs etc. For example:
The table shows how people in different age groups spend their leisure time in Someland over the course of a year.
Notice that the sample opening sentence does not simply copy the words used on the graphic material. Copied sentences will not be assessed by the examiner and so you waste your time including them.
Sentence two (and possibly three) might sum up the overall trend. For example:
It can be clearly seen that the amount of leisure time available varies considerably across the age groups and that people of different age levels have very different ways of spending their free time.
Notice the tense used. In this case there is no date given and so we must take the table information as being current now.
The body of the report will describe the information presented in the table in detail. You will need to decide on the most clear and logical order to present the material. Generally you will choose one of the categories given in the table; that is, the age or activity in the example task above. Your choice would depend on whether you could see the most significant trends occurring by age group or by activity. In this case distinguishing the age group is your primary concern in describing this table, and you would do this by highlighting some differences between the activity
preferences of the age groups.
Ideally your report should end with one or two sentences which summarise your report or draw a relevant conclusion.
Grammar and vocabulary
You will receive a higher mark if your writing uses a range of structures and vocabulary correctly rather than a limited number.
Selecting your information
In completing this task it is important that you cover all of the information given. However, this does not mean that you should note every detail. In tables there is invariably too much information for you to mention each figure. You will therefore need to summarise the table in meaningful segments. In other words, you will describe the significant trends in your report.
To see the trends in a table, start by finding patterns under the horizontal and vertical headings. In the sample task you would analyse the age groups and activities. We can see that at different times in their lives Someland people have more or less free time and their priorities for how they spend their free time are different. In analysing the activities we can look for which age groups spend more time on individual or group, cheap or expensive, home or outdoor, strenuous or restful activities. By describing trends in this way, we can avoid having to describe every age group across every activity.
SAMPLE #14 WRITING TASK 1(20 MINS)(AT LEAST 150 WORDS)(ACADEMIC)
[SUBSCRIBE TO POST-PAY W1 or PRE-PAY PP3 [ Basic Plan] for writing training only and know the strategies and tips to achieve your intended score with live trainer evaluating your tasks. Subscribe to PRE-PAY PP4 to learn complete IELTS tests and achieve your target band.Contact us now!!!]
The tables below show information on Australian tourism
for the years 1991 to 1999.The first shows the number of visitors coming to Australia and the second shows the number of Australian residents traveling overseas.Write a report for a university lecturer describing the information shown below.
[NOTE:- If you are unable to view this picture clearly, click here AUSTRALIAN TRAVELERS]
SUGGESTED APPROACH
The answer should clearly cover the information given adequately by comparing the numbers leaving and departing rather than focusing on each group individually.
SAMPLE ANSWER
There were 4,459,510 visitors in 1999, representing a 7% increase in visitor arrivals from 1998.This increase indicates a recovery from the 3.5% decline in visitor arrivals experienced in 1998, which was uncharacteristic of the high increases recorded earlier in the decade.
While the number of foreign visitors. coming to Australia increased in 1999 after a fall in 1998, the number of Australian residents departing for overseas has been increasing over the last six years.Until 1996 the annual percentage increase in Australians visiting overseas was smaller than the increase in visitor arrivals. However, in 1997 and 1998 the percentage increase in Australians traveling abroad was greater than the increase in international visitors coming to Australia, with those departing up by 7% and 8% respectively when compared with visitors arriving (up 4% in 1997, and down 4% in 1998). In 1999 the 7% increase of inbound visitors compared with only a 15% increase in outbound visitors. The number of inbound visitors remained higher than the number of outbound visitors, by just over 1.2 million persons in 1999.(177 words)[Band 9]
Look at this table and complete the description. For some spaces you may need to use more than one word.
The table shows how _____ money people spent on 4 different items in the United Kingdom in 1998. It is immediately apparent that adults spent _____of their money on food, electronic equipment, music and videos than children did. Adults spent just over a _______ of their income on these items, while children spent 84% of money on the same goods. One major difference between adult males and females is that women spent as much as 39% of their money shopping for food, whereas men spent more than _______ on food. While it seems that ____men or women spent a significant ______ of money on music and videos, we can see ______of men’s income went on electronic equipment in contrast to just1% for women.
Generally, boys and girls spent their money in a similar way. Music was the most popular item at around 40%, followed by videos at approximately 18% and food at just10%. The one striking difference between the genders was in electronic equipment. Here boys (18%) spent
almost ________ as much as girls (5%).
One conclusion is that there were differences in patterns of spending both in age and gender.
This is my answer. There may well be other possible correct answers. If you have something different you want checked, just leave a comment.
The table shows how much money people spent on 4 different items in the United Kingdom in 1998. It is immediately apparent that adults spent less of their money on food, electronic equipment, music and videos than children did. Adults spent just over a third of their income on these items, while children spent 84% of money on the same goods. One major difference between adult males and females is that women spent as much as 39% of their money shopping for food, whereas men
spent just over a third on food. While it seems that few men or women spent a significant amount of money on music and videos, we can see a tenth of men’s income went on electronic equipment in contrast to just 1% for women.
Generally, boys and girls spent their money in a similar way. Music was the most popular item at around 40%, followed by videos at approximately 18% and food at just 10%. The one striking difference between the genders was in electronic equipment. Here boys (18%) spent almost three times as much as girls (5%).
One conclusion is that there are differences in patterns of spending both in age and gender.
The table below presents the number of children ever born to women aged 40-44 years in Australia for each year the information was collected since 1981.
Summarise the information by selecting and reporting the main features, and make comparisons where relevant.
Write at least 150 words.
Number of children ever born, Women aged 40–44 years
Four or
One Two Three more
None child children children children
year % % % % %
2006 15.9 13.2 38.3 21.5 11.0
1996 12.8 11.3 38.2 24.6 13.1
1986 9.7 8.7 35.6 27.0 18.9
1981 8.5 7.6 29.0 27.4 27.6
Source: ABS Births Australia 2001, 2006 (3301.0)
Test Tip
You should …signpost? general statements, i.e. introduce them with expressions such as:
The table/pie chart/graph/etc. shows...
The most significant change...
Another noticeable trend...
Overall...
You must also support general statements with detailed information from the table/graph/etc.
Model answer 字数太多,不适合这么写
The table shows the number of children born to women aged 40–44 years in Australia in 1981, 1986, 1996 and 2001.
In 1981, women aged 40-44 years were only marginally more likely to have had two children than three children (29% vs 27.4%) or four or more children (27.6%). Similarly, by 1986, women of this age were considerably more likely to have given birth to two children than three children (35.6% vs 27%) or four or more children (18.9%).
In 1996 and 2006, the proportions of women aged 40-44 years who had given birth to two children were almost identical, though the proportions who had given birth to three children or to four or more children had decreased. In these more recent periods, women were more likely to have had two children than three or more children - a trend that was most marked in the most recent period (38.2% vs 24.6% in 1996; 38.3% vs 21.5% in 2006).
While two-child families now predominate, the number of women who had given birth to only one child increased progressively from 7.6% in 1981 to 13.2% in 2006.
In 1981, similar proportions of women aged in their early forties were childless or had given birth to only one child (8.5%
and 7.6% respectively). By 2006, 15.9% of women were childless and 13.2% had given birth to only one child.
Overall, by age 40-44 years, the proportion of women who have had three or more children has fallen considerably since the 1980s, while the proportions who have had no children, or only one or two children has increased.
(266 words)
Q26. Task 1 - Graph (Table)
Solution:
The tabular graph illustrates the percentage of British households who owned a range of consumer durables between 1972 and 1983.
From an overall view, it is apparent that the percentage of durables ownership increased over the years. The greatest increase was in telephone ownership, rising from 42% in 1972 to 77% in 1983. Next was the central heating ownership, rising from 37% of households in 1972 to 64% in 1983. The percentage of households with a refrigerator rose by 21% over the same period and of those with a washing machine by 14%.
Households with vacuum-cleaners, televisions and dishwashers increased by 8%, 5% and 2% respectively. In 1983, the year of their introduction, 18% of households had a video recorder. Over the period the proportion of British houses with central heating doubled and of those with a phone increased from under a half to over three-quarters.
There were also big increases in the ownership of washing machines and refrigerators, which suggests rising living standards of the British people over the period.
The chart below shows average hours and minutes spent by UK males and females on different daily activities.
I've made the following essay into a gap-fill exercise.
The table compares the average ______ of time per day that men and women in the UK spend
______ different activities.
It is clear that people in the UK spend more time ______ than doing any other daily activity. Also, there are significant differences between the time ______ by men and women on
employment/study and housework.
On average, men and women in the UK ______ for about 8 hours per day. Leisure ______
______ the second largest proportion of their time. Men spend 5 hours and 25 minutes doing various leisure activities, such as watching TV or doing sport, ______ women have 4 hours and 53 minutes of leisure time.
It is noticeable that men work or study for an average of 79 minutes more than women every day. By contrast, women spend 79 minutes more than men doing housework, and they spend ______ ______ as much time looking after children.
Fill the gaps using these words:
doing, up, over, spent, while, sleeping, sleep, twice, amount, takes
Posted by Simon in IELTS Writing Task 1 | Permalink
CORRECT ANSWERS FROM SIMON:
1. amount
2. doing
3. sleeping
4. spent
5. sleep
6. takes
7. up
8. while
9. over
10. twice
You should spend about 20 minutes on this task.
The table below shows the proportion of time different age groups spend on various Internet activities.
Summarise the information by selecting and reporting the main features, and making comparisons where relevant.
Sample Answer
The table provides information about the proportion of time people of different ages spend on different activities on the internet. The people are divided into 6 age groups which range from 10 to 50 years old and over. The categories of activity on the Internet include online shopping, browsing news and sports sites, game playing and social media use.
The information shows that Internet usage varies greatly between people of different ages. The youngest age group (10-15) spends the most time playing games while the oldest age group (50+) spends the least amount of time on this activity. People aged 16-40 spend more of their time on social network sites than those who are over 40 years old, with the 16-20 age group spending 51% of their time on this particular activity. Most adults participate in online shopping, those in the 30-39 age group spend more than a third of their time on this activity, while those over 50 years old only spend 10% of their time shopping.
Overall, older people, those over 40, spend most of their time on news and sports sites in contrast to younger people who play more games and spend more time on social media.
雅思写作大作文范文
雅思写作大作文范文 在英文写作中,逻辑关系至关重要。所以在实际教学中我们都会把逻辑关系作为一个很重要的内容来教授。这些逻辑关系主要涉及:并列或递进关系、让步或转折关系、因果关系和举例等。其中举例论证是一种很常用的论证方式,因为举例论证运用具体实例来论证观点,所以更具信服力,也更易于读者理解,因此受到作者及读者的普遍欢迎。下面专家将通过它的连接方式与您共同探讨一下举例论证以及如何举例子。 一、外显连接 如:it is undeniable that mobile phones have facilitated our lives in many different ways. For example, when an emergency ours, such as a traffic aident or a violent crime, mobile phones can help the victims to call the police or an ambulance immediately for help. 本例中,for example 引出例子论证“mobile phones have facilitated our lives in many different ways.”而后面的such as 则引出emergency 的具体形式。For instance 与它的用法完全相同,即后面要接句子例证。 Like, such as, take…as 等
直接名词(或相当于名词的词)。由于这些都是基本常识,这里不再赘述。 为了使连接词多样化,建议考生运用下面的一些短语(或句式)连接论点和论据:…is a case in point; …serve as a typical example;…can be taken as an example; one example is that… another one is that等。 如:Working part time when you are studying in university is beneficial to your life. I myself is a case in point(or ‘my experiences serve as a typical example’). Through those experiences, I have learned to be independent and responsible. 二、内化连接 实际上,大家看原汁原味的文英文文章会发现有些信息的连接不用外显式,而是通过某些特定的词或者特定的方式给读者以清晰的层次感,从而使文章信息传递更通畅。 下面我们来看一下哪些例证可以省去连接词,实现内化连接。
(完整版)剑桥雅思小作文表格及其他类的写法归纳
【表格的写法】 开头段: 中间段:1. 分析“行” 2. 分析“列” 结尾段:重述或补充说明总体特征(也可不写) *在描写行和列时注意避免重复,后写的可以概括一些 The table gives a breakdown of the different marriage figures in the UK during a long period from 1950 to 2000. The number of first marriages was 330 thousand in 1950, increasing steadily for the following two decades and peaking at 389 thousand in 1970. However, from then on, it experienced a sharp fall to 180 thousand in 2000, the lowest of the whole period. Similarly, the number of re-marriages had generally increased from 78 thousand in 1950 to a peak of 140 thousand in 1980, though its lowest point (58,000) was reached in 1960. The following decade from 1990 to 2000 witnessed an insignificant decrease to 126,000. Since marriages are a sum of first marriages and re-marriages, it can e clearly seen that the trend of marriage saw an overall slump, with its record low (306,000) in 2000, about a third less than its peak (471,000) in 1970
雅思大作文广告类句观点总结
雅思大作文广告类句观 点总结 Company number:【WTUT-WT88Y-W8BBGB-BWYTT-19998】
雅思大作文广告类句观点总结 Advertising 广告类 Positives of Advertising 广告的优点 Advertising is a key part of modern need to tell customers about their inform us about the choices we have. 广告是现代商业的重要组成部分。公司需要告诉消费者他们的产品。广告告诉我们有哪些选择。 Advertising is a creative industry that employs many people. 广告是一个创业产业,吸纳了很多就业。 People enjoy advertising we would have less choice. 人们喜欢广告。.没有广告,我们的选择很少。 Without advertising there would be higher unemployment. 没有广告会有更高的失业率。 Advertising is a form of modern art. 广告是现代艺术的一种形式。 Negatives of Advertising 广告的缺点 Advertising manipulates aims to persuade people that buying a product will make them happier.
广告操纵着人们。它的目标是说服人们去购买产品让他们高兴。 Advertisers focus on selling a brand are encouraged to associate certain brands with a higher status. 广告重在售卖一种品牌印象。我们会不自觉的将一些品牌与社会地位关联在一起。 They use glamorous,successful people. 他们使用迷人的,成功的人(作为形象代言)。 We now live in a consumer are persuaded to follow the latest trend. 我们生活在消费文化里。我们被说服去紧跟潮流。 Advertisers often aim their marketing at can easily be influenced by put pressure on parents to buy them things. 广告商经常把营销目标瞄准儿童。儿童很容易被广告影响。而孩子带给家长购买压力。 Opinions about Advertising 关于广告 Advertising should be aimed at children should be controlled or even banned. 广告应该被监管。将广告瞄准儿童应该受到控制甚至禁止。 Unhealthy foods should not be marketed in a way that Products that can be risk to healthy should display warnings. 垃圾食品不应该以一种吸引人的方式推广。危害到健康的儿童产品应该标示警示文字。
最新整理满分雅思大作文赏析
满分雅思大作文赏析 对于雅思写作的复习,一些雅思大作文范文,例文还是很有必要自己观摩的,为此小编特收集整理了这篇雅思大作文九分例文点评,分享给大家。希望考生能从中总结出对自己有用的知识点。 满分雅思大作文赏析 范文第一段: C h i l d r e n w h o g r o w u p i n f a m i l i e s w h i c h a r e s h o r t o f m o n e y a r e b e t t e r p r e p a r e d t o d e a l w i t h t h e p r o b l e m s o f a d u l t l i f e t h a n c h i l d r e n w h o a r e b r o u g h t u p b y w e a l t h y p a r e n t s.T o w h a t e x t e n t d o y o u a g r e e o r d i s a g r e e? S o m e f e e l t h a t t h e c h i l d r e n o f l o w i n c o m e f a m i l i e s a r e b e t t e r e q u i p p e d t o d e a l w i t h d i f f i c u l t i e s p o s e d b y t h e r e a l w o r l d w h e n t h e y g r o w u p a n d t h e y a l s o b e l i e v e t h e p r i v i l e g e d c h i l d r e n o f w e a l t h y f a m i l i e s a r e l e s s f i t t o d e a l w i t h t h e s e d i f f i c u l t i e s .T h e i m p l i c a t i o n s a n d v e r a c i t y o f t h i s a r g u m e n t s e e m s e l f-e v i d e n t,b u t i n f a c t r e q u i r e c l o s e r e x a m i n a t i o n.(58w o r d s) 名师点评:
雅思小作文类型解读
雅思小作文类型解读 雅思小作文共有六类,即柱状图,线图,饼图,表格图,流程图以及地图。对于不同类型的小作文考生是否完全掌握了呢?本文就为大家解读雅思小作文类型,把这些不同类型的小作文进行划分,以便帮助考生更好的理解。 一、按照是否有数据来分,即数据统计类与非数据类。 数据统计类包括柱状图,线图,饼图,表格图。通常在这几种类型的图中会给出一些数据,考生要进行客观分析与描述,这就要求考生掌握相关的词汇、句式或是一些数据分析方法了。不管是在数据表达上还是数据分析上,一旦出错,会让考官觉得考生的用词不到位或是逻辑有问题了,也会在一定程度上影响分数。因此,考生要格外注意。 非数据类则指的是流程图与地图。这两类虽然不需要进行数据分析,但却是让考生非常苦恼的两类作文,原因在于中国雅思考生对这两类作文接触的不多,所以想要完全突破,还需多投入时间与精力。 二、按照是否有时间推移变化来分,即动态图与静态图。 动态图: 有时间推移变化的图我们通常叫做动态图。在六类题型中,线图为动态图,但是对于表格图,饼图和柱状图却有动态和静态之分,流程图与地图则无动静态之分。对于大多数的动态图我们都可以大致当作线图来处理,动态图的重点在于数字变化的表达上,考生要懂得利用主语句型的不同和衔接词来展开。 不同类的题目有不同的解题思路,考生也要熟悉掌握。比如表格题的动态题解题思路为:先把数据相减,也就是年份大的减去年份小的;之后在进行分类,例如表示上升的归为一类,表示下降的分为一类;然后在再其中挑出极值,如最大值和最小值;此外,还要挑选出数值,数值指的是表示倍数
关系或是变化明显的数值。再如动态饼图的写作,更多的是按照扇形面积变化幅度的大小关系,按照从大到小的顺序来写的。考生可以把图形中的每种颜色看作是一条线,然后把相同、相反的颜色放在一起写,很多时候也可以把占的比例最大的单独写一部分。 静态图: 静态图常见的是柱状图,饼图和表格图,无时间推移变化。此类的写作思路相对比较多元化,重点在比较关系上,利用比较句式和排序方式来展开。 不同题型同样有不同的写法,比如静态表格题的核心在于极值和排名情况,即Task Achievement 的要求,但如果要拿高分,即真正漂亮的写作中必须要有明确的趋势表达,这一内容建议放在文中的第二段。另外,数据的比较也是一个重要的拿分点。所以,此类题型的写作思路可以为第一段用一句话概括介绍图表内容,第三段进行分类详述,第四段总结概括。熟悉掌握各类题型写法的话考生还是要多加练习。 以上就是雅思小作文类型解读的详细内容,不管是哪一种类型,考生在平时要用心准备,相信考生一定可以取得满意的雅思成绩,更多雅思备考经验我们将会陆续为大家更新,欢迎咨询我们的热线电话400-890-6000。
2020雅思大作文总结之一
2020雅思大作文总结之一 20xx雅思大作文总结: 0107 Art subjects like painting and drawing are important to students development and should be made compulsory in high school. To what extent do you agree or disagree? 0112 Many cities have vehicle-free day, which encourages citizens to take bus, cycle or take taxi to go out. Do you think the advantages outweigh the disadvantages? 0114 Some people think job satisfaction is more important than job security. Others believe a permanent job is more important. Discuss both these views and give your own opinion. 0121
The best way for government to solve traffic congestion is to provide free public transport 24 hours a day and 7 days a week. Do you agree or disagree? 0211 Ambition is an important character for people who want to be successful in life. How important do you think it is for people who want to succeed? Is it a positive or negative character? 0216 Some people think “vertical” city is the best, where people live and work in tall buildings. Others t hink “horizontal” city is better, where there are few tall buildings. Dis cuss both these views and give your own opinion. 0218 Technology makes our life too rich, and we should live a simple life without using the technology. To what extent do you agree or disagree? 0225 Some people think government should spend money looking for life on other planets, while others think it is a waste of public
雅思经典图表作文范文
# 43. You should spend about 20 minutes on this task. The table below shows CO2 emissions for different forms of transport in the European Union. The Pie Chart shows the percentage of European Union funds being spent on different forms of transport. You should write at least 150 words.
model answer: The chart shows CO2 emissions per passenger kilometre for variuos methods of transport in the European Union while the pie chart shows European Union spending on transport. Flying by air produces by far the greatest CO2 emissions, approximately three times as much as passenger cars which are the next largest producers. Very little is spent by the EU on air travel while roads make up more than half of the EU transport budget. Trains produce about three times less CO2 emissions per passenger kilometre than passenger cars and eight times less than air travel. Nearly a third of EU transport funds are spent on railways. Ships are a clean form of transport and produce about the same amount of CO2 per passenger kilometre as trains do. However, only 2 percent of EU funds are spent on ports. A further one percent is spent on inland waterways. Coaches are the cleanest form of transport. Emissions of CO2 per passenger kilometre from coaches are half those of buses. Buses emit less than half as much CO2 per passenger kilometre as cars. The European Union spends 10 percent of its transport budget on public transport, such as buses and coaches. (197 words)
雅思大作文题目汇总
年雅思大作文题目汇总
————————————————————————————————作者:————————————————————————————————日期:
2013年1月10日 The most important thing of people's life is his or her work. Without a satisfying career, the life is meaningless. To what extent do you agree or disagree? 2013年1月12日 Children spend long time studying in school and after school. What are the positive or negative effects on children and the society as a whole? 2013年2月2日 Some people think watching TV every day is bad for children. Others think it is good for developing children as they grow up. Discuss both these views and give your own opinion. 2013年2月14日 Some people believe young people should be free to choose his or her job, but others think they should be realistic and think about their future. Discuss and give your opinion. 2013年2月16日 Some people think all lawbreakers should be put into prison, others believe that there are better alternatives. Discuss and give your opinion. 2013年2月23日 Not enough students choose science subjects in university in many countries. What are the reasons? What are the effects on the society? 2013年3月2日 More and more people tend to accept education through the internet, and therefore, face-to-face communication is decreasing. Do you think the advantages outweigh the disadvantages? 2013年3月9日 Some people believe that studying in a college or university is the best way for students to prepare for their future career. Others think they should leave school as soon as possible to develop their career through work experience. Discuss both these views and give your own opinion. 2013年3月14日 It is more important for a building to focus on its function. Architects should not worry about its looks. Do you agree or disagree?
2017雅思A类写作大作文真题范文
2017雅思A类写作大作文真题范文 1.07 教育类 Task:Art classes, like painting and drawing, are not as important as other subjects, so some people think that it should not be a compulsory subject at high school. To what extent do you agree or disagree? Schools are places where students acquire knowledge and skills needed for further achievements. Given the pressure that students are facing, some cannot help wondering whether art classes should still be compulsory. Those holding the view that art classes should not be compulsory might think that art consumes too much of students' time. Fierce competitions students will face when applying for universities necessitate total devotion to academic subjects. College students who intend to take science as their major are even expected to be fluent in foreign languages now so that essays written by foreign scholars are not barriers in their academic pursuit. In other words, high school students are supposed to show higher levels of academic competence,which seemingly makes art unessential. However, art classes are by no means only intended for entertainment. Children even dabbling in art tend to be more creative in mind. Those skilled in music or painting can interpret the world in a way that we cannot expect from a layman. This kind of ingenuity is also a rare quality constantly found in great scientists, whose contributions have served to create a totally new field for the latter generations. In his reply to a question about death, Albert Einstein considered his departure from the mortal world to be forever farewell to another great musician. With a sigh he answered "I cannot listen to Mozart anymore". Thus, can we simply regard art classes to be selective?
雅思小作文之图表作文
二.雅思图表作文 1.企业垃圾(线性图) 题目:The graph below shows the amounts of waste produced by three companies over a period of 15 years. 范文:The line graph compares three companies in terms of their waste output between the years 2000 and 2015. It is clear that there were significant changes in the amounts of waste produced by all three companies shown on the graph. While companies A and B saw waste output fall over the 15-year period, the amount of waste produced by company C increased considerably. In 2000, company A produced 12 tonnes of waste, while companies B and C produced around 8 tonnes and 4 tonnes of waste material respectively. Over the following 5 years, the waste output of companies B and C rose by around 2 tonnes, but the figure for company A fell by approximately 1 tonne. From 2005 to 2015, company A cut waste production by roughly 3 tonnes, and company B reduced its waste by around 7 tonnes. By contrast, company C saw an increase
雅思小作文功能句型与范文
小作文功能句型 表示上升: (1) The house price increased / grew / went up / rose / soared by *** / to ***. (2) The number of overseas students increased steadily / significantly / moderately / slightly from *** to ***. (3) The decade saw / witnessed an increase/ rise in the spending on education. (4) The consumption of chicken showed / experienced a rising / upward trend during this period. (5) There was a dramatic increase in the amount of chicken consumed. 表示下降: (1) The number of Japanese tourists dropped / decreased / declined / went down / fell by *** / to ***. (2) Beef consumption has declined rapidly / significantly / sharply / steadily / moderately from *** to ***. (3) The decade saw / witnessed a decrease / decline in the spending on public service. (4) The divorce rate showed / experienced a falling / downward trend. (5) There was a slight decrease in the amount of fish consumed. “比较”表示法 (1) The consumption of beef was 70 grams more / less than that of lamb. (2) Women spent 36 hours on housework, compared with men who spent 25 hours at home. (3) The number of visitors from France was the largest in the four countries / larger than any other countries. (4) Students who watch less television have higher scores. (5) The consumption of beef ranked first in the four foods. “倍数”表示法 (1) The amount of coal consumed was three times as much as / more than that of oil. (2) The number of cars produced in factory A was three times as many as that in factory B. (3) The amount of beef consumed almost doubled / tripled, up / rising / climbing from *** to ***. (4) The percentage of female students increased four times. (5) Factory A produced three times as many cars as Factory B. 表示“平稳”或者“波动” (1) The amount of water used for agriculture remained/stayed stable/steady/unchanged for 5 years in a row. (2) The unemployment rate was flat at 6%. (3) The house price stabilized at a high level from 1998 to 2000. (4) The power consumption fluctuated in this period.
-雅思大作文总结加中文翻译
-雅思大作文总结加中文翻译
————————————————————————————————作者:————————————————————————————————日期: 2
2014年8月16日In some countries, governments are encouraging industries and businesses to move out of cities into regional areas. What are the advantages and disadvantages of this new development?在一些国家,政府鼓励工业和商业企业从城市搬到偏远地区。这种新的现象的好处和弊端是什么? 2014年8月9日Some people think that dangerous sports should be banned, but others think the people should have freedom to choose sports activities. Discuss both views and give your opinion. 一些人认为危险的体育运动应该禁止,但其他人认为人们应该有选择体育运动的自由。讨论双方观点并给出你的看法。 2014年8月2日In many parts of the world children and teenagers are committing more crimes. Why do you think it is the case? How should children or teenagers be punished? 在世界许多地区孩子和青少年犯罪在增加。你认为为什么会有这种情况?孩子和青少年犯罪者应该如何惩罚? 2014年7月26日Some people think that the environmental problems are too big for individuals to solve. Others, however, believe that the problems cannot be solved if individuals do not take some actions. Discuss both views and give your own opinion. 一些人认为环境问题太大了以至于个人无法解决它。然而,其他人认为如果没有每一位个人的努力,这些问题无法解决。讨论双方观点并给出你的看法。 2014年7月19日Some believe governments should do more to make citizens have a healthy diet, others believe individuals must take responsibility for their diets and health. Discuss both views and give your own opinion. 一些人认为政府应该做更多的工作以确保公民健康地饮食。其他人认为个人必须承担起自己的饮食和健康的责任。讨论双方观点并给出你的看法。 2014年7月10日Some countries achieve international sporting success by building specialized facilities to train top athletes instead of providing sports facilities that everyone can use. Do you think it is a positive or negative development? 一些国家通过建设专门的设
雅思 写作大作文s
一、教育 1. In countries where there is a high rate of unemployment, most pupils should be offered only primary education. There is no point in offering secondary education to those who have no hope of finding a job. To what extent do you agree or disagree with this statement? (08.01.26) 不同意: 中学教育是一个重要的德育阶段,如果在这个时候中断,带来的不仅仅是失业这样的问题,还有青少年犯罪等社会问题vital stage for moral education. If it was interrupted, numerous of social problem/headaches may create as juvenile delinquency. (正如马克吐温说:你每关闭一所学校,你就必须开设一座监狱。Every time you stop a school, you will have to build a jail ) 教育能够帮助培养个人素质;提高劳动力的素质,从而提高生产效率,推动社会发展,从根本上解决失业的问题。do a favor to/be beneficial(advantageous, preferable) to personal quality, enhance/boost/promote the quality of the labor force, thereby increase production efficiency, social development, solve the problem of unemployment 从长远来看,如果受过更高的教育,则有更多的机会找到好的工作。In a long run/term, if pupils could receive better education, they may have far more opportunities to find better jobs. 教育的作用不仅仅应当局限在找工作,而是为了将来更好的发展。The function of education should be not only focused on \limited in job hunting, but also for a better development. **失业的原因是综合的comprehensive/complicated,例如经济原因:经济衰退或者不景气economy recession/depression,就业岗位剧减,导致市场对于劳动力的需求整体下降 a fall in the overall demand for labor;社会原因,个人原因等 2. Most countries spend much money on education, as they start to realize the importance of education. In your opinion which subject is the most important for young people and which one is the least important? Subjects: Literature Sports Mathematics Economy Physics History Music Geography (08.03.01) 整个题目可以分为理论科目和实践科目两种: 理论科目的好处:智的角度 实践科目(音乐、体育)的好处:美、体、劳的角度 E.g.: What does sports benefits your academic? Any sport will have a positive effect on academic performance simply because exercise is good for the brain, and teamwork and strategy that are focal to most sports are applicable as well to many academic areas. 理论科目的坏处:枯燥、单调、需要长时间的学习、结合实践时较为困难 体育、音乐的坏处:需要天赋;需要大量时间和金钱的投入;就业范围小,职业生涯短 3. Schoolteachers used to be the source of information, however, some people argue that teachers are not as important as before as the increasing variety of information resources. What is your opinion? (08.0 4.24) 和以前一样重要:(也就是说老师的重要性) 学校教育更加有利于学生的道德培养,尤其对于年龄较小的学生。老师可以帮助学生建立自信心,培养能力,塑造良好的性格最终成为一个有利于社会的人。Teachers could help the students to build up confidence, shape upright character and ultimately grow a full man beneficial to the society. 通过老师的讲解,能够更加容易接受知识。By lectures, students are more easily to receive knowledge.可以根据学生的需要而改变teach students in accordance with their own characteristics and differences 学生在学校里能够参加体育锻炼,有利于身体的健康和成长 学校教育给了学生一个交流、沟通、合作的机会,有利于团队精神team spirit、合作精神cooperation、创新能力innovation的培养foster/cultivation。 其他信息途径的好处(远程教育的好处) 提供了一种更为新颖有效的教育形式an original and effective educational model;增加人们接受教育的机会increase the opportunities of being educated;提高参与者的科技能力develop technology competencies、拓展技术面broaden skill set,从而提高就业机会job opportunity。 为地处偏远和行动不便的人、工作时间不稳定的人提供了受教育的机会those with restricted mobility, such as elderly, disabled, injured, irregular work schedule. 可以同时和全国各地甚至全世界各地的人进行交流和学communicate and interact with students all over the country or even the world 文档和资料容易储存、易提取、打印和阅读documents and materials are easily recorded, retrieved, printed and read 远程教育的缺点: 缺乏和老师面对面的交流lack of in-person contact with faculty members很难及时接受到老师的反馈wait for a long time before receiving feedback about assignments 不能像传统教育那样和同学之间更多地接触,没有机会提高口头交流能力和合作能力等have no chance to enhance oral communication skills and cooperation skills 精力和注意力会被很多东西分散many distractions at home 并不是所有的行业都承认网络教育的学历,缺乏就业认可。not all work industries acknowledge online degrees 4.Schools should teach children some academic subjects, which will be beneficial to their future careers. Therefore, other subjects such as music and sports are not important. To what extent do you agree or disagree with this opinion? (08.0 5.22) 同第2题 5.University students always focus on one specialist subject, but some people think universities should encourage their students to study a range of subjects in addition to their own subject. To what extent do you agree or disagree with this statement? (08.0 6.05)