Providing Visualisation Support for Analysis in EMAP
Providing Visualisation Support for Analysis in EMAP
Aba-Sah Dadzie, Albert Burger
School of Mathematical and Computer Sciences, Heriot-Watt University, Edinburgh
{ceead, ab}@https://www.360docs.net/doc/323489717.html,
Abstract.The Edinburgh Mouse Atlas Project, EMAP, provides text indices detailing the
anatomical components for each stage of development in the mouse embryo, with mappings to
corresponding components in 2D slices and 3D regions in reconstructed models of the embryos.
This project is looking at easing data analysis using visual overviews of the textual data. Introduction
Bioinformatics was born of the need to retrieve useful knowledge from the large data warehouses now available to biologists for research [1],[8], by making use of existing and developing novel tools and techniques for effective data management and analysis.
Evidence exists for the advantages in exploiting humans’ highly developed perceptual capabilities in the analysis of complex data [2],[3]. Harnessing visualisation for data analysis will provide data overviews, followed by the ability to analyse regions of interest (ROIs) in detail [2].
Limitations of the Current EMAP Browsers for Data Analysis
EMAP’s text indices require scrolling to ROIs, leading to the loss of contextual information and increasing difficulty in recognising relationships within the data. Employing graphical techniques for data representation provide further and more intuitive options for analysis.
Functionality is required for alternative structuring of the data to highlight different relationships within it. Simultaneous visualisation of multiple data sets would allow comparison across consecutive stages of development, useful for tracing lineage as the embryo develops [5], and also to further research on gene function and expression in related and more distant tissues, organs and organisms. Finally, graphical search and query methods can be used to ease information retrieval [2], especially for external data sources.
Implementation of a Visualisation Solution
Exploiting existing techniques for hierarchical data visualisation and extending them to provide novel methods for data analysis should aid the study and comparison of the hierarchically structured anatomy ontologies, to uncover relationships within the data. [4],[10]
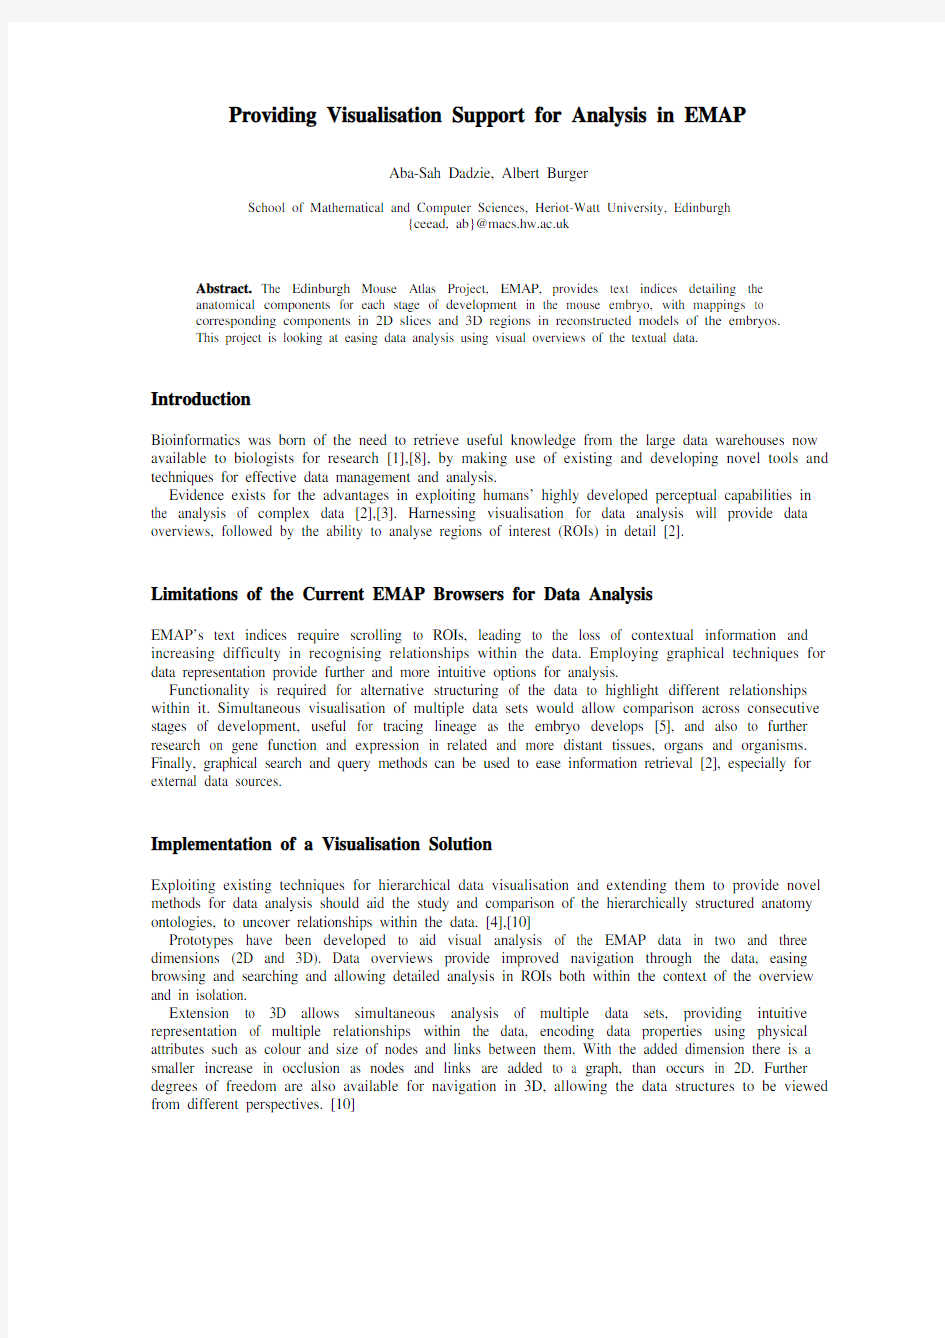
Prototypes have been developed to aid visual analysis of the EMAP data in two and three dimensions (2D and 3D). Data overviews provide improved navigation through the data, easing browsing and searching and allowing detailed analysis in ROIs both within the context of the overview and in isolation.
Extension to 3D allows simultaneous analysis of multiple data sets, providing intuitive representation of multiple relationships within the data, encoding data properties using physical attributes such as colour and size of nodes and links between them. With the added dimension there is a smaller increase in occlusion as nodes and links are added to a graph, than occurs in 2D. Further degrees of freedom are also available for navigation in 3D, allowing the data structures to be viewed from different perspectives. [10]
Fig. 1. The snapshot on the left shows a radial representation of the anatomy ontology data for Theiler Stage 11; the sub-window focuses on an ROI. On the right Theiler Stages 10 and 11 are shown in 3D, with colour-coded links highlighting relationships spanning stages.
Further Work Required
User evaluations of the prototypes have examined the ability to provide improved data analysis beyond that currently available within EMAP and other existing tools, by making use of a graphical representation of the data. Major problems encountered include increasing occlusion and system response time with data load. A significant result of the evaluation was that users found visualisation in 3D to provide additional advantages to the functionality provided in 2D that eased navigation through and analysis of the data sets, even when working with multiple data sets.
Further development will look at fine tuning the visualisations developed and extending the graph metaphor to provide functionality for effective analysis of both individual data sets and to cope with increased demand as number of and data set size increase.
References:
1. Benton, D., Bioinformatics - principles and potential of a new multidisciplinary in Trends in Biotechnology Volume 14, Issue 8, pp.261-272, 1996
2. Shneiderman, B., The eyes have it: a task by data type taxonomy for information visualizations in Proceedings of the 1996 IEEE Symposium on Visual Languages, pp. 336-343, 1996
3. Wesson, J., Van Greunen, D., Research papers: human-computer interaction, visualization and collaboration: Visualisation of usability data: measuring task efficiency in Proceedings of the 2002 annual research conference of the South African institute of computer scientists and information technologists on Enablement through technology, pp.11-18, 2002
4. Herman, I., Melan?on, G., Marshall, M.S., Graph visualization and navigation in information visualization: A survey in IEEE Transactions on Visualization and Computer Graphics, Volume: 6 Issue: 1, pp.24-43, 2000
5. Burger, A., Davidson, D., Baldock, R., Formalization of Mouse Embryo Anatomy in Bioinformatics 20, pp.259-267, 2004
6. Shneiderman, B., Designing the user interface: strategies for effective human-computer interaction, 3rd ed., Addison-Wesley, 1998
7. Bult, C.J. et al., Mouse genome informatics in a new age of biological inquiry in Proceedings of the IEEE International Symposium on Bio-Informatics and Biomedical Engineering 2000, pp.29-32
8. Baldock, R., Bard, J., Burger, A., Burton, N., Christiansen J., Feng, G., Hill, B., Houghton, D., Kaufman, M., Rao, J., Sharpe, J., Ross, A., Stevenson, P., Venkataraman, S., Waterhouse, A., Yang, Y., Davidson, D., EMAP and EMAGE: A Framework for Understanding Spatially Organised Data. Neuroinformatics 1, pp.309-325, 2003
9. Burger, A., XSPAN, A cross-species anatomy network in The Standards and Ontologies for Functional Genomics (SOFG) Conference, 2002
10. Falkman, G., Information visualisation in clinical Odontology: multidimensional analysis and interactive data exploration in Artificial Intelligence in Medicine 22, pp.133-158, 2001