Exploring Collective Dynamics in Communication Networks
[J.Res.Natl.Inst.Stand.T echnol.107,179–191(2002)]
Exploring Collective Dynamics in
Communication Networks
V olume107Number2March–April2002
Jian Y uan and
Kevin Mills
National Institute of Standards and T echnology,
Gaithersburg,MD20899-0001 jian.yuan@https://www.360docs.net/doc/334511985.html,
https://www.360docs.net/doc/334511985.html,ls@https://www.360docs.net/doc/334511985.html, A communication network,such as the
Internet,comprises a complex system
where cooperative phenomena may
emerge from interactions among various
traffic flows generated and forwarded
by individual nodes.T o identify and
understand such phenomena,we model a
network as a two-dimensional cellular
automaton.W e suspect such models can
promote better understanding of the
spatial-temporal evolution of network
congestion,and other emergent
phenomena in communication networks.
T o search the behavior space of the
model,we study dynamic patterns
arising from interactions among traffic
flows routed across shared network
nodes,as we employ various configura-
tions of parameters and two different
congestion-control algorithms.In this
paper,we characterize correlation in
congestion behavior within the model
at different system sizes and time
granularities.As expected,we find that
long-range dependence(LRD)appears at
some time granularities,and that for a
given network size LRD decays as time
granularity increases.As network size
increases,we find that long-range
dependence exists at larger time scales.
T o distinguish effects due to network
size from effects due to collective
phenomena,we compare congestion
behavior within networks of selected
sizes to congestion behavior within
comparably sized sub-areas in a larger
network.W e find stronger long-range
dependence for sub-areas within the
larger network.This suggests the
importance of modeling networks of
sufficiently large size when studying the
effects of collective dynamics.
Key words:cellular automata;collective
dynamics;complex system;congestion
control;emergence;communication
networks;long-range dependence;
modeling and simulation;network traffic.
Accepted:January28,2002
A vailable online:https://www.360docs.net/doc/334511985.html,/jres
1.Introduction
As the Internet expands in size(from millions to billions of nodes)and in capabilities(from mainly file-transfers and web traffic to an increasing proportion of streaming multimedia traffic),network researchers propose and investigate new protocols and control algorithms to provide assured quality of service and improved network utilization.In most cases,such investigations are motivated and evaluated by small-scale simulations and experiments while ignoring effects from collective behavior that could emerge in a large network.Emergent phenomena are often identi-fied when the behavior of an entire system appears more coherent and directed than the behavior of individual parts of the system.Such phenomena arise in the study of complex systems,where many parts interact with each other and where the study of the behavior of individual parts reveals little about system-wide behavior[1].Emergent phenomena might significantly influence the performance of proposed new protocols and control algorithms.W e aim to identify and under-stand the source and effects of emergent phenomena in large networks.In this paper,we investigate specifically congestion behavior in a network at various sizes and time scales.
Our work exists within an active field of investigation where researchers attempt to understand and control the dynamic behavior of existing networks.For example, past work on the performance of congestion-control algorithms for end nodes in the Internet[2]identified important effects on system-wide congestion arising from the retransmission behavior of individual nodes. Recently,researchers have begun to investigate mathe-matical approaches to characterize collective behavior in large networks.For example,Liu et al.[3]propose using stochastic differential equations to describe the behavior of flows and queues,with passage to more tractable systems of ordinary differential equations by taking expectations.The coupled ordinary differential equations can be solved numerically.Similar ap-proaches,based on fluid-flow models,are also being investigated through simulation[4].Innovative ideas such as these begin to probe the ability of abstract mathematical techniques to characterize collective behavior in large networks.
As an alternative to these more abstract mathematical approaches,some researchers represent large networks in terms of discrete-event simulations of individual nodes deployed in specific topologies.Such models attempt to capture the detailed behavior in individual nodes to ensure that significant effects from protocols and protocol interactions will not be overlooked by the coarser granularity used to construct more abstract models.The advantages of simulation models include the ability to represent the time-varying behavior of a network and to capture complex behavioral details, which might have significant effects on global network behavior.Further,it is always possible to construct discrete-event models for specific protocol mechanisms, while it might prove impossible to develop tractable mathematical models for such mechanisms.Unfortu-nately,detailed discrete-event simulation models consume substantial CPU time,much of which may be devoted to modeling behavior irrelevant to the phenomena being investigated.Several researchers are working on speeding up discrete-event simulations, through parallelization and other techniques,in order to enable realistic simulation of networks containing from 104to106nodes[5,6].
W e suspect that an interesting space of informative models may exist somewhere between manageable, abstract mathematical models,and detailed,computa-tionally intensive simulations.A growing interest in the study of complex systems has led networking researchers to consider applying a number of mathemat-ical techniques from physics to characterize collective dynamics in large networks[7-11].One such technique applies a cellular automaton(CA)[12,13]to identify and characterize emergent properties,such as conges-tion,in networks[14].W e suspect such models can promote better understanding of the spatial-temporal evolution of network congestion,and other emergent phenomena.
In this paper,we use a two-dimensional CA to investigate congestion behavior in networks of varying size,and over varying time scales.The CA stimulates collective dynamics in a network using abstract mathe-matical representations of individual nodes.T o search the behavior space of our CA,we study dynamic patterns arising from interactions among traffic flows routed across shared network nodes,as we employ various configurations of parameters and two different congestion-control algorithms.W e focus on the relation-ship between network size and time scale.Specifically, we characterize the correlation in congestion behavior within the model at different system sizes and time granularities.Among other things,our results suggest the importance of modeling(or measuring)networks of sufficiently large size when studying the nature of collective dynamics.The paper is presented in five sections.Section2outlines our motivation,provides highlights of our methodology,and describes our computational model,including input process,control algorithms,and routing.W e outline our experiments, and show our simulation results in Sec.3.Section4 discusses the significance of our results.W e discuss possible future work in Sec.5,and then present concluding remarks in Sec.6.
2.Motivation,Methodology,and Model
W e seek to understand what will happen when many network connections are active simultaneously.W e suspect that some collective effects may appear within networks with a size beyond some determinable threshold.Our concern is to understand the global implications of such collective effects,rather than to discern cause and effect relationships introduced by specific control algorithms and associated protocols. Research into emergent phenomena in physical systems shows that collective effects tend to arise only when many local interactions occur over a wide space, such as might be possible in a large network where dynamic behavior can be transmitted through the nodes. The transmission of dynamic behavior can evolve into correlated patterns.Alternatively,large networks can be viewed as dissipative dynamic systems,where a driving force(injecting packets)determines the strength of local interactions.Increasing the driving force impels the system toward stronger coupling among interactions.As the driving force reaches a certain critical strength,we can expect the interactions to merge into a coherent behavior,which cannot be simply inferred from the
individual behavior of components.The resulting coher-ent behavior should be observed as spatial-temporal dynamic patterns over the whole system.W e think that this view of system dynamics might prove applicable in large communication networks,such as the Internet. Further,it is possible that feedback control mechanisms, as implemented in such networks,might play a pivotal role in dynamically maintaining both coherence and efficiency of system state by preventing resource saturation due to extreme congestion.
2.1Methodology
T o investigate these ideas,we propose to model a large network as a cellular automaton(CA),where the behavior of each cell captures some important details related to network protocols.Specifically,our model maintains the individual identity of packets in order to reproduce the“ripple effect”[3]seen in real network connections.Our model also simulates feedback-control regimes for each connection in order to respond to
variations in congestion over time and space.W e provide two alternative forms of feedback control:connection-admission control(CAC)and feedback transmission-control protocol(TCP).On the other hand,we resort to some extreme simplifications,including a regular grid topology composed of homogeneous links and nodes (see Fig.1),in order to achieve a sufficiently large model with well-understood parameters.Further,to ensure that no correlation arises from the input traffic itself,we use homogeneous on-off Poisson processes to model the behavior of traffic sources.
Our CA comprises a discrete,dynamic system com-posed of a set of cells arranged in a regular,spatial lattice.The state of a cell at a given time step depends only on its own state and the states of its neighbors at the previous time step.The cells update synchronously and in parallel.Thus,the entire CA state advances in discrete time steps.Global behavior results from multiple inter-actions in the evolution of states in all the single cells. As a result of the discrete time model,we can measure the entire CA state,or any portion of interest,at each time step.In our results,we include at least2000data points in each time series that we analyze.For our coarsest time granularity,where we aggregate1000 time steps,this means that we must run the model for two million time steps.Such measurements produce a time series that can be graphed,and that can also be analyzed using a wide range of suitable statistical techniques.
Our main approach to analyze time-series employs power-spectral analysis[24].W e envision the system state as a signal generated over time by the system. Power-spectrum graphs describe the frequency depen-dence in the signal.The power spectrum is the Fourier transform of the autocorrelation function of a time series.Of particular interest to us is the appearance of 1/f noise,which provides a clear indication of some sort of collective effect,or cooperative phenomenon,present in the process that generates the signal[22].“1/f noise”is a type of noise whose power spectrum as a function of frequency(f)behaves like:P(f)=1/f a,where a is between0and2.Such noise is often associated with the presence of a complex system,defined as a system that exhibits large variability in its behavior due to strong dynamic interactions among its parts.In contrast to a complex system,an ordered system exhibits regular be-havior due to deterministic interactions among its parts, and a disordered system exhibits behavior that can be characterized on a statistical basis because its parts in-teract rarely[22].In fact,the presence of1/f noise is often cited in the literature as an indication of emergent phenomena.Further,the power spectrum of1/f noise exhibits ample energy in low frequency components. This suggests the dominant autocorrelation in the signal exists over the long term,which also indicates long-range dependence.
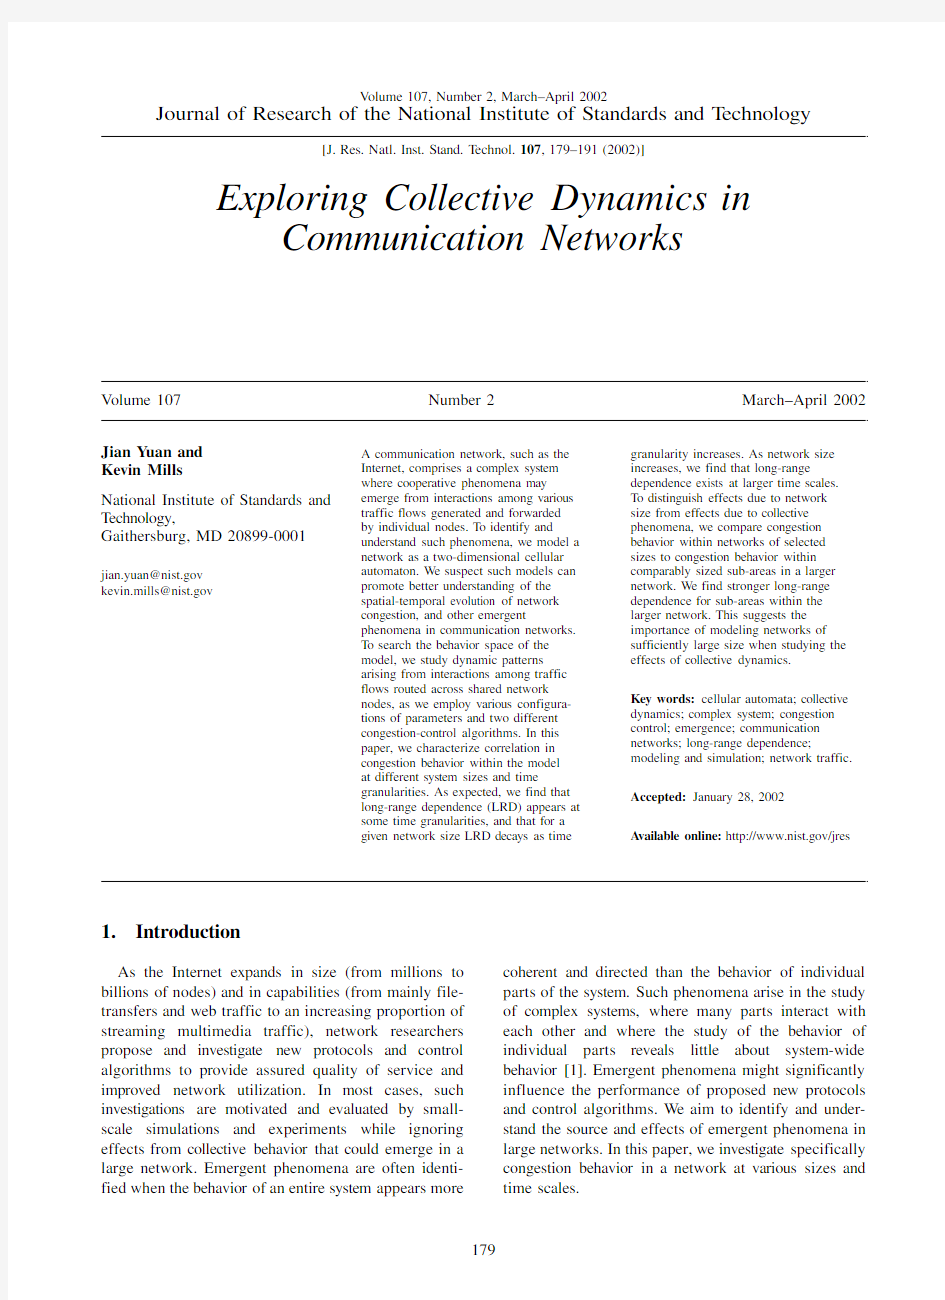
2.2Modeling a Network With Cellular Automata The computational model used here represents a net-work as a CA lattice with L?L cells(Fig.1)in which each cell corresponds to a node with four nearest neighbors(we interconnect boundary nodes,as neces-sary).Other researchers have proposed similar network models[8,9,15,16].In our model,each node, which can store and forward packets traveling between Fig.1.The2-D CA model with system size L=10.
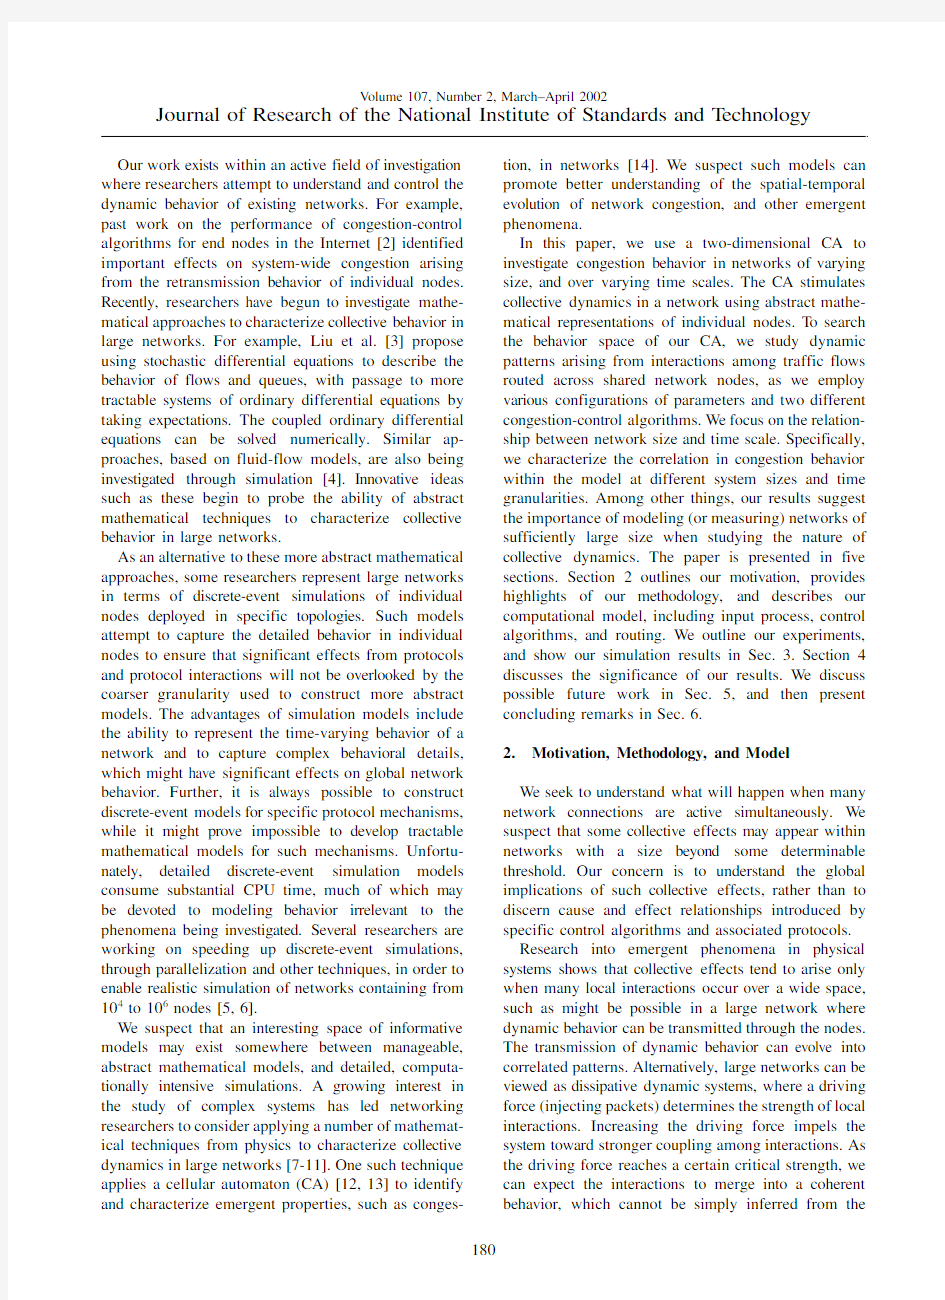
source-destination pairs,maintains a queue of unlimited length,where arriving packets are stored until they can be processed.Each node can act both as a source and destination for traffic.In effect,each cell in our model can be thought to represent a host that sends and receives traffic and a router that forwards traffic.The queue length at each node represents the state of the cell. Figure2provides a schematic diagram of the node-specific behavior of each CA cell at each time step.
2.3Node as a Cell
At each time step,each node:(1)evaluates the traffic-generation restrictions and congestion-control status and,if indicated,places a new data packet at the end of its own queue,(2)selects a packet from the front of its queue(if a packet is present),(3)selects the next hop(unless the packet has reached its destination node), and(4)forwards the packet to the end of the queue within the next-hop node.If the packet at the front of the queue has reached its destination,then the node consumes the packet.However,if the consumed packet is an incoming request for which a reply is indicated, then the node will place a reply packet at the end of its queue.Different choices are possible to model the input process,the congestion-control algorithm,and the routing.A discussion of each of these issues follows.2.3.1Input Process
In this paper,each node models traffic generation by “on/off”periods,which alternate between wake and sleep.When awake,and if the congestion-control state permits,the node adds a data packet to the end of its queue during each time step.At the beginning of each “on”period,a node randomly selects(uniform distribu-tion)a destination node from among all other nodes in the lattice.Each packet generated during the same“on”period has the same destination address.When sleeping, the node generates no new data packets.On/off periods provide a convenient model of user behavior.In the simulation reported here,the wake and sleep period durations for each source are taken to be exponentially distributed with parameters?on and?off.Thus,the transitions between state“on”and state“off”form a memoryless(i.e.,uncorrelated)process.While we do not assert that real users exhibit memoryless behavior, we aim to investigate long-memory behavior that results from collective interactions;therefore,we must elimi-nate correlations in the behavior of individual traffic sources.The input processes of different nodes are taken to be independent from each other.
2.3.2Congestion-Control Algorithms
Our model contains the possibility of three choices for congestion-control algorithm:(1)open-loop,(2) connection-admission control(CAC),and(3)feedback transmission control protocol(TCP).Only one of these algorithms can be used for a given experiment.In the case of the open-loop algorithm,we can change the average durations of state“on”and state“off”to control the network workload.There is no feedback in this case. An open-loop approach does not model reality very well because the goal of a network is to transmit packets between source-destination pairs while attempting to assure some minimally acceptable quality of service. Even for best-effort service(i.e.,where the network provides no guarantees about service quality)[2],a user will not wait indefinitely in the face of long packet-transmission times that occur in a very congested net-work.So feedback control is important for networks, and we model two different approaches.
In one approach,we use a connection-admission control(CAC)algorithm.CAC requires a source to send a probe packet at the beginning of each“on”state.Upon receiving this probe packet,the destination node returns a probe-reply packet to the source.Upon receiving the probe-reply packet,the source node determines the round-trip time,RTT,and then normalizes RTT with respect to the distance between the source and destina-tion.If the normalized RTT,Nrtt,falls below a threshold,
Fig.2.General processing within a node at each time step.
Drtt,then the source sends a data packet at each time step during the“on”state.If the Nrtt exceeds Drtt,then the source sends another probe packet.Upon receiving the probe-reply,the source repeats its RTT assessment. While the CAC algorithm tests congestion state along the source-destination path prior to injecting a data-packet flow,the flows themselves exhibit fixed inter-packet spacing.Inter-packet spacing within a single TCP flow,however,has been observed to exhibit its own distinguishing variability,which appears as structured behavior on a short time scale.Such variability in TCP flows is likely attributable to the feedback-control mechanisms of TCP[17,18],though this remains a topic of ongoing study.Other studies have demonstrated that TCP results in interesting dynamics at small time scales[19,20].T o account for the significant behavior of feedback control,we included within our model a modified version of TCP.
Our TCP model includes some limiting assumptions. Each node contains an unlimited buffer,so no packets will be lost and retransmitted.Instead we only model the effect that congestion losses would have on TCP flow-control mechanisms.W e do this by comparing the normalized RTT,Nrtt,for each received acknowledg-ment(ACK)against a threshold,Drtt.W e also ensure that the receiver’s advertised flow-control window [2]does not constrain the sending rate.Our modified TCP model does include a slow-start and congestion-avoidance algorithm,which is described as follows. For every ACK,if the Nrtt exceeds the Drtt,then we set the slow-start threshold to1/2the congestion window and set the congestion window to one.Otherwise,if the congestion window is below the slow-start threshold,we increment the congestion window by one.Once the congestion window exceeds the slow-start threshold,we increment the congestion window by the inverse of the congestion window.This procedure simulates the effects of the transition in TCP between the congestion phase,the slow-start phase and the congestion-avoidance phase.At each time step,a source node injects a data packet,up to the limits of its congestion window.
2.3.3Routing
As with input processes and congestion-control algorithms,we can choose different routing strategies for our model.For our experiments,the objective of routing is to minimize the delay for each packet by forwarding it along the shortest path between source-destination pairs.T o select the proper next-hop along which to forward a packet,the forwarding node com-putes(using the approach of Fuks and Lawniczak[15])the distance from each of its four neighboring nodes
to the packet’s destination node.Then the packet is
forwarded to the neighboring node nearest to the
destination.When multiple neighboring nodes prove
equidistant from the destination,then one of the candi-
date nodes is selected randomly with uniform probabil-
ity.After placing the packet at the end of the queue in
the selected node,the model increments a throughput
counter associated with the corresponding outgoing
link.
3.Simulation Results
In this section,we study the behavioral properties of
our model under two congestion-control algorithms.An
important parameter in our algorithms is Drtt,which
can be used to control the quality of service in packet-
delivery time,and also the network load.W e performed
some simulations to assess the effect of Drtt,and
observed that,for a fixed network size and fixed?on and?off,packet delivery time and network congestion increases with Drtt up to some bound.Further,for
several fixed values of Drtt,we observed that the
distribution of packet-delivery times seem to follow a
lognormal distribution,as observed elsewhere[16,21].
From these results(not fully described here)we decided
to set Drtt at50time steps,a value that permitted
congestion to build up within the network,and thus
enabled us to study the collective behavior of our
congestion-control algorithms.Unless otherwise indi-
cated,all simulations discussed here were run with ?on=100,?off=500,Drtt=50,and with the TCP con-gestion-control algorithm.W e begin by considering the
effects of time scale on queue sizes in an individual
node.
Packet-switched networks,which route messages
hop-by-hop over multiple intermediate links and routers
between sources and destinations,can be viewed as a
mesh of single-server queues,where each queue acts as
a memory element.For purposes of illustration,Fig.3
shows the time series of the queue length,Nr,for a
typical node of the CA lattice at three time granularities
T=1,10,and100,where T defines the interval with which we sample the system state.(The abscissas on all our graphs depict the number of sample intervals,t,so the total number of CA time steps represented in any particular graph is equal to T?t).At the shortest sample interval,T=1,the queue length changes smoothly because the memory introduces a correlation. As expected,as the sample interval T increases,the memory becomes weaker and the correlative structure is diminished.Since each queue exists within a network of queues,we expect correlation in queue size to be
influenced by memories of neighboring queues.This influence appears as a kind of spatial-temporal informa-tion,which is difficult to discern by observing a single queue.Before we consider a more suitable metric to measure spatial-temporal memory,we discuss another measure of interest,the output process of an individual node,as an alternative to queue size.
Let?out denote the number of data packets received by a node,during a time interval T,where the node is the data packet’s destination.Measures of?out appear to reflect more the influence of spatial-temporal informa-tion than is the case for measures of queue size,Nr. Figure4,which shows a time series of?out for one node at three time granularities T=40,100,and500, supports this observation.Here,while autocorrelation decreases as T increases,the rate of decrease appears more gradual than is the case with queue sizes(Fig.3). In our view,?out reflects more information about its time interval and about nearby space because it is an aggregate value,accumulated over the sample interval, rather than a snapshot of system state at one time instant.To gain more insight into our observations,we compute the power spectrum S out(f)of?out.
Figure5shows the power spectra for selected combi-nations of time granularity and system size.In general, each curve shows a flat line at lower frequencies, followed by a negatively sloped line commencing at higher frequencies.The negatively sloped portion of each curve exhibits the appearance of1/f noise.In our interpretation of these curves,the larger the negatively sloped region of a curve(or the shorter the flat region), the more1/f-like the curve.Further,the more a curve appears1/f-like,the greater the long-range dependence in the signal.For example,comparing the two curves in Fig.5(a),we find that long-range dependence decays as the time granularity increases from T=80to T=400. W e also find that for the same time granularity (T=400),a larger network size shows a greater long-range dependence(compare Fig.5(a)T=400against Fig.5(c)T=400).The presence of1/f noise,which is characterized by correlations extending over a wide range of time scales(long-range dependence),provides a clear indication of some sort of collective effect. Moreover,using our interpretation,the graphs in Fig.5 show that long-range dependence decays as T increases for the same system size,L,and that long-range depen-
Fig.3.Time series of queue length(Nr)at three time granularities T=1,10,and100. The total time shown on this,and similar graphs,is equal to T?t,the sample interval size(T)multiplied by the number of sample intervals(t).
dence holds for the same time granularity as system size increases.This suggests that congestion dissipates more slowly as network size increases,that is,a larger net-work seems to have a more pronounced correlative structure.W e believe such behavior occurs because net-work traffic experienced at a node consists of transient packet flows transiting across a mixture of short and long distances,and modulated by adaptive congestion-control algorithms.
T o investigate this behavior more directly,we devel-oped a technique to monitor the congestion present in aggregate among all nodes in our network model.Our technique maps the three-dimensional(3-D)structure (L?L?Nr)of the network state onto a two-dimen-sional(2-D)binary pattern.T o achieve such a mapping, we set a threshold parameter Y against which to compare the state(i.e.,the queue length)of every node.If the queue length of the node r is less than or equal to Y,then the state value br of the binary network is set equal to zero,otherwise one.In this way,the network state can be mapped from three dimensions onto a2-D grid,as shown for example in Fig.6where black blocks repre-sent congested nodes(for Y=5),and white blocks depict congestion-free https://www.360docs.net/doc/334511985.html,ing such a2-D map proves more convenient then a3-D map when visualiz-ing the evolution of network state.Such maps provide a more readily comprehensible view of the spatial correla-tion of network congestion.As time progresses,the congestion state of a node in a large network depends more on the congestion state of its neighboring area.This idea was first proposed by researchers who modeled the propagation of congestion between neighboring routers based on contact processes with a Cayley tree[10].Using the2-D grid,we can determine the number of congested nodes(y)in our model at any time granularity T,and then record y as a time-series representing the system state for any number of sample intervals t.In Fig.7we show a time series of congested nodes for a system size L=16at three time granulari-ties:T=10,100,and1000.As the figure shows,we find generally that as the time granularity,T,increases, the number of congested nodes,y,changes less smoothly.This suggests that congested nodes exhibit stronger interdependence at smaller time scales.
T o explore the relationship among time scale, network size,and congestion,we plot several power spectra in Fig.8at various network sizes and time granularities.Figures8(a)-(c)illustrate that increasing the time granularity for the same network size leads to a reduced appearance of1/f-like noise.For example, comparing the two curves in Fig.8(a)(network size L=8),we find some autocorrelation in the curve T=50 but the curve for T=400appears almost flat,suggesting little autocorrelation in the https://www.360docs.net/doc/334511985.html,paring this curve for T=400against the curve for the same time granular-ity but at network size L=32,shown in Fig.8(c),we
Fig.4.Time series of?out at three time granularities T=40,100,and500.
find that as the network size increases from L =8to L =32the long-range dependence increases for a given time granularity.T o us,these results suggest that collec-tive behavior in a larger network causes more profound influence on network congestion and on predictability.If true,these factors might prove meaningful for the design of congestion-control and traffic-engineering mechanisms in networks.
W e suspect that 1/f noise arises from the collective effect of many interacting network flows,independent of specific details associated with network protocols.Furthermore,as indicated by Fig.8,the collective effect appears to strengthen as system size increases,but to diminish as time granularity increases.At very large time scales,the evidence of collective effect does not appear;instead,the power spectra tend toward white-ness as the sample interval (T )exceeds some size.These observations suggest that some time-granularity threshold might exist within which the network can be viewed as a coherent whole (that is,a time granularity where the network congestion signal exhibits the most pronounced 1/f -like appearance).W e can refer to this granularity as the coherent time scale.As shown by Fig.8,the larger the network,the greater the coherent time scale,because 1/f -like noise appears at larger sample intervals.On the other hand,our results also suggest some difference in the evolution of congestion between large and small networks.In our spectral
Fig.6.2-D map of congested network nodes.
Fig.5.Power spectrum S out of ?out with (a)L =8for T =80and 400,(b)L =16for T =200and 600,and (c)L =32for T =400and 1000.
analyses,a larger network,such as L=32in Fig.8(c), retains a more1/f-like appearance at larger time scales than does a smaller network.On the contrary,as plotted in Fig.8(a),the1/f-like appearance in the congestion signal appears to decay faster as T increases in the smaller network(L=8).T o us,these results confirm that a congestion-control system or a traffic-manage-ment regime has more time available(a larger coherent time scale)to respond to congestion in a larger network, because the congestion diminishes rather more slowly than in smaller networks.Of course,the management of a large network also requires more time.The effective-ness of control methods may fall off gradually once their reaction time exceeds a certain threshold.Discussion regarding the influence of these findings on concrete network management techniques is beyond the content of this paper.
Considering the collective dynamics of a network and the relationship between network size and time granu-larity,we find that for a given network size one must expect more volatility in congestion as the sample interval increases.W e have compared our TCP and CAC congestion-control algorithms against cases where the network does not control congestion.These latter experiments,not reported in this paper,modulate congestion by varying the intensity of source traffic. Across all of our experiments,we find that long-range dependence emerges at different time scales,seeming to depend not only on network size but also on traffic intensity and congestion-control algorithm.
One particular phenomenon observed in our current experiments might provide some useful insight for researchers attempting to explore behavior in communi-cation networks.Our results suggest that the congestion response of a sub-area in a larger network may have different features compared with a smaller network with the same size as the sub-area.For example,Fig.9 illustrates a binary network pattern with L=32and indicates two sub-areas with sizes l=8and16.Each sub-area appears as an interconnected or interwoven part of the larger network;thus,these sub-areas play an indispensable role in global emergence,where collective behavior pertains to the system as a whole. Extracting such sub-areas,by isolating them from the
Fig.7.Time series of the number of congested nodes,y,with congestion threshold,Y=5,at three different time scales:T=10,100,and1000.
original network into a smaller network with system size L =l,ignores various relationships or interdependencies,and may lead to inaccurate analysis regarding some aspects of dynamic behavior in a large network.W e demonstrate this effect in Fig.10.
Figure 10(a)compares the power spectrum of the number of congested nodes,y,at a comparable time granularity,T =200,for a network of size L =8against a sub-area of comparable size,l =8,from within a larger network with size L =32.Figure 10(b)provides a similar comparison,except that the time granularity is increased to T =400,and the network size and sub-area size are increased to L =16and l =16,respectively.These figures suggest that sub-areas exhibit stronger dependence with respect to congestion than networks of the same size and time scale.For this reason,network researchers interested in the behavior of networks of a certain size L would be well advised to investigate such networks as sub-areas of size l =L within a larger network.Further,these results also suggest that network researchers should strive to investigate the effects of network congestion and cross traffic within topologies exhibiting sufficiently large scale.The global conges-tion behavior of a network can look quite different depending upon whether a set of identical nodes is arranged in a small or large network.This might repre-sent a caution for researchers who rely on detailed,discrete-event simulations,because simulation models can take substantial computing resources and memory as the size of the topology increases.Yet,a sizeable topology appears necessary in order to approximate the effects of congestion within even a restricted sub-area.
4.Discussion
We aim to understand collective dynamics in large networks,where cause-effect relationships might not be inferred readily from the behavior of individual nodes.Our current results suggest how such collective dynamics might arise and evolve.We start with a disordered network,where the nodes act in a random way (based on a memoryless input process),and where any propagating influence will be dispersed and dissi-pated quickly.Initially,we saw that nodes were only interacting locally.Such locality of interaction follows from the basic continuity of physical processes:for any influence to pass from one region to another it must first pass through all intermediate regions.During the time that the process propagates through the intervening regions,it will be disturbed by all the fluctuations
Fig.8.Power spectrum of S y (f )of y with (a)L =8for T =50and 400;(b)L =16for T =200and 600;and (c)L =32for T =400and 1000.
taking place within those regions.As a result,in the network’s original disordered state,distant parts of the network do not influence each other:they appear independent.Over time,as feedback control mecha-nisms adapt to changes in network congestion in all directions,a discernable structure increases gradually and then continues to evolve.Eventually,the discernable structure expands into a global order.These effects depend upon the size of the network,appearing more strongly over greater time scales as network size increases.
No approach to simulation can describe the behaviors of the real Internet completely.Given the state-of-the-art,it is currently within reach to develop good temporal models to study performance at a single node or in a small network(i.e.,to represent a smaller part of a larger network).W e believe we have shown that it would be desirable,and perhaps feasible,to devise models to study the spatial-temporal performance of a large net-work as a whole.T o achieve such an outcome requires that simplifications be made.While our modeling method seems an extreme simplification,especially in terms of the regular topology,the homogeneous links and nodes,and the routing of traffic,we do maintain the individual identity of packets and we believe that our model captures important details,such as feedback con-gestion control,that might be missed in other network simulations.Our model enables us to explore collective dynamics in reasonably large networks,up to1024 nodes so far.Our model also drives2-D and3-D anima-tions(not described in this paper)that give an intuitive view of network behavior over time and against key parameters.
5.Future Work
The results reported in this paper,as well as else-where[8,9,14-16],encourage us to continue our investigations into the collective dynamics of large networks.W e foresee three directions in our immediate future plans.First,we need to incorporate into our network model additional traffic sources and control mechanisms related to providing quality of service.As more and more high-speed access links are added to the Internet,the nature of traffic can be expected to change, perhaps leading to an increasing quantity of streaming multimedia traffic and large file transfers,as well as increases in traffic from various interactive group games and from instant messaging applications.In addition,the pattern of source-destination pairs may evolve as users begin to move toward increased peer-to-peer communi-cations.In addition to changing traffic patterns among network nodes,evolving Internet use might alter the balance between TCP and non-TCP traffic.Such changes will increase the criticality of deploying mechanisms to provide quality of service.While
Fig.9.A binary pattern of network congestion in a network of size,L=32,and identifying two sub-areas with sizes l=8and l=16.
researchers have provided an understanding of the properties of various quality-of-service mechanisms on a local scale,the effects of such mechanisms have not been studied on a global scale in large networks. Second,we must increase the size of our model in order to improve our ability to identify and understand emergent phenomena,and especially congestion dynamics,at Internet scale.The current work reports a maximum network of1024nodes(L?L=32?32= 1024)and4096links(four links per node).Using MA TLAB,we were able to model a network of this size; however,to execute the behavior of the network for two million time steps requires10days of CPU time on a 750MHz Pentium III with128MB of memory.W e intend to recode our model using C or C++in an effort to achieve a network size on the order of16000nodes and64000links.Such an increase in size should enable us to enhance our ability to identify and understand emergent phenomena.T o reach our ultimate intended network size,on the order of105to106nodes and links, we might require a parallel processing system.Such systems appear well suited to cellular automata[23]. With a network model of sufficient size,we can undertake a systematic search to identify,understand, and perhaps explain,significant emergent phenomena in large networks.This represents our third avenue for future work.In this case,we must develop theories regarding the most likely emergent phenomena,and then test those theories with a systematic set of experi-ments.From this work,we might well provide guidance to researchers seeking to measure Internet behavior on a global scale.In particular,we might identify specific phenomena and related measurement data that could be collected by experimenters in order to confirm or refute the presence of emergent phenomena within the Internet.
6.Conclusions
When attempting to analyze network behavior by examining the behavior of constituent components, researchers can develop the misconception that uncer-tainty regarding network congestion and resource consumption increases with network size.W e argue that the opposite holds.W e find that correlation in conges-tion among network nodes can be expected to persist at larger time granularities as system size increases,and we also find network size and time granularity to be two closely related aspects of the spatial-temporal dynamics of a network.This suggests that as network size increases,the collective behavior of a network might well become more predictable.Such predictability arises from global emergence,where chain reactions move through the whole system.As the system becomes larger,the correlated interactions persist.As we show, such collective behavior cannot be realized from the analysis of individual network components. Although in this paper we do consider two simplified congestion-control algorithms,we must still evaluate the collective dynamics of large networks that include additional mechanisms,such as differentiated services and routing updates.However,more important challenges revolve around issues of scale.W e need to scale the network model up to a million nodes,so that we can investigate multi-scale,spatial-temporal dynam-ics.This suggests a need to employ a parallel program-ming environment to study multiple-timescale traffic patterns and network performance,and to identify and understand even more interesting phenomena arising only in sufficiently large networks.W e believe that simulating networks at an appropriately large size is key for researchers to gain insight regarding behaviors that might emerge within the Internet.
Fig.10.Power spectra S y(f)of number of congested nodes,y,with (a)L=8compared against sub-area,size l=8,in a network of size L=32for T=200and(b)L=16compared against sub-area,size l=16,in a network of size L=32for T=400.
Acknowledgments
The manuscript benefited greatly from review by Stefan Leigh,Doug Montgomery,T assos Nakassis,and T ed V orburger.W e also appreciated the advice of Bert Rust,who helped us ensure our spectral plots were properly graphed and presented.W e accept sole respon-sibility for any remaining ambiguity,inconsistency,or other errors.
7.References
[1]Yaneer Bar-Yam,The Dynamics of Complex Systems(Studies
in Nonlinearity),ISBN0-201-55748-7,August1997.
[2]V.Paxson,End-to-End Internet Packet Dynamics,IEEE/ACM
Transactions on Networking7(3),277-292,1999.
[3]B.Liu,Y.Guo,J.Kurose,D.Towsley,and W.Gong,Fluid
simulation of large scale networks:issues and tradeoffs,in Proceedings of the International Conference on Parallel and Distributed Processing Techniques and Applications,June 28-July1,1999.Volume IV,Las Vegas,NV,pp.2136-2142.
[4]D.Nicol,M.Goldsby,and M.Johnson,Fluid-based Simulation
of Communication Networks using SSF,Proceedings of the 1999European Simulation Symposium,October1999, Erlangen-Nuremberg,Germany.
[5]J.Cowie,H.Liu,J.Liu,D.Nicol,and A.Ogielski,Towards
Realistic Million-Node Internet Simulations,in Proceedings of the1999International Conference on Parallel and Distributed Processing Techniques and Applications(PDPTA’99),June 28-July1,1999,Las Vegas,Nevada.
[6]Hung-Ying Tyan and Chao-Ju Hou,JavaSim:A component-
based compositional network simulation environment,Western Simulation Multiconference—Communication Networks And Distributed Systems Modeling And Simulation,January2001.
[7]I.Csabai,1/f Noise in Computer Network Traffic,J.Phys.,A27
(12),L417-L421(1994).
[8]T.Ohira and R.Sawatari,Phase transition in computer network
traffic model,Phys.Rev.E58,193-195(1998).
[9]J.Yuan,Y.Ren,F.Liu,and X.Shan,Phase transition and
collective correlation behavior in the complex computer net-work,Acta Physica Sinicia50(7),1221-1225,July2001. [10]M.Takayasu,H.Takayasu,and T.Sato,Critical behaviors and
1/f noise in information traffic,Physica A233,824-834(1996).
[11]K.Fukuda,M.Takayasu,and H.Takayasu,Spatial and temporal
behavior of congestion in Internet traffic,Fractals7,23-31 (1999).
[12]J.von Neumann,Theory of Self Reproducing Automata,
University of Illinois Press(1966).
[13]N.Gershenfeld,Cellular Automata and Lattice Gases,in The
Nature of Mathematical Modeling,Cambridge University Press (1999)pp.102-110.
[14]J.Yuan,Y.Ren,and X.Shan,Self-Organized Criticality in a
Computer Network Model,Phys.Rev.,E61(1),1067-1071 (2000).
[15]H.Fuks and https://www.360docs.net/doc/334511985.html,wniczak,Performance of data networks
with random links,https://www.360docs.net/doc/334511985.html,puters Simulation51,101-117 (1999).
[16]R.V.Sole and S.Valverde,Information transfer and phase
transitions in a model of Internet traffic,Physica A289(3-4), 595-605(2001).[17]A.Feldmann, A. C.Gilbert,P.Huang,and W.Willinger,
Dynamics of IP traffic:A study of the role of variability and the impact of control,in Proc.ACM SIGCOMM’99,301-313 (1999).
[18]K.Park,Future directions and open problems in performance
evaluation and control of self-similar network traffic,in K.Park and W.Willinger,eds.,Self-Similar Network Traffic and Perfor-mance Evaluation,Wiley-Interscience(2000).
[19]A.V eres,M.Boda,The chaotic nature of TCP congestion
control,in IEEE INFOCOM2000,T el A viv,Mar.2000,pp.
1715-1723.
[20]W.Feng and P.Tinnakornsrisuphap,The adverse impact of the
TCP congestion-control mechanism in heterogeneous computing systems,in Proc.of the Int’l Conf.on Parallel Processing (ICPP’00)August2000.
[21]B. A.Huberman and R.M.Lukose,Social dilemmas and
Internet congestion,Science277,535-537(1997).
[22]P.Bak,How Nature W orks:the science of self-organized
criticality,Copernicus,New Y ork(1996).
[23]D.Hutchinson et al.,Parallel Neighborhood Modeling:
Research Summary,in Proceedings of Symposium on Parallel Algorithms and Applications96,CAM Press,New Y ork(1996) pp.204-207;B.P.Zeigler et al.,The DEVS Environment for High-Performance Modeling and Simulation,IEEE Computa-tional Sci.Eng.4(3),61-71(1997).
[24]M.Schroeder,Fractals,Chaos,Power Laws:Minutes from an
Infinite Paradise,W.H.Freeman and Company,New Y ork (1991).
About the authors:Jian Yuan is a guest researcher at NIST.Kevin Mills is a senior research scientist in the Advanced Network T echnologies Division of the Information T echnology Laboratory at NIST.The National Institute of Standards and T echnology is an agency of the T echnology Administration,U.S. Department of Commerce.
土地开发整理分类介绍
根据土地开发整理内容的不同,土地开发整理可分为三种类型:土地整理、土地复垦、土地开发。 (一)土地整理土地整理是指在一定区域内,按照土地利用总体规划、土地开发整理专项规划确定的目标和用途,通过采取行政、经济、法律和工程技术手段,对土地利用状况进行调整、改造、综合整治,提高土地利用率,改善生产、生活条件和生态环境。 根据土地整理后的主导用途,可将土地整理分为农用地整理和建设用地整理。 1、农用地整理农用地整理是指在一定区域内,依据土地利用总体规划及有关专项规划,采取行政、经济、法律和工程技术措施,对田、水、路、林、村等进行综合整治,以调整土地关系,改善土地利用结构和生产、生活条件,增加土地有效供给量,提高农用地质量,提高土地利用率和产出率的过程。农用地整理包括农用地调整、农用地改造、地块规整、基础设施配套、零星农宅的迁并等,具体内容包括农用地面积、位置的变动、性质的置换、低效农用地的改造以及地块规整重划,水、电、路等小型基础设施配套和零星农宅的迁出或合并。农用地整理可根据整理后的主导用途分为耕地整理、园地整理、林地整理、牧草地整理和养殖水面整理等。(1)耕地整理。耕地整理是指对农田进行的整理。耕地整理的主要工程内容包括:土地平整工程、农田水利工程、田间道路工程、其他工程(如农田防护林工程、生态环境保护工程等)。(2)园地整理。园地整理主要指果园、桑园、橡胶园和其他经济园林用地的
整理。(3)林地整理。林地整理包括防护林、用材林、经济林、薪炭林、特种林地的整理。(4)牧草地整理。牧草地整理包括放牧地整理和割草地整理。(5)养殖水面用地整理。养殖水面用地整理主要指人工水产养殖用地整理。 2、建设用地整理建设用地整理是以提高土地集约利用为主要目的,采取一定措施和手段,对利用率不高的建设用地进行综合整理。建设用地整理包括村镇用地、城镇用地、独立工矿用地、交通用地和水利设施用地以及其他建设用地的整理。 (1)村镇用地整理。村镇用地整理包括村镇的撤并、撤迁和就地改扩建。 (2)城镇用地整理。城镇用地整理主要指城镇建成区内的存量土地的挖潜利用、旧城改造、用途调整和零星闲散地的利用。 (3)独立工矿用地整理。独立工矿用地整理主要指就地开采、现场作业的工矿企业和相配套的小型居住区用地的布局调整、用地范围的确定和发展用地选择,一般不包括大规模废弃地复垦。(4)基础设施用地整理。基础设施用地整理包括公路、铁路、河道、电网、农村道路、排灌渠道的改线、裁弯取直、疏挖和厂站的配置、堤坝的调整,也包括少量废弃的路基、沟渠等的恢复利用。 (二)土地复垦土地复垦是指对生产建设过程中因挖损、塌陷、压占等造成破坏而废弃的土地,采取一定措施,使其恢复到可利用的状况。土地复垦包括工矿企业在生产建设过程中挖损、塌陷、压占等造成
【操作系统】Windows XP sp3 VOL 微软官方原版XP镜像
操作系统】Windows XP sp3 VOL 微软官方原版XP镜像◆ 相关介绍: 这是微软官方发布的,正版Windows XP sp3系统。 VOL是Volume Licensing for Organizations 的简称,中文即“团体批量许可证”。根据这个许可,当企业或者政府需要大量购买微软操作系统时可以获得优惠。这种产品的光盘卷标带有"VOL"字样,就取 "Volume"前3个字母,以表明是批量。这种版本根据购买数量等又细分为“开放式许可证”(Open License)、“选择式许可证(Select License)”、“企业协议(Enterprise Agreement)”、“学术教育许可证(Academic Volume Licensing)”等5种版本。根据VOL计划规定, VOL产品是不需要激活的。 ◆ 特点: 1. 无须任何破解即可自行激活,100% 通过微软正版验证。 2. 微软官方原版XP镜像,系统更稳定可靠。 ◆ 与Ghost XP的不同: 1. Ghost XP是利用Ghost程序,系统还原安装的XP操作系统。 2. 该正版系统,安装难度比较大。建议对系统安装比较了解的人使用。 3. 因为是官方原版,因此系统无优化、精简和任何第三方软件。 4. 因为是官方原版,因此系统不附带主板芯片主、显卡、声卡等任何硬件驱动程序,需要用户自行安装。 5. 因为是官方原版,因此系统不附带微软后续发布的任何XP系统补丁文件,需要用户自行安装。 6. 安装过程需要有人看守,进行实时操作,无法像Ghost XP一样实现一键安装。 7. 原版系统的“我的文档”是在C盘根目录下。安装前请注意数据备份。 8. 系统安装结束后,相比于Ghost XP系统,开机时间可能稍慢。 9. 安装大约需要20分钟左右的时间。 10. 如果你喜欢Ghost XP系统的安装方式,那么不建议您安装该系统。 11. 请刻盘安装,该镜像用虚拟光驱安装可能出现失败。 12. 安装前,请先记录下安装密钥,以便安装过程中要求输入时措手不及,造成安装中断。 ◆ 系统信息:
软件开发
《软件开发工具》串讲笔记 一、绪论 1、简述软件开发工具的范围?在高级程序设计语言的基础上,为提高软件开发的质量和效率,从规划、分析、设计、测试、成文和管理各方面,对软件开发者提供各种不同程序帮助的一类新型软件。 2、简术用通用软件辅助软件开发的缺点?有许多工作是通用软件所无法完成的;用通用软件完成某些工作,只能表现出其表面的形式,而不能反映其逻辑内涵,只能做到“形似”,不能做到“神似”;难于保持一致性。 3、简述集成化软件开发工具产生的背景?集成的软件开发工具称为软件开发环境,是指包括支持全过程、全阶段的软件开发工具。以往的专用软件开发工具对软件的开发缺乏全面的、统一的支撑环境。这些零散地、分散地支持各个工作阶段、各项具体工作的专用工具之间没有有机地联系起来,必然会造成冲突与矛盾。这种冲突与矛盾对于用户来说,造成了沉重的负担,使用工具越多这种负担越重,以致抵消了工具带来的益处。这种情况导致了集成化软件开发工具的产生。 4、简述第四代语言与软件开发工具的区别?软件开发工具包括4GL的功能;软件开发工具支持系统分析、设计工作;软件开发工具支持文档工作。 5、简述软件开发总体设计阶段的工作要点?是根据软件功能说明书的要求,完成软件的总体设计,包括整个软件的结构设计、公用的数据文件或数据库的设计、各部分的连接方式及信息交换的标准等。 6、简述软件开发实现阶段的工作,以及应强调之点。包括程序的编写和文档的编写,应特别强调组织与协调,及时发现并纠正背离总体设计要求的情况。 7、简述软件开发工具认识与描述客观系统的功能要求?认识与描述客观系统是软件开发第一阶段所需的重要工作。该项工作不确定程度高,更需要经验,更难规范化,需要对复杂系统认识与理解,并在此基础上抽象出信息需求与信息流程。 8、简述软件开发的项目管理功能?为项目管理人员提供支持。项目管理包括进度管理、资源与费用管理、质量管理三个基本内容。还包括需要提出测试方案,提供测试环境和测试数据,并进行版本管理。 9、从人类科学技术发展的角度论述软件的意义?软件是广大使用者与计算机之间的桥梁,软件是人类在各个领域中积累的知识结晶,软件是使人类文明与知识得以延续的新的载体,软件是人类进一步成为一个整体、得以进一步相互联系的纽带。 10、论述第一代到第四代程序设计语言的主要特征?第一代程序设计语言就是计算机的指令系统。用户用机器指令编写程序。这种程序就是机器指令的序列,由“0”和“1”组成,难于阅读,难于维护,而且程序高度依赖于计算机硬件,难于移植。第二代语言是汇编语言,其中每个语句是用助记符动工表示的机器指令。虽然可读性和可移植性方面前进了一步,但依然依赖于计算机硬件。第三代语言也称为高级程序设计语言,其中的语句与机器指令并不一一对应,尤其是表达式的书写与人们的习惯基本相同。程序员需要逐行编写语句来实现算法的过程,因此,它属于过程化的语言。第四代语言是非过程化的程序设计语言,用户只说明要求做什么,而把具体的执行步骤交由软件自动执行。 11、说明软件开发工具和新的软件开发方法的主要特点?自动化程序提高;软件开发工作包括了需求分析;软件开发工作包括了项目管理和版本管理;吸收了许多管理科学的内容和方法。 12、说明软件产品开发过程各个阶段的主要任务。需求分析阶段:根据用户的初始要求形成严格的、明确的、可供实际开发使用的功能说明书;总体设计阶段:根据软件功能说明书的要求,完成软件的总体设计;实现阶段:程序的编写和文档的编写;测试阶段:测试软件是
Windows7 SP1官方原版下载
Windows7 SP1官方原版 以下所有版本都为Windows7 SP1官方原版,请大家放心下载! 32位与64位操作系统的选择:https://www.360docs.net/doc/334511985.html,/Win7News/6394.html 最简单的硬盘安装方法:https://www.360docs.net/doc/334511985.html,/thread-25503-1-1.html 推荐大家下载旗舰版,下载后将sources/ei.cfg删除即可安装所有版本,比如旗舰,专业,家庭版。 ============================================ Windows 7 SP1旗舰版中文版32位: 文件cn_windows_7_ultimate_with_sp1_x86_dvd_u_677486.iso SHA1:B92119F5B732ECE1C0850EDA30134536E18CCCE7 ISO/CRC:76101970 cn_windows_7_ultimate_with_sp1_x86_dvd_u_677486.iso.torrent(99.63 KB, 下载次数: 326189) Windows 7 SP1旗舰版中文版64位: 文件cn_windows_7_ultimate_with_sp1_x64_dvd_u_677408.iso SHA1: 2CE0B2DB34D76ED3F697CE148CB7594432405E23 ISO/CRC: 69F54CA4 cn_windows_7_ultimate_with_sp1_x64_dvd_u_677408.iso.torrent(128.17 KB, 下载次数: 197053)
自考软件开发工具串讲笔记
《软件开发工具》串讲笔记 第一章绪论 重点背诵: 1、对于CASE工具有两种理解,一种是“计算机辅助软件工程”,另一种是“计算机辅助系统工程”。 2、软件开发工具是引导人们建立正确、有效的概念模式的一种手段。 3、从几十年软件开发工具发展历史中,可以看到软件开发工具一个值得注意的特点是多样性和趋同性的并存。 4、进入二十一世纪以来,软件开发工具的发展有两个鲜明的特点,第一个特点是面向网络,另一个特点是开源软件的兴起和运用。 5、当前我们所要开发的信息系统不同于以前。其重要特征是具有复杂性、多样性和相互关联性。 1.1 软件开发工具的由来 (1)简述软件开发工具的范围? 在高级程序设计语言(第三代语言)的基础上,为提高软件开发的质量和效率,从规划、分析、设计、测试、成 文和管理各方面,对软件开发者提供各种不同程序帮助的 一类新型软件。 (2)软件开发工具的发展过程 包括以下四个阶段:工具产生之前、通用工具的使用、专用
工具的出现、一体化工具的出现。
论述工具产生之前,第一代到第四代程序设计语言的主要特征? 1)第一代机器语言阶段:使用“0”和“1”代码进行编程,难于阅读,难于维护,而且程序高度依赖于计算机硬件,难于移植;2)第二代汇编语言:使用助记符来编写程序,由汇编系统将汇编指令转化为机器指令,编程工作量大大降低,但依然依赖于计算机硬件。与此同时,操作系统的出现从另一方面改善了人们应用计算机的条件; 3)第三代高级程序设计语言,高级语言突破了与机器指令一一对应的限制,实现了对机器的独立性,从而大大提高了程序的可移植性。程序员需要逐行编写语句来实现算法的过程,因此它属于过程化的语言; 4)第四代语言(4GL)是非过程化的程序设计语言,用户只说明要求做什么,而把具体的执行步骤交由软件自动执行。 5)利用通用软件作为辅助工具的阶段 利用文字处理软件来编写文档,利用绘图软件来绘制流程图。6)专用软件开发工具阶段 专用软件开发工具是面对某一工作阶段或工作任务的工具,优点是能提高软件开发的质量和效率;缺点是一致性的保持,对软件开发缺乏全面的、统一的支撑环境。
土地开发整理的意义
土地开发整理的意义 近日,**工业区**土地开发整理项目顺利通过验收,欣喜之余,心想一年来的奔波也算是得到了“丰收”。一年的忙碌,换来老百姓的感激,还有什么比这个奖励更有意义呢? 土地开发整理是指在一定区域内,按照土地利用总体规划、城市规划、土地开发整理专项规划确定的目标和用途,通过采取行政、经济、法律和工程技术等手段,对土地利用状况进行调查、改造、综合整治、提高土地集约利用率和产出率,改善生产、生活条件和生态环境的过程。**工业区山丘面积比重大,自然生态环境恶劣、土地利用条件差、利用率低,已成为影响当地经济发展的制约因素;人口多耕地少,原有土地大多顺坡耕种,土层薄,土壤结构松散,保水保肥能力差,易涝怕旱;土地利用结构也不合理,产量低而不稳,受自然灾害影响比较大,致使农业基础比较薄弱;植被稀少,生态防护效能差,水利设施不配套,灌溉无保证,限制了农业生产的进一步发展。今年进行土地开发整理的**村土地地表高低起伏,土地利用率不高,本着以平整改造荒废地、提高土地利用率、增加耕地面积为主的目的,整理土地1662亩,完成新增耕地895亩。土地整治中,实行田、水、路、林统一规划,既增加了耕地面积、提高了土地利用率,又方便了耕作和田间管理,在多方面都具有积极的意义。
社会效益方面:“三农问题”一直制约着经济的发展,如何为老百姓谋福利是当前政府的重中之重。土地开发整理正是本着为老百姓谋福利这一目的,让老百姓得实惠,促进社会的和谐发展。**项目完成后,土地使用率明显提高,缓解了项目区人多地少的矛盾,增加农业产量,增加农民收入,促进社会经济发展。项目修建田间道路、生产路总长7147米,方便了交通,有利于农业机械作业,改善了耕作条件和生产条件,促进了农业机械化的发展,为农副产品的运销打下了良好的基础,同时加快了农村基础设施建设,改变了脏、乱、差的面貌。项目全部完成后,可极大地改善农村生态环境,提高农民的生活水平。 经济效益方面:实施土地开发整理,提高了项目区原有土地的质量和产值,能有效地增加耕地面积。在农业综合效益方面,土地整理项目不仅通过项目发挥作用为农民带来收益,还在项目建设过程中,吸纳当地农民参与项目建设,解决剩余劳动力的就业问题,直接为农民增收创造了条件。原来灌溉农田时,农民用水泵浇灌,农田水利工程建设完工后,变成了用机电井低压管道灌溉,极大地改善了农民生产条件,节省了灌溉成本,减轻了劳动强度,减少了劳动力投入。**项目区总面积1662亩,总投资195.28万元,新增耕地895亩,用于种植小麦、生姜、地瓜、花生等,年增收入107.45万元。
Microsoft 微软官方原版(正版)系统大全
Microsoft 微软官方原版(正版)系统大全 微软原版Windows 98 Second Edition 简体中文版 https://www.360docs.net/doc/334511985.html,/viewthread.php?tid=16446&page=1&extra=#pid125031 微软原版Windows Me 简体中文版 https://www.360docs.net/doc/334511985.html,/viewthread.php?tid=16448&highlight=%CE%A2%C8%ED%D4%AD %B0%E6 微软原版Windows 2000 Professional 简体中文版 https://www.360docs.net/doc/334511985.html,/viewthread.php?tid=16447&highlight=%CE%A2%C8%ED%D4%AD %B0%E6 微软原版Windows XP Professional SP3 简体中文版 https://www.360docs.net/doc/334511985.html,/viewthread.php?tid=16449&page=1&extra=#pid125073微软原版Windows XP Media Center Edition 2005 简体中文版 https://www.360docs.net/doc/334511985.html,/viewthread.php?tid=16451&highlight=%CE%A2%C8%ED%D4%AD %B0%E6 微软原版Windows XP Tablet PC Edition 2005 简体中文版 https://www.360docs.net/doc/334511985.html,/viewthread.php?tid=16450&highlight=%CE%A2%C8%ED%D4%AD %B0%E6 微软原版Windows Server 2003 R2 Enterprise Edition SP2 简体中文版(32位) https://www.360docs.net/doc/334511985.html,/viewthread.php?tid=16452&highlight=%CE%A2%C8%ED%D4%AD %B0%E6 微软原版Windows Server 2003 R2 Enterprise Edition SP2 简体中文版(64位) https://www.360docs.net/doc/334511985.html,/viewthread.php?tid=16453&highlight=%CE%A2%C8%ED%D4%AD %B0%E6 微软原版Windows Vista 简体中文版(32位) https://www.360docs.net/doc/334511985.html,/viewthread.php?tid=16454&highlight=%CE%A2%C8%ED%D4%AD %B0%E6 微软原版Windows Vista 简体中文版(64位) https://www.360docs.net/doc/334511985.html,/viewthread.php?tid=16455&highlight=%CE%A2%C8%ED%D4%AD %B0%E6 微软原版 Windows7 SP1 各版本下载地址: https://www.360docs.net/doc/334511985.html,/viewthread.php?tid=12387&highlight=%CE%A2%C8%ED%D4%AD %B0%E6 微软原版 Windows Server 2008 Datacenter Enterprise and Standard 简体中文版(32位) https://www.360docs.net/doc/334511985.html,/viewthread.php?tid=16457&highlight=%CE%A2%C8%ED%D4%AD %B0%E6 微软原版 Windows Server 2008 Datacenter Enterprise and Standard 简体中文版(64位) https://www.360docs.net/doc/334511985.html,/viewthread.php?tid=16458&highlight=%CE%A2%C8%ED%D4%AD %B0%E6 微软原版 Windows Server 2008 R2 S E D and Web 简体中文版(64位) https://www.360docs.net/doc/334511985.html,/viewthread.php?tid=16459&highlight=%CE%A2%C8%ED%D4%AD %B0%E6
软件工程笔记完整版
. 第一章软件工程概述 1.软件危机 (software crisis):是指在计算机软件的开发和维护过程中所遇到的一系列严重问题。即“两低一高”问题:质量低、效率低、成本高。 软件危机也成为“软件萧条(depression)”或“软件困扰(afflication)” 2.软件危机主要表现 1)开发成本和进度估计不准 2)用户对“已完成的”软件系统不满意 3)软件质量往往靠不住 4)软件常常是不可维护的 5)软件通常没有适当的文档资料 6)软件成本逐年上升 7)软件开发生产率滞后于硬件和计算机应用普及的趋势 3.产生软件危机的原因 1)与软件本身的特点有关 a. 软件不同于硬件,是逻辑部件而不是物理部件 缺乏可见性 难于测试 管理和控制开发过程困难 不会因使用时间过长而被“用坏” 难以维护 b.软件不同于一般程序,规模庞大,而且程序复杂性随着程序规模的增加而呈指数上升 2)和软件开发与维护的方法不正确有关 a.对软件开发和维护有关的错误认识和作法 忽视软件需求分析的重要性 认为软件开发就是写程序 轻视软件维护 b. 对软件开发过程与方法的认识与应用 软件开发要经历一个漫长的时期(编程占10-20%) 程序仅是完成软件配置的一个组成部分 软件开发方法要有利于软件维护 4.软件的特点 (1)软件是无形的(intangible) (2)软件副本的大批量生产轻而易举 (3)软件业是劳动密集型的 (4)一个没有经过充分训练的软件开发人员很容易编写出难以理解和修改的软件 (5)软件本身很容易修改。但由于它的复杂性,又很难正确地修改。 (6)软件不像其他的工业产品那样会因使用而磨损,随着反复修改,它的设计会逐渐退化 5.消除软件危机的途径 1)对计算机软件的正确认识 2)认识到软件开发不是个体劳动的神秘技巧,而是一种组织良好、管理严密、各类人员协
windows正版系统+正版密钥
精心整理正版Windows系统下载+正版密钥 2010-05-3011:49 喜欢正版Windows系统 这是我收集N天后的成果,正版的Windows系统真的很好用,支持正版!大家可以用激活工 具激活!现将本收集的下载地址发布出来,希望大家多多支持! Windows98第二版(简体中文) 安装序列号:Q99JQ-HVJYX-PGYCY-68GM3-WXT68 安装序列号:Q4G74-6RX2W-MWJVB-HPXHX-HBBXJ 安装序列号:QY7TT-VJ7VG-7QPHY-QXHD3-B838Q WindowsMillenniumEdition(WindowME)(简体中文) 安装序列号:HJPFQ-KXW9C-D7BRJ-JCGB7-Q2DRJ 安装序列号:B6BYC-6T7C3-4PXRW-2XKWB-GYV33 安装序列号:K9KDJ-3XPXY-92WFW-9Q26K-MVRK8 Windows2000PROSP4(简体中文) SerialNumber:XPwithsp3VOL微软原版(简体中文) 文件名:zh-hans_windows_xp_professional_with_service_pack_3_x86_cd_vl_x14-74070.iso 大小:字节 MD5:D142469D0C3953D8E4A6A490A58052EF52837F0F CRC32:FFFFFFFF 邮寄日期(UTC):5/2/200812:05:18XPprowithsp3VOL微软原版(简体中文)正版密钥: MRX3F-47B9T-2487J-KWKMF-RPWBY(工行版)(强推此号!!!) QC986-27D34-6M3TY-JJXP9-TBGMD(台湾交大学生版) QHYXK-JCJRX-XXY8Y-2KX2X-CCXGD(广州政府版)
(考研复试)软件工程笔记培训资料
(考研复试)软件工程 笔记
1:软件危机:问题1:如何开发软件,以满足对软件日益增长的需求。问题2:如何维护数量不断膨胀的软件。表现:对软件开发成本和时间估计不准,用户对已完成软件不满意,软件质量不可靠,软件不可维护,软件缺少文档,软件成本过高,软件跟不上硬件发展速度。原因:与软件本身特点有关,缺乏可见性,质量难以评价,规模庞大难以维护。与软件开发维护的不当方法有关,轻视需求分析和维护,对用户的要求没有完整准确的认识就编写程序,忽视程序,文档,数据等软件配置。 2:软件工程:采用工程的概念,原理,技术和方法开发与维护软件,把正确的管理技术和软件开发技术结合起来,经济的开发出高质量的软件并有效的维护。即把系统化的,规范的,可度量的途径应用于软件开发,运行和维护的过程。 3:软件工程7条基本原理:用分阶段的生命周期计划严格管理,坚持进行阶段评审,实行严格的产品控制,采用现代程序设计技术,结果应能清楚地审查,开发小组的人员应该少而精,承认不断改进软件工程实践的必要性。 4:软件工程领域:软件需求,设计,构建(写代码),测试,维护,配置管理,工程管理,工程过程,工程工具,软件质量。
5:软件生命周期:软件定义(问题定义,可行性研究,需求分析),软件开发(概要设计,详细设计,编码和单元测试,综合测试),运行维护(改正性维护,适应性维护,完善性维护,预防性维护)。、 生命周期模型 6:瀑布模型:就是把一个开发过程分成收集需求,分析,设计,编码,测试,维护六部分,只有完成前面一步才能开始后面一步,上一步的输出的文档就是这一步的输入文档,每一步完成都要交出合格的文档,每一步都会有反馈,如果反馈有错误就退回前一步解决问题。瀑布模型的缺点:实际的项目开发很难严格按该模型进行;由于用户只能通过文档来了解产品,客户往往很难清楚地给出所有的需求,而瀑布模型不适应用户需求的变化;软件的实际情况必须到项目开发的后期客户才能看到。 7:快速原型模型:就是根据用户的需求迅速设计出一个原型系统,原型系统具有基本的功能,然后用户使用原型并对原型提出需求和改变,开发人员再对原型进行修改和完善知道用户满意。优点:容易适应需求的变化;有利于开发与培训的同步;开发费用低、开发周期短且对用户更友好。缺点:快速建立起来的系统结构加上连续的修改可能会导致产品质量低下;使用这个模型的前提是要有一个展示
土地开发整理标准(全)
前言 为规范土地开发整理项目规划设计(以下简称“规划设计”)工作、提高规划设计的科学性以及更好地实施土地开发整理规划,根据《中华人民共和国土地管理法》等有关法律、法规、规章制定本标准。 省、自治区、直辖市土地行政主管部门可根据需要制定本标准的补充规定,报国土资源部备案。补充规定不得与本标准相抵触。 本标准从2000年10月1日起实施。 本标准的附录A、附录B、附录C、附录D都是标准的附录。 本标准起草单位:国土资源部土地整理中心。 本标准协作单位:浙江省国土管理局、浙江大学、中国人民大学、北京师范大学。 本标准主要起草人:高向军、范树印、吴次芳、叶艳妹、叶剑平、胡江、吴昌洋、童菊儿、梁进社、张占录、彭群、王爱民。 本标准由国土资源部负责解释。 中华人民共和国国土资源部部标准 土地开发整理项目规划设计规范TD/T1012—2000 1范围 1.1本标准规定了土地开发整理项目规划的总则、内容、程序、方法及成果的基本要求和项目设计的原则、内容及技术要求。 1.2本标准适用于土地开发整理项目规划的编制和土地开发整理项目的设计,并作为与设计有关的概预算、审批等方面的依据。 2引用标准 下列标准所包含的条文,通过在本标准中引用而构成为本标准的条文。本标准出版时,所示版本均为有效。所有标准都会被修订,使用本标准的各方应探讨使用下列标准最新版本的可能性。 GBJ7—1989建筑地基基础设计规范 GB3838—1988地面水环境质量标准 GB5084—1992农田灌溉水质标准 GBT5791一19931:50001:10000地形图图式 GB/T7929一19951:5001:1000,1:2000地形图图式 GB8978—1996污水综合排放标准 GB/T15772—1995水土保持综合治理规划通则 GB/T16453.1—1996水土保持综合治理技术规范坡耕地治理技术 GB/16453.3—1996水土保持综合治理技术规范沟壑治理技术 GB/T16453.4—1996水土保持综合治理技术规范小型蓄排水工程 GB50162—1992道路工程制图标准 GB50188—1993村镇规划标准 GB/T50265—1997泵站设计规范 GB50286—1998堤防工程设计规范 GB50288—1999灌溉与排水工程设计规范 SDJ217—1987水利水电枢纽工程等级划分及设计标准(平原、滨海部分) SL18—1991渠道防渗工程技术规范 SL721994水利建设项目经济评价规范 SL73—1995水利水电工程制图标准 JT/J021—1989公路涵桥设计通用规范 L Y/J002—1987林业工程制图标准 3土地开发整理项目规划设计规范规划
windows系统官网原版下载
微软MSDN官方(简体)中文操作系统全下载 这不知是哪位大侠收集的,太全了,从DOS到Windows,从小型系统到大型系统,从桌面系统到专用服务器系统,从最初的Windows3.1到目前的Windows8,以及Windows2008,从16位到32位,再到64位系统,应有尽有。全部提供微软官方的校验文件,这些文件都可以在微软官方MSDN订阅中得到验证,完全正确! 下载链接电驴下载,可以使用用迅雷下载,建议还是使用电驴下载。你可以根据需要在下载链接那里找到你需要的文件进行下载!太强大了!!! 产品名称: Windows 3.1 (16-bit) 名称: Windows 3.1 (Simplified Chinese) 文件名: SC_Windows31.exe 文件大小: 8,472,384 SHA1: 65BC761CEFFD6280DA3F7677D6F3DDA2BAEC1E19 邮寄日期(UTC): 2001-03-06 19:19:00 ed2k://|file|SC_Windows31.exe|8472384|84037137FFF3932707F286EC852F2ABC|/ 产品名称: Windows 3.2 (16-bit) 名称: Windows 3.2.12 (Simplified Chinese) 文件名: SC_Windows32_12.exe 文件大小: 12,832,984 SHA1: 1D91AC9EB3CBC1F9C409CF891415BB71E8F594F7 邮寄日期(UTC): 2001-03-06 19:21:00 ed2k://|file|SC_Windows32_12.exe|12832984|A76EB68E35CD62F8B40ECD3E6F5E213F|/ 产品名称: Windows 3.2 (16-bit) 名称: Windows 3.2.144 (Simplified Chinese) 文件名: SC_Windows32_144.exe 文件大小: 12,835,440 SHA1: 363C2A9B8CAA2CC6798DAA80CC9217EF237FDD10 邮寄日期(UTC): 2001-03-06 19:21:00 ed2k://|file|SC_Windows32_144.exe|12835440|782F5AF8A1405D518C181F057FCC4287|/ 产品名称: Windows 98 名称: Windows 98 Second Edition (Simplified Chinese) 文件名: SC_WIN98SE.exe 文件大小: 278,540,368 SHA1: 9014AC7B67FC7697DEA597846F980DB9B3C43CD4 邮寄日期(UTC): 1999-11-04 00:45:00 ed2k://|file|SC_WIN98SE.exe|278540368|939909E688963174901F822123E55F7E|/ 产品名称: Windows Me 名称: Windows? Millennium Edition (Simplified Chinese) 文件名: SC_WINME.exe
工作笔记_NetBeans 开发工具及开发问题
NetBeans 开发工具 NetBeans 乱码 不太明白,看看我理解的对不对。你是不是在导入别的代码时,其中的汉字显示不正常,而自己敲进去汉字显示是正常的。 NetBeans默认的编码方式:UTF-8,而其他IDE不同,所以会有显示错误 试试在“项目/文件/服务”的项目窗口中,你的项目名上右击,选择“项目属性”,“常规”类别中的“编码”栏中选择GBK,ISO-8859-1等看看能不能显示正常。。。 补: 建议你到https://www.360docs.net/doc/334511985.html,/downloads/index.html 直接下NetBeans6.9 (语言:简体中文NetBeans IDE 下载包all)的吧。执行中出现https://www.360docs.net/doc/334511985.html,ng.RuntimeException: https://www.360docs.net/doc/334511985.html,ng.RuntimeException: Uncompilable source code - Erroneous sym type: (https://www.360docs.net/doc/334511985.html,ng.String,https://www.360docs.net/doc/334511985.html,ng.String,
2019年土地开发整理标准(全)
前
言
为规范土地开发整理项目规划设计(以下简称“规划设计”)工作 、提高规划设计得科学性以及更 好地实施土地开发整理规划,根据《中华人民共与国土地管理法》等有关法律、法规、规章制定本标准。
省、自治区、直辖市土地行政主管部门可根据需要制定本标准得补充规定,报国土资源部备案。补 充规定不得与本标准相抵触。
本标准从 2000 年 10 月 1 日起实施。 本标准得附录 A、附录 B、附录 C、附录 D 都就是标准得附录。 本标准起草单位:国土资源部土地整理中心。 本标准协作单位:浙江省国土管理局、浙江大学、中国人民大学、北京师范大学。 本标准主要起草人:高向军、范树印、吴次芳、叶艳妹、叶剑平、胡江、吴昌洋、童菊儿、梁进社、 张占录、彭群、王爱民。 本标准由国土资源部负责解释。 中华人民共与国国土资源部部标准 土地开发整理项目规划设计规范 TD/T1012—2000
1 范围
1.1 本标准规定了土地开发整理项目规划得总则、内容、程序、方法及成果得基本要求与项目设计得原则、 内容及技术要求。 1.2 本标准适用于土地开发整理项目规划得编制与土地开发整理项目得设计,并作为与设计有关得概预算、 审批等方面得依据。
2 引用标准
下列标准所包含得条文,通过在本标准中引用而构成为本标准得条文。本标准出版时,所示版本均为 有效。所有标准都会被修订,使用本标准得各方应探讨使用下列标准最新版本得可能性。
GBJ 7—1989 建筑地基基础设计规范 GB 3838—1988 地面水环境质量标准 GB 5084—1992 农田灌溉水质标准 GB T5791 一 1993 1:5000 1:10000 地形图图式 GB/T7929 一 1995 1:500 1:1000,1:2000 地形图图式 GB 8978—1996 污水综合排放标准 GB/T 15772—1995 水土保持综合治理 规划通则 GB/T16453、1—1996 水土保持综合治理 技术规范 坡耕地治理技术 GB/16453、3—1996 水土保持综合治理 技术规范 沟壑治理技术 GB/T 16453、4—1996 水土保持综合治理 技术规范 小型蓄排水工程 GB 50162—1992 道路工程制图标准 GB 50188—1993 村镇规划标准 GB/T 50265—1997 泵站设计规范 GB 50286—1998 堤防工程设计规范 GB 50288—1999 灌溉与排水工程设计规范 SDJ 217—1987 水利水电枢纽工程等级划分及设计标准(平原、滨海部分) SL 18—1991 渠道防渗工程技术规范 SL 721994 水利建设项目经济评价规范 SL 73—1995 水利水电工程制图标准 JT/J 021—1989 公路涵桥设计通用规范 LY/J002—1987 林业工程制图标准
3 土地开发整理项目规划设计规范规划
3、1 总则 3、1、1 本标准所称土地开发整理包括土地开发、土地整理、土地复垦。 3、1、2 规划得基本原则
a) 十分珍惜、合理利用土地与切实保护耕地。 b) 社会效益、经济效益、生态效益相统一。
(完整版)(考研复试)软件工程笔记
1:软件危机:问题1:如何开发软件,以满足对软件日益增长的需求。问题2:如何维护数量不断膨胀的软件。表现:对软件开发成本和时间估计不准,用户对已完成软件不满意,软件质量不可靠,软件不可维护,软件缺少文档,软件成本过高,软件跟不上硬件发展速度。原因:与软件本身特点有关,缺乏可见性,质量难以评价,规模庞大难以维护。与软件开发维护的不当方法有关,轻视需求分析和维护,对用户的要求没有完整准确的认识就编写程序,忽视程序,文档,数据等软件配置。 2:软件工程:采用工程的概念,原理,技术和方法开发与维护软件,把正确的管理技术和软件开发技术结合起来,经济的开发出高质量的软件并有效的维护。即把系统化的,规范的,可度量的途径应用于软件开发,运行和维护的过程。3:软件工程7条基本原理:用分阶段的生命周期计划严格管理,坚持进行阶段评审,实行严格的产品控制,采用现代程序设计技术,结果应能清楚地审查,开发小组的人员应该少而精,承认不断改进软件工程实践的必要性。 4:软件工程领域:软件需求,设计,构建(写代码),测试,维护,配置管理,工程管理,工程过程,工程工具,软件质量。 5:软件生命周期:软件定义(问题定义,可行性研究,需求分析),软件开发(概要设计,详细设计,编码和单元测
试,综合测试),运行维护(改正性维护,适应性维护,完善性维护,预防性维护)。、 生命周期模型 6:瀑布模型:就是把一个开发过程分成收集需求,分析,设计,编码,测试,维护六部分,只有完成前面一步才能开始后面一步,上一步的输出的文档就是这一步的输入文档,每一步完成都要交出合格的文档,每一步都会有反馈,如果反馈有错误就退回前一步解决问题。瀑布模型的缺点:实际的项目开发很难严格按该模型进行;由于用户只能通过文档来了解产品,客户往往很难清楚地给出所有的需求,而瀑布模型不适应用户需求的变化;软件的实际情况必须到项目开发的后期客户才能看到。 7:快速原型模型:就是根据用户的需求迅速设计出一个原型系统,原型系统具有基本的功能,然后用户使用原型并对原型提出需求和改变,开发人员再对原型进行修改和完善知道用户满意。优点:容易适应需求的变化;有利于开发与培训的同步;开发费用低、开发周期短且对用户更友好。缺点:快速建立起来的系统结构加上连续的修改可能会导致产品质量低下;使用这个模型的前提是要有一个展示性的产品原型,因此在一定程度上可能会限制开发人员的创新。 8:增量模型:就是把软件分成许多个构件,每个构件分别当做一个软件来分析,设计,编码,测试。开发人员一次一
土地开发与整理笔记
土地开发与整理重点复习提纲 一、名词解释 1、土地开发:指对未利用过但具有利用潜力和开发价值的土地采用工程或其他措施,改造为可供利用土地的过程。 2、土地整理:(1)对一个地区或一个流域,通过基础措施进行宏观调控。(2)在一定区域内,按照土地的目标用途,采取行政、法律、技术措施进行调控,提高其利用率,改善生产生活条件。 3、土地复垦:是对各种人为和自然原因导致破坏的土地,因地制宜地制定各种整治措施,使其恢复到可利用的期望状态。 4、土地退化:由于人为或自然原因,造成土地生产力下降或可利用土地面积减少。 5、土地改良:为了防止土地退化,改变土地的不良性状和提高土地的生产潜力而采取的技术措施。(工程措施、生物措施、农业技术措施) 6、盐碱土:指当土壤中的可溶性盐分受到环境或人为因素的影响,不断地在表土积累,当达到危害植物生产时,土壤称为盐碱土。 7、矿化度ESP:代换性钠离子占整个代换性阳离子的百分数。
8、水盐平衡:是以动态平衡的观点和基本理论,对某一地区某一时间水分和盐分数量上的盈亏分析。 9、可溶性钠SSP:是指可溶性钠离子的含量占可溶性阳离子的百分数。 钠吸附比SAR:是指钠离子的含量比上√(Ca2++Mg2+)/2。 10、冲洗定额:单位面积土地上使计划的脱盐层盐分含量降低作物正常生长程度所需要的冲洗量。M(方/亩) =m1+m2+n-o m1:冲洗前灌水灌到田间持水量时所需的水量,m2:计划脱盐层的盐分降至作物正常生长时的盐分所需要的冲洗水量。 M2=666.67×h×p·(s1-s2)/k p:土壤容重,s:含盐量,k:排盐系数,每方水从脱盐层冲走的盐分,n:蒸发损失的水量,o:降水 11、淤灌定额:淤灌区达到淤灌层厚度所需要水的数量(亩/方) M(亩/方)=667×H·a/s a:土壤容重,s:每方水含泥沙量 12、土地污染防治:由于人为活动使污染物进入土壤,超过土壤自净能力,引起土壤组成、结构、性质及功能的劣变,从而影响了作物产量、质量和人体健康。 二、简答及论述
Windows7官方个版本正版镜像下载地址
Windows7官方个版本正版镜像下载地址 简体中文旗舰版: 32位:下载地址:ed2k://|file|cn_windows_7_ultimate_x86_dvd_x15-65907.iso|2604238848|D6F139D7A45E81B 76199DDCCDDC4B509|/ SHA1:B589336602E3B7E134E222ED47FC94938B04354F 64位:下载地址:ed2k://|file|cn_windows_7_ultimate_x64_dvd_x15-66043.iso|3341268992|7DD7FA757CE6D2D B78B6901F81A6907A|/ SHA1:4A98A2F1ED794425674D04A37B70B9763522B0D4 简体中文专业版: 32位:下载地址:ed2k://|file|cn_windows_7_professional_x86_dvd_x15-65790.iso|2604238848|e812fbe758f 05b485c5a858c22060785|h=S5RNBL5JL5NRC3YMLDWIO75YY3UP4ET5|/ SHA1:EBD595C3099CCF57C6FF53810F73339835CFBB9D 64位:下载地址:ed2k://|file|cn_windows_7_professional_x64_dvd_x15-65791.iso|3341268992|3474800521d 169fbf3f5e527cd835156|h=TIYH37L3PBVMNCLT2EX5CSSEGXY6M47W|/ SHA1:5669A51195CD79D73CD18161D51E7E8D43DF53D1 简体中文家庭高级版: 32位:下载地址:ed2k://|file|cn_windows_7_home_premium_x86_dvd_x15-65717.iso|2604238848|98e1eb474f9 2343b06737f227665df1c|h=GZ7FZE7XURI5HNO2L7H45AGWNOLRLRUR|/ SHA1:CBA410DB30FA1561F874E1CC155E575F4A836B37 64位:下载地址:ed2k://|file|cn_windows_7_home_premium_x64_dvd_x15-65718.iso|3341268992|9f976045631 a6a2162abe32fc77c8acc|h=QQZ3UEERJOWWUEXOFTTLWD4JNL4YDLC6|/ SHA1:5566AB6F40B0689702F02DE15804BEB32832D6A6 简体中文企业版: 32位:下载地址:ed2k://|file|cn_windows_7_enterprise_x86_dvd_x15-70737.iso|2465783808|41ABFA74E5735 3B2F35BC33E56BD5202|/ SHA1:50F2900D293C8DF63A9D23125AFEEA7662FF9E54 64位:下载地址:ed2k://|file|cn_windows_7_enterprise_x64_dvd_x15-70741.iso|3203516416|876DCF115C2EE 28D74B178BE1A84AB3B|/ SHA1:EE20DAF2CDEDD71C374E241340DEB651728A69C4